"Someone who made one big purchase six months ago" versus "someone who buys a little every month." Which is the more valuable customer? Look at spend alone and you'll mistake the first for a loyal one. The standard way to put customers in order of importance is RFM analysis. It ranks them on three things: how recently they bought, how often, and how much they spent.
This article covers what the three metrics mean, scoring and the four steps, what to do for loyal and at-risk customers, and how RFM differs from the cohort analysis it's often mentioned alongside — with charts and examples. Then it connects to one more view: which channels bring you the most repeat buyers — the loyal customers you want more of — measured by revenue efficiency.
Table of Contents
Key Takeaways#
-
RFM analysis = ranking customers by recency, frequency, and monetary value
The name comes from Recency (last purchase date), Frequency (number of purchases), and Monetary (amount spent).
-
Look at monetary value (M) alone and you'll misjudge your best customers
A repeat buyer beats a big one-time spender. Add recency (R) and frequency (F) to see the truly loyal ones.
-
The goal is to decide who gets which tactic
Keep loyal customers, win back at-risk ones, nurture new ones — each with a different action.
-
RFM works at the individual-customer level — accounting / CRM territory
The thinking is simple, but redoing it every month is heavy. RFM itself assumes order data joined per customer.
-
"Where to invest to grow loyal customers" is a different view
Which channels efficiently bring back repeat buyers is read from per-channel new vs returning revenue efficiency.
1. What Is RFM Analysis: Sorting Customers by 3 Metrics#
Bottom line: RFM analysis ranks customers using three numbers — recency, frequency, and monetary value.
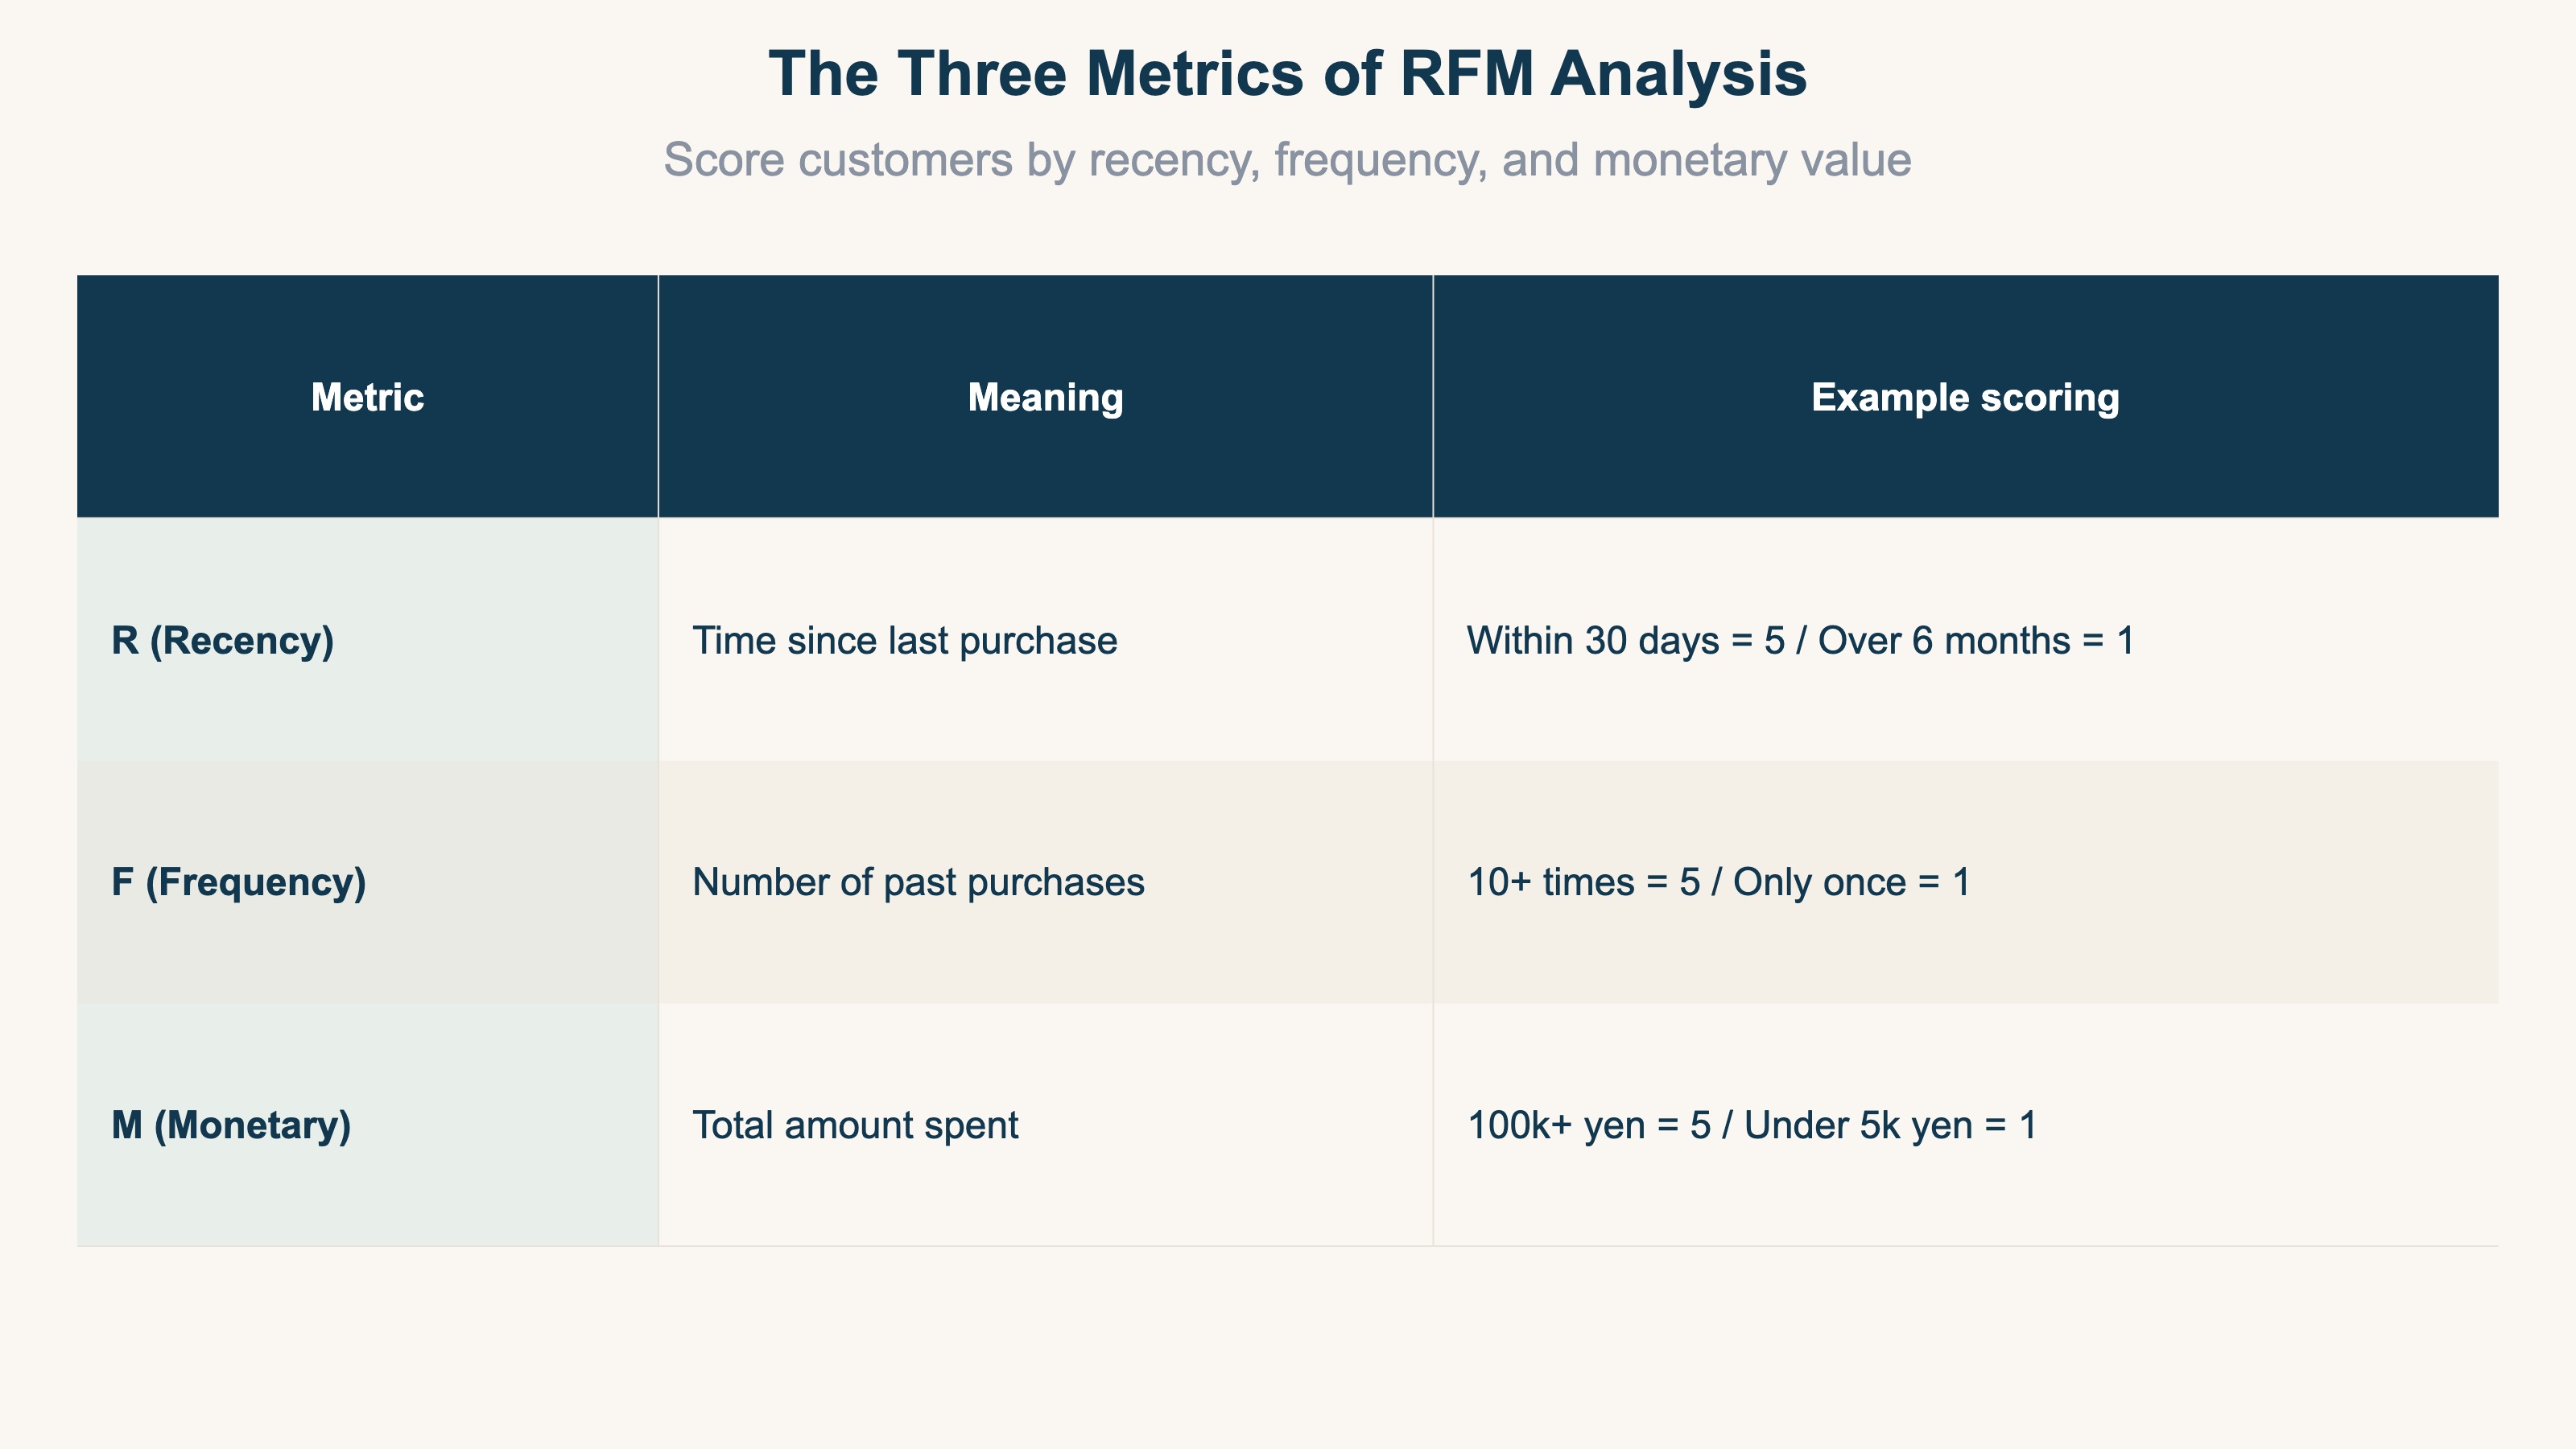
RFM analysis evaluates customers on three metrics and sorts them into groups. The name comes from the initials of three words:
- R (Recency / last purchase date): How long since they last bought
- F (Frequency / purchase count): How many times they have bought
- M (Monetary / amount spent): How much they have spent in total
Combine the three, and customers who bought "recently, often, and for a lot" stand out as your most valuable. It also surfaces people who "used to buy often but haven't come back lately."
Why use all three? Because a single metric misleads you. If you prize only "customers who spent a lot," you'll mistake someone who made one big purchase six months ago and never returned for a loyal customer. Add "did they buy recently (R)" and "how often (F)," and the truly active customers become visible. That's what the title means: a repeat buyer beats a big one-time spender. Acquiring new customers is said to cost more than retaining existing ones[1], so deciding whom to keep ties directly to revenue.
2. Scoring RFM and the 4 Steps#
Bottom line: Score each metric on a scale (such as 1–5), combine them, and run it in four steps — collect, score, segment, decide tactics.
In RFM analysis, you turn each of the three metrics into a score. A common approach is a 1-to-5 scale. Here are example scoring rules:
- R (how recently they bought): Within 30 days = 5, over six months ago = 1
- F (how often they bought): 10+ times = 5, only once = 1
- M (how much they spent): 100k+ yen total = 5, under 5k yen = 1
You set the cutoffs by looking at your own customer data. For purchase count, for instance, look at customers by count, give the top 20% a 5, the next 20% a 4, and so on — that's easy to follow.
Once you have the three scores, combine them to judge the customer type.
| Example RFM score | Customer state | Read |
|---|---|---|
| R5・F5・M5 | Recent, frequent, high-spend | Top customer (VIP) |
| R5・F2・M2 | Just started buying | New / nurture candidate |
| R1・F5・M5 | Once loyal, gone quiet | At-risk (needs win-back) |
| R1・F1・M1 | No purchase for a long time | Dormant customer |
Unlike ARPU (average revenue per user), which averages spend across customers, RFM captures customers not as one lump but as state-based groups.
The run is four steps:
- Collect — Gather "last purchase date, purchase count, total spend" per customer (pull from your cart system's order history)
- Score — Turn R, F, and M into points. Three levels (high / medium / low) are fine to start
- Segment — Group customers by the score combination. About five groups — loyal, stable, new, at-risk, dormant — is enough to start
- Decide tactics — Set a tactic per group. Don't stop at sorting; only when you decide this does revenue move
The thinking itself isn't hard. You score the metrics and split into groups. What's heavy is redoing it every month. As customers grow and purchases pile up, last purchase date, count, and amount all change — so you have to re-aggregate every customer and re-score, again and again.
3. Tactics by Segment: Loyal vs. At-Risk Customers#
Bottom line: Change tactics by group. Focusing on the people where it works beats sending everyone the same email.
The real value of RFM analysis is changing tactics by group. Here are the main groups and the tactics that suit them:
- Top customers (high R, high F, high M): Retention first. Limited early-access sales or thank-you perks make them feel valued.
- At-risk (low R, high F, high M): Once loyal. Win-back coupons or a "we've missed you" message work.
- New / nurture (high R, low F): Drive the second purchase. Post-purchase follow-up emails or product recommendations.
- Dormant (low R, low F, low M): Reactivation, but keep the budget modest — this group responds weakly.
Send everyone the same email and you get a mediocre result: too thin for loyal customers, off-key for dormant ones. The aim of RFM analysis is to focus limited budget and effort where it works. Win-back tactics for at-risk customers are especially cost-effective, because retaining existing customers is cheaper than acquiring new ones and contributes more to revenue[2].
To measure the effect, track how each treated group's revenue changes afterward. To see that link between tactic and revenue, it helps to have channel- and tactic-level revenue ready to compare at a glance. The revenue-first approach to analysis is covered in designing a revenue dashboard.
4. RFM Analysis vs. Cohort Analysis#
Bottom line: RFM shows the current state of customers; cohort analysis shows the trend by acquisition period. Different angles.
The method most often mentioned alongside RFM is cohort analysis. Both sort customers, but they look from different angles.
- RFM analysis: Classifies current customers by recency, frequency, and monetary value. A method for deciding "who gets what."
- Cohort analysis: Groups customers by when they were acquired (e.g., January customers, February customers) and tracks repeat rate over time. A method for seeing "when they tend to drop off."
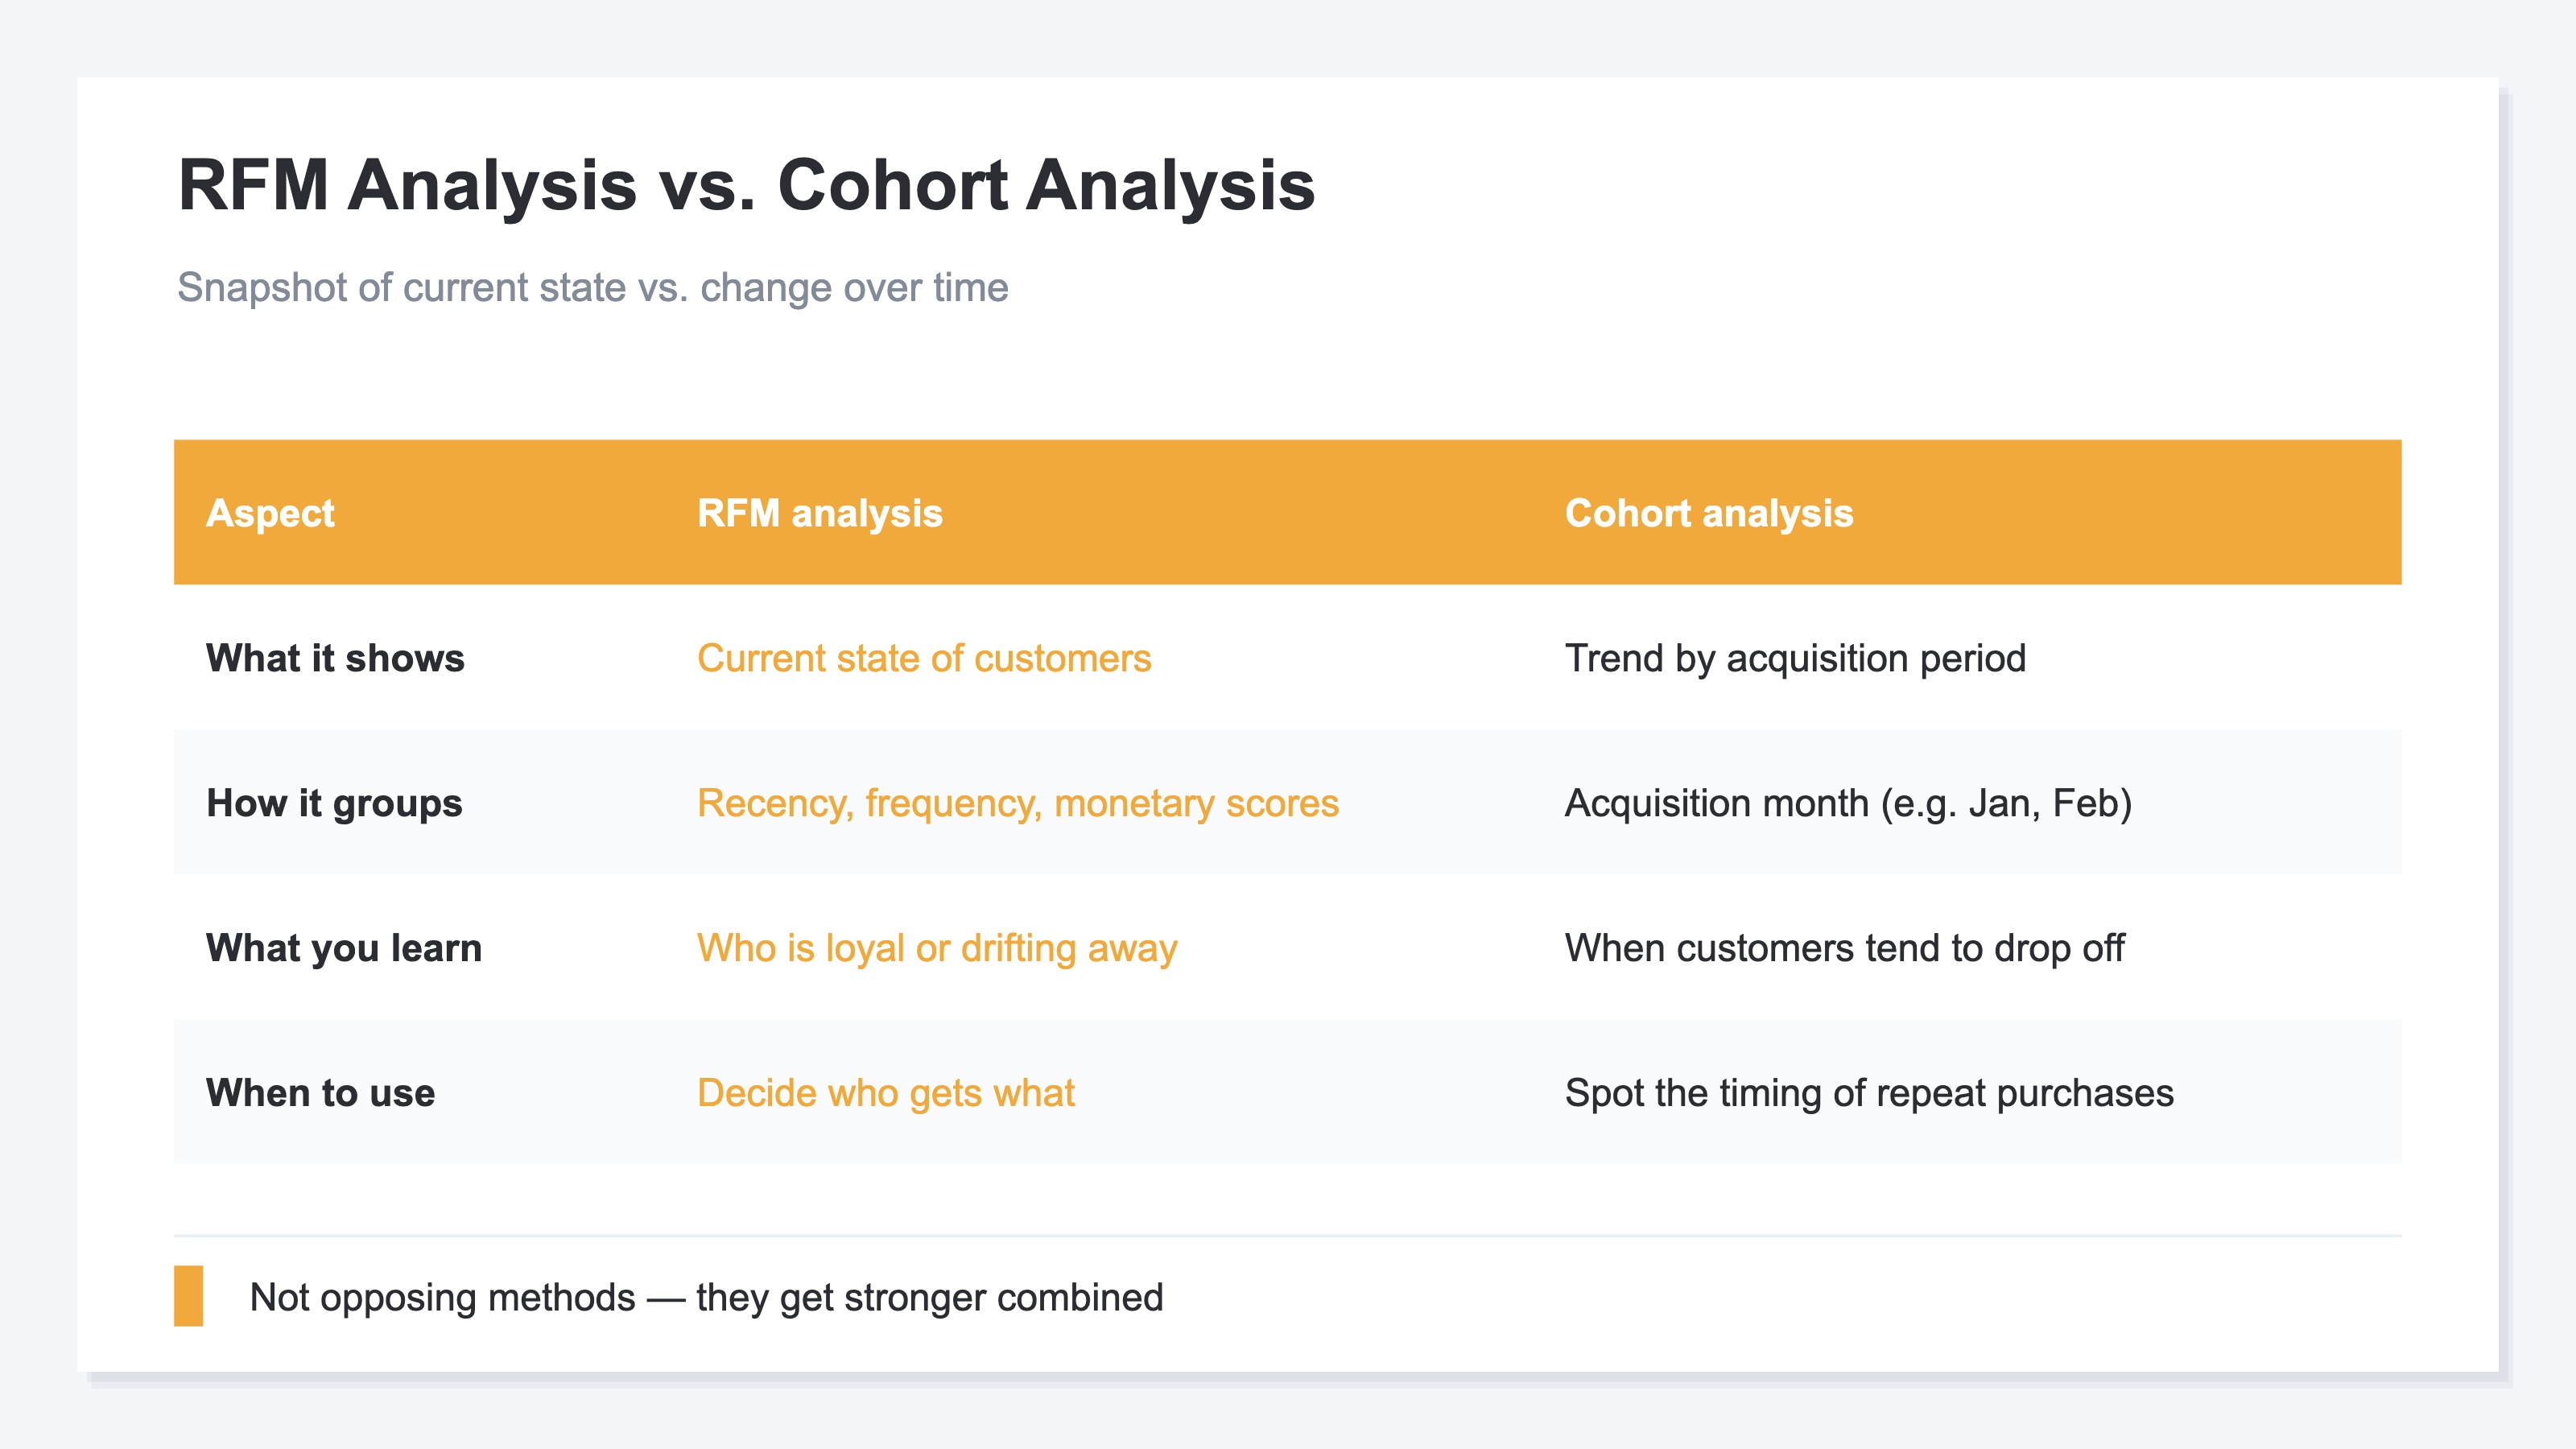
If you want to know "how many days after the first order the second purchase tends to happen," use cohort analysis; if you want to decide "who to prioritize among current customers," use RFM. The two aren't opposed — you can combine them. If cohort analysis shows "customers tend to drop off 60 days after the first order," use RFM to pull out customers whose R is starting to slip, and act before day 60 arrives.
RevenueScope's solution
Bottom line: RFM tells you who your loyal customers are. Which channels bring them back is what RevenueScope shows, by revenue efficiency.
RFM analysis tells you who your loyal customers are. But it won't tell you which channels bring back those loyal customers — the repeat buyers — most of all.
RFM's three metrics only come together once you build each customer's purchase history from accounting software or CRM / cart order data. As the previous section showed, the thinking is simple, but redoing it every month is heavy work.
"Where to invest to grow loyal customers," meanwhile, is something you can read from a different view than per-customer RFM: per-channel revenue efficiency for new versus returning visitors. GA4 gives you channels and new/returning, but bringing "revenue per session (RPS) for new and for returning visitors, by channel" onto one screen isn't something the standard reports surface.
RevenueScope brings, from your on-site sales data, the revenue efficiency of new and returning (different-day revisit) visitors onto one screen by channel. It counts only real visits, with bots (automated traffic) removed.
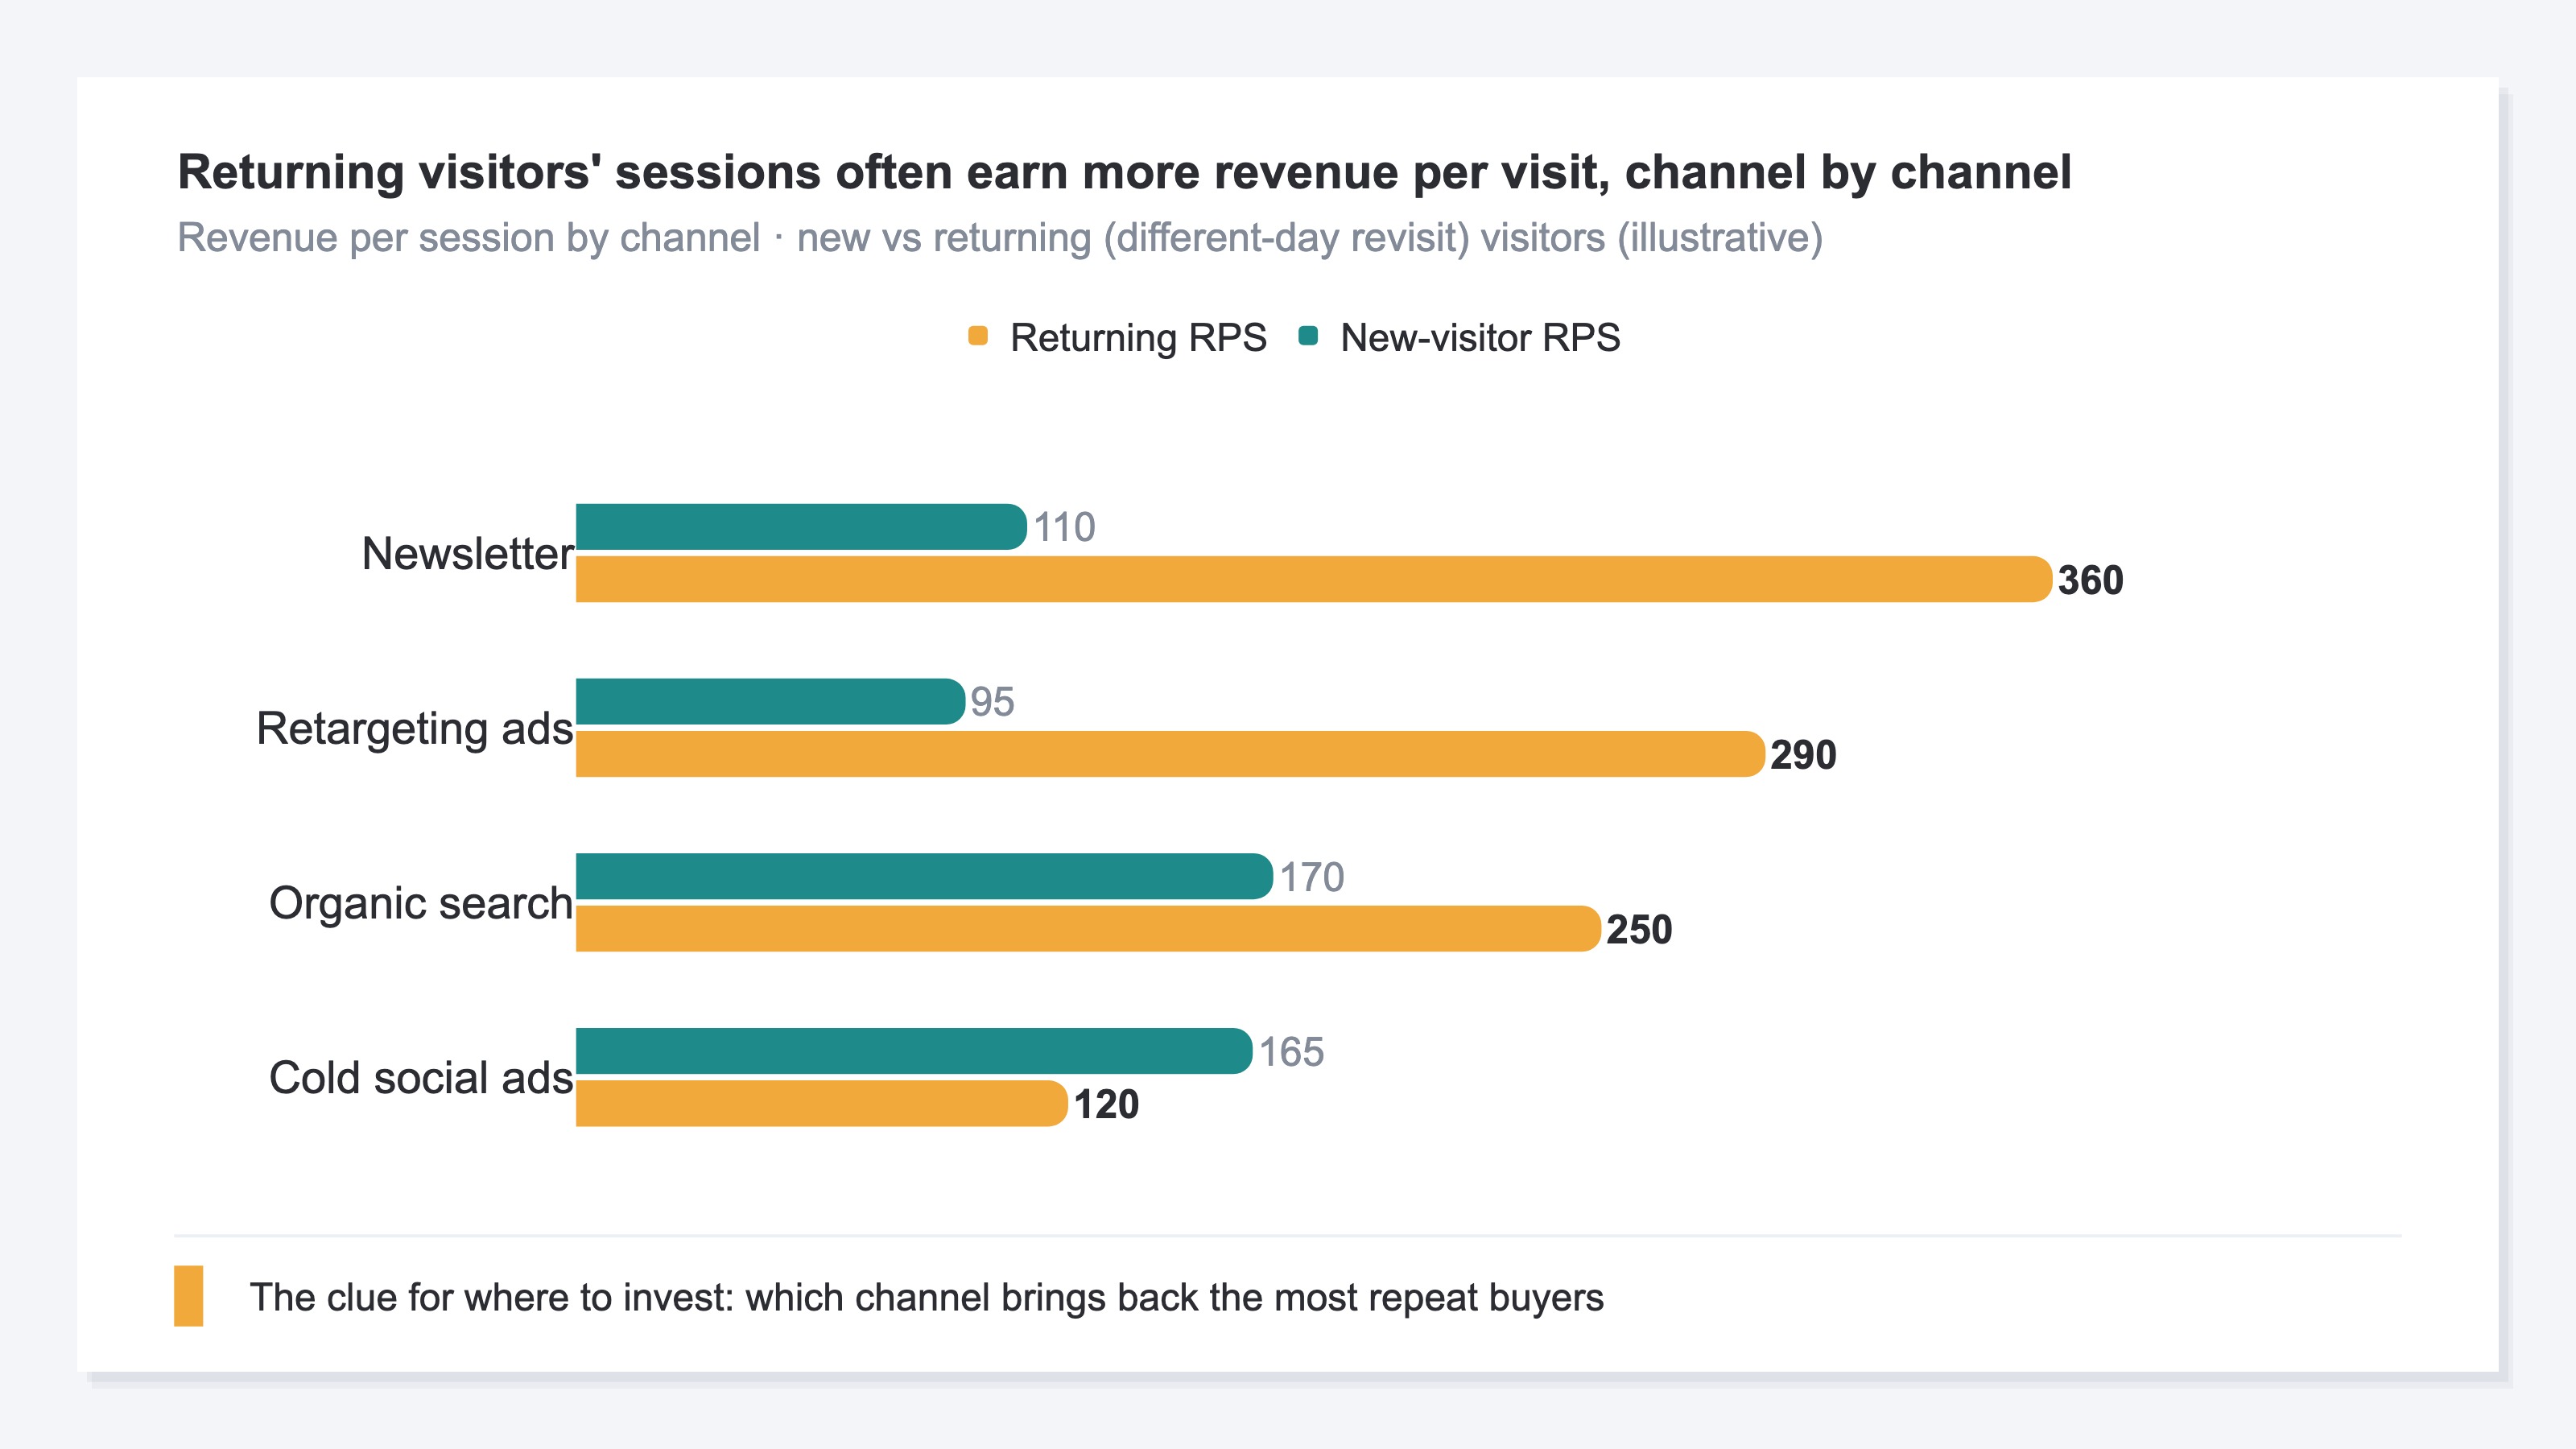
| Channel | New RPS | Returning RPS | CVR (purchase rate) |
|---|---|---|---|
| Newsletter | 110 | 360 | 7.8% |
| Organic search | 170 | 250 | 5.4% |
| Retargeting ads | 95 | 290 | 6.1% |
| Cold social ads | 165 | 120 | 2.2% |
(Figures are demo data in revenue per session. An illustration of how it looks per channel in RevenueScope.)
Reading this table, newsletter and retargeting ads earn roughly three times more revenue per returning visit than per new visit. Cold social ads, by contrast, are higher for new visitors and rarely turn into repeat buyers. Investing to grow loyal customers pays off most in the channels that bring back the most repeat buyers — and which channel to work on next becomes visible from this single view. How channel efficiency flips between new and returning is covered in why higher-ROAS channels can be riskier (telling new from returning), and how to compute revenue per session itself is in the RPS calculation guide.
RevenueScope specializes in the revenue efficiency of new and returning visitors by channel. Each customer's lifetime value (LTV) or churn rate is handled by the accounting software or CRM / cart systems that join order data per customer (the LTV concept is covered in the customer lifetime value (LTV) guide). The "new / returning" in RevenueScope is a session attribute — whether the visitor came back on a different day — a different cut from RFM's per-customer "frequency (F)." That's exactly why they pair well: use RFM to tell "who is loyal" on the CRM side, and RevenueScope to tell "which channels bring loyal customers back" from revenue efficiency — combine the two roles and you can see all the way to where to invest to grow loyal customers.
FAQ#
Q. How many customers do you need for RFM analysis to be meaningful?
You can start from a few hundred. While your customer count is small, don't fixate on a 5-point scale — start with three groups (loyal / regular / at-risk), which is easier to run. As customers grow, make the scale more granular.
Q. Which of R, F, and M should I weigh most?
Many ecommerce businesses weigh R (recency) most. Time since the last purchase is the earliest sign of churn. But for high-ticket items where purchase frequency is naturally low, you'll want to adjust — for example, raising the weight on M (monetary).
Q. Can RevenueScope do RFM analysis (ranking customers)?
What RevenueScope surfaces is per-channel revenue efficiency for new and returning (different-day revisit) visitors (RPS, AOV, CVR). Per-customer RFM scores, segments, and lifetime value (LTV) are handled by the accounting software or CRM that join order data per customer. Use RFM to tell "who is loyal," then let RevenueScope judge "which channels bring those loyal customers back" from revenue efficiency.
Summary#
RFM analysis ranks customers by three numbers: recency, frequency, and monetary value. Look at monetary value (M) alone and you'll mistake a big one-time spender for a loyal customer. Add recency (R) and frequency (F) to see the repeat buyers who truly matter. The goal isn't sorting — it's deciding who gets which tactic: keep loyal customers, win back at-risk ones, nurture new ones. But RFM works at the individual-customer level, in accounting / CRM territory, and while the thinking is simple, redoing it every month is heavy. On top of that, "where to invest to grow loyal customers" is read from per-channel new vs returning revenue efficiency. Which channels efficiently bring back repeat buyers — keeping that comparison ready makes the next move easier to decide.
See which ads actually drive revenue, at a glance
Free up to 5,000 sessions/month, AI analyst included. No credit card required. Up and running in 5 minutes.