
"Ads brought in more customers. But honestly, I have no idea how much revenue we're getting per person." Run an online shop and you hear this all the time. The number that captures "revenue per user" is ARPU (Average Revenue Per User).
ARPU has a reputation as a subscription or app metric, but it works in EC too—when you want to compare "how much revenue each user generates, by acquisition channel." The difference from the often-confused ARPPU comes down, in a word, to the "denominator." This article lays out, in order, the ARPU formula, how it differs from ARPPU, benchmarks by business type, and why aligning those numbers by channel and by new/returning to view them every month turns out to be heavy by hand.
Table of contents
This article in brief#
- ARPU is "revenue per user, with all users as the denominator." The formula is "revenue / total users," and it includes people who didn't buy in the denominator
- ARPPU is "revenue per buyer, with buyers only as the denominator." Only the denominator differs, but what you're looking at changes. The relationship is ARPU = conversion rate (CVR) x ARPPU
- ARPU suits investment decisions on acquisition channels; ARPPU suits improving order value. But aligning either one by channel and by new/returning to view it every month is heavy work by hand
1. What ARPU is (the formula)#
In short, ARPU is "the average revenue per user"—revenue divided by total users.
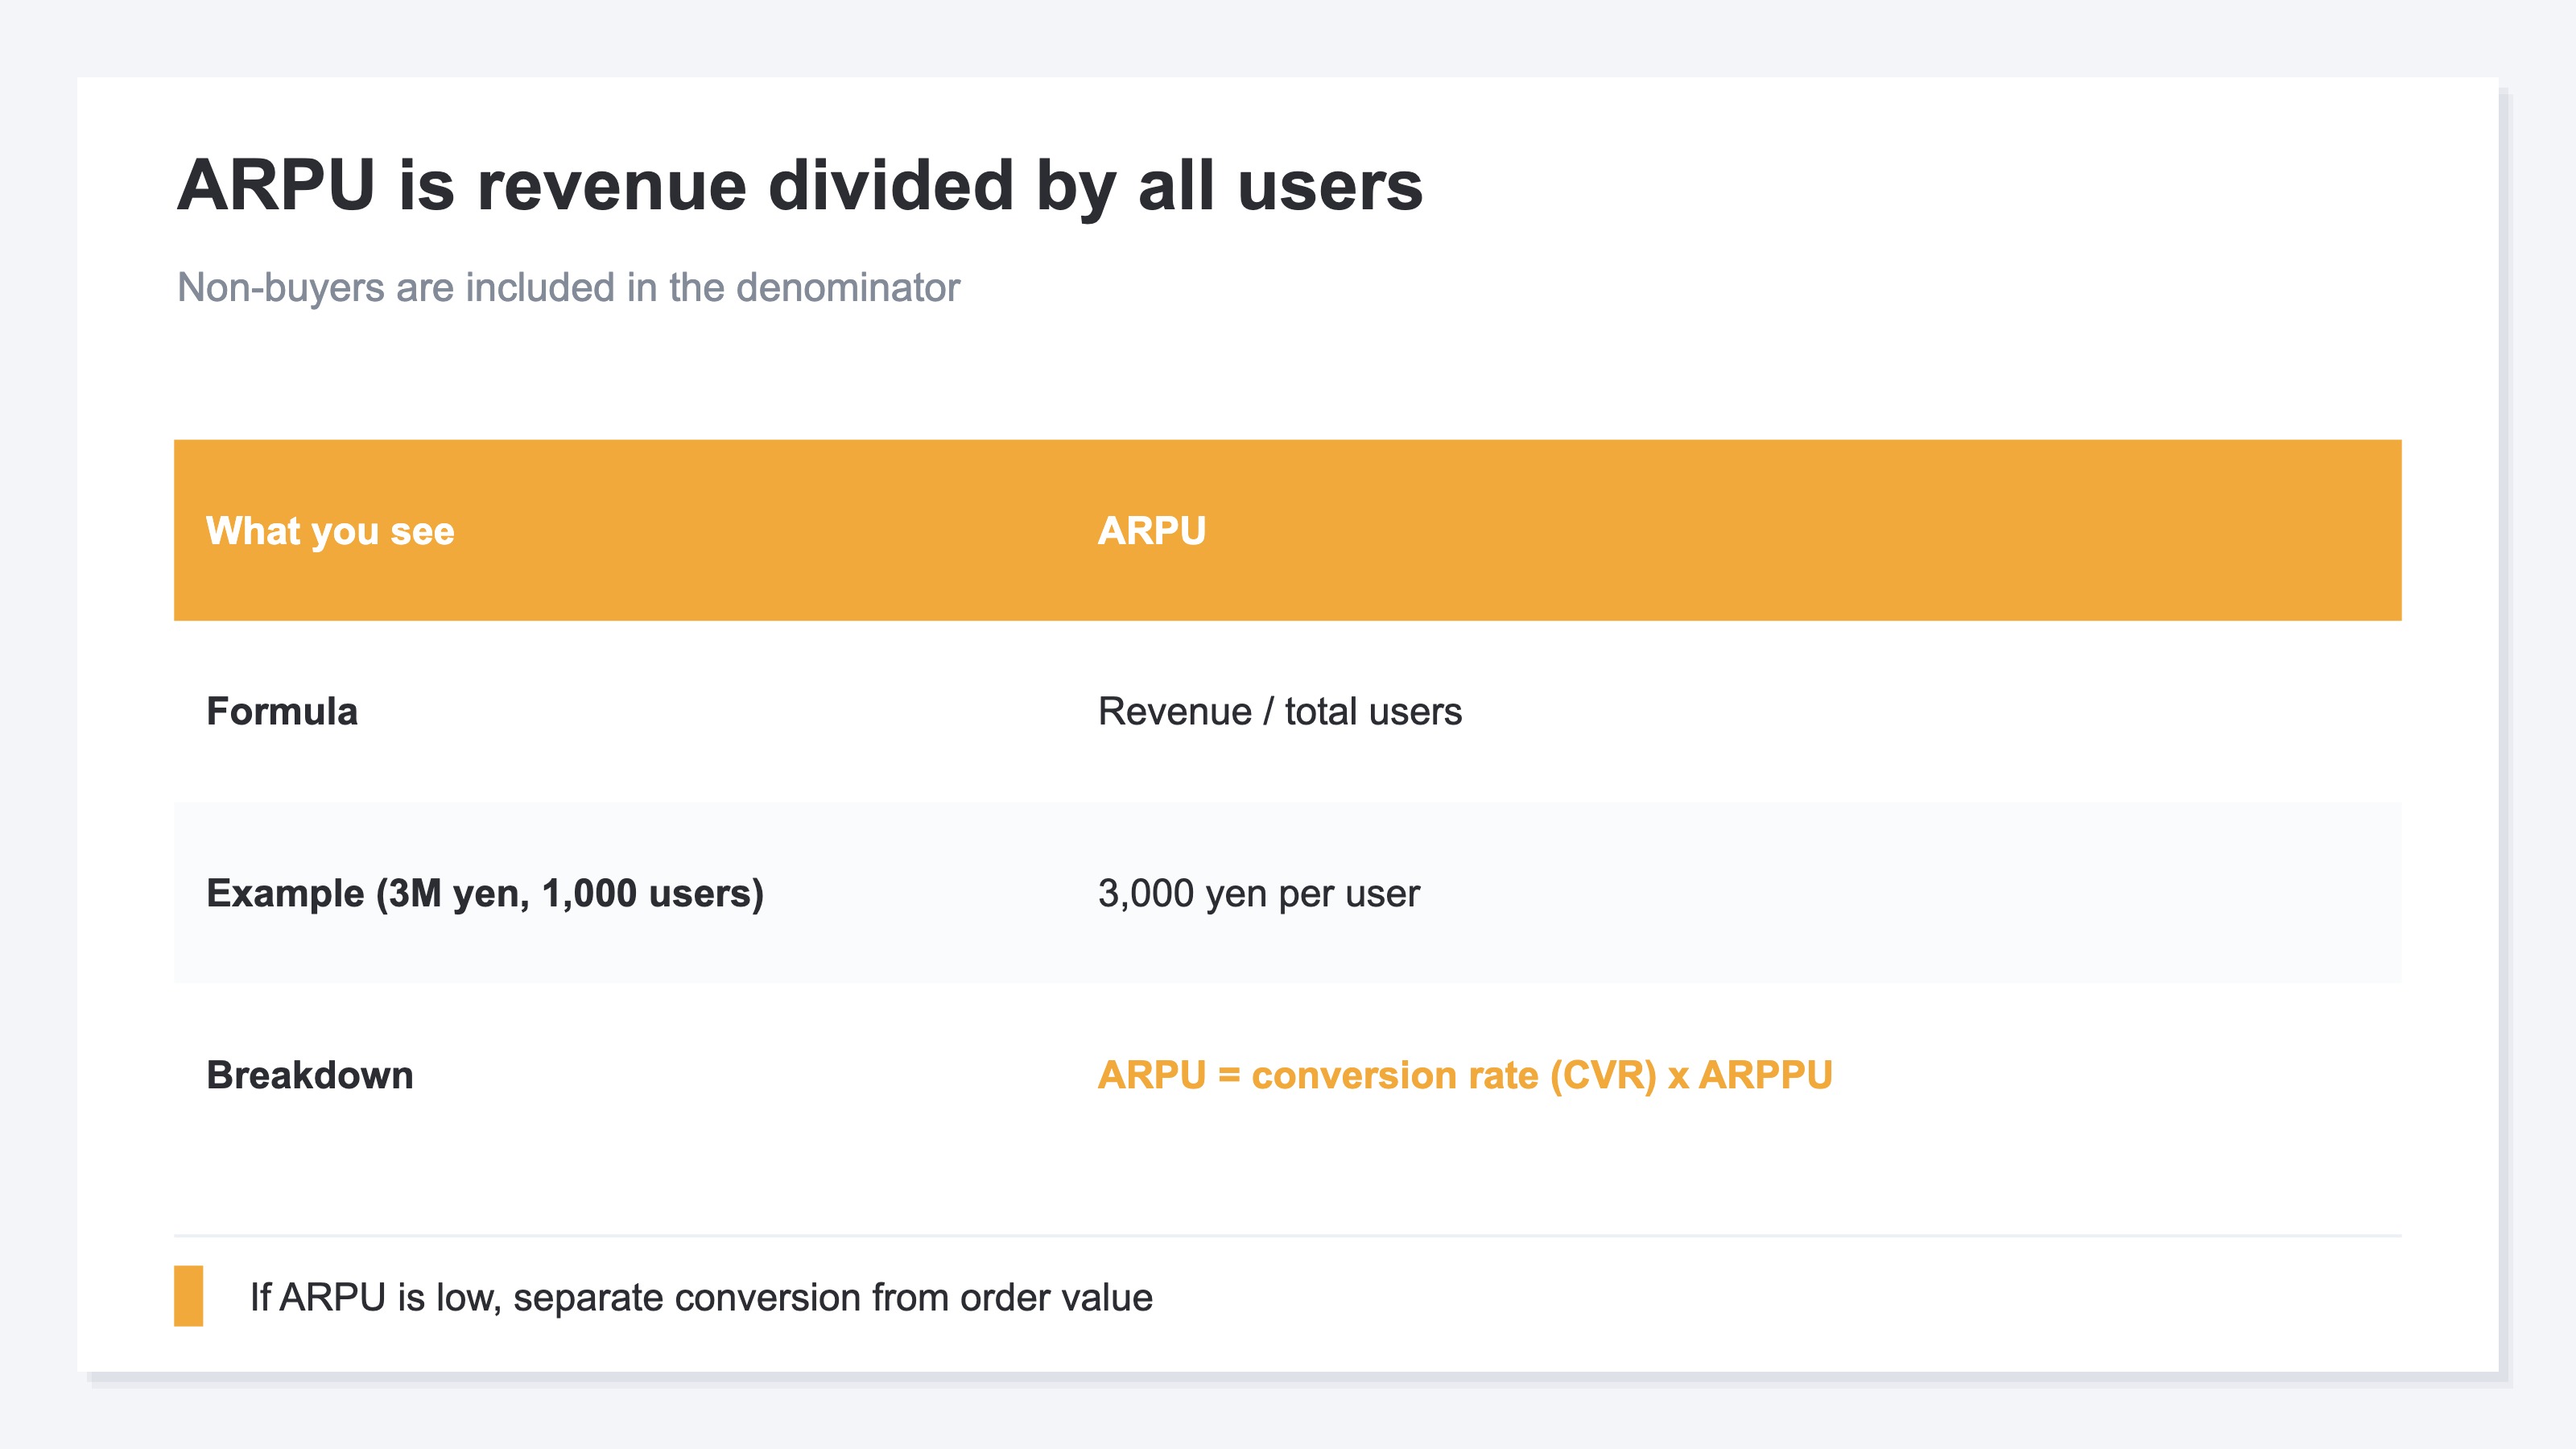
ARPU (Average Revenue Per User) is the revenue over a period divided by the number of users in that period. The formula is simple: "ARPU = revenue / users (total)." For example, if a month's revenue is ¥3,000,000 and you had 1,000 monthly users, ARPU is ¥3,000. It means "each user generated ¥3,000 of revenue that month."
The key point is that the denominator is "all users." People who bought, people who only browsed and didn't buy, free members—all of them are in the denominator. So when ARPU is low, you need to separate whether it's because "few people buy (a conversion rate / CVR problem)" or "each purchase is small (an order value problem)." ARPU is the product of those two [1]. As a formula: "ARPU = CVR x ARPPU." That breakdown leads straight into the difference from ARPPU covered in the next section.
2. The difference between ARPU and ARPPU is the denominator#
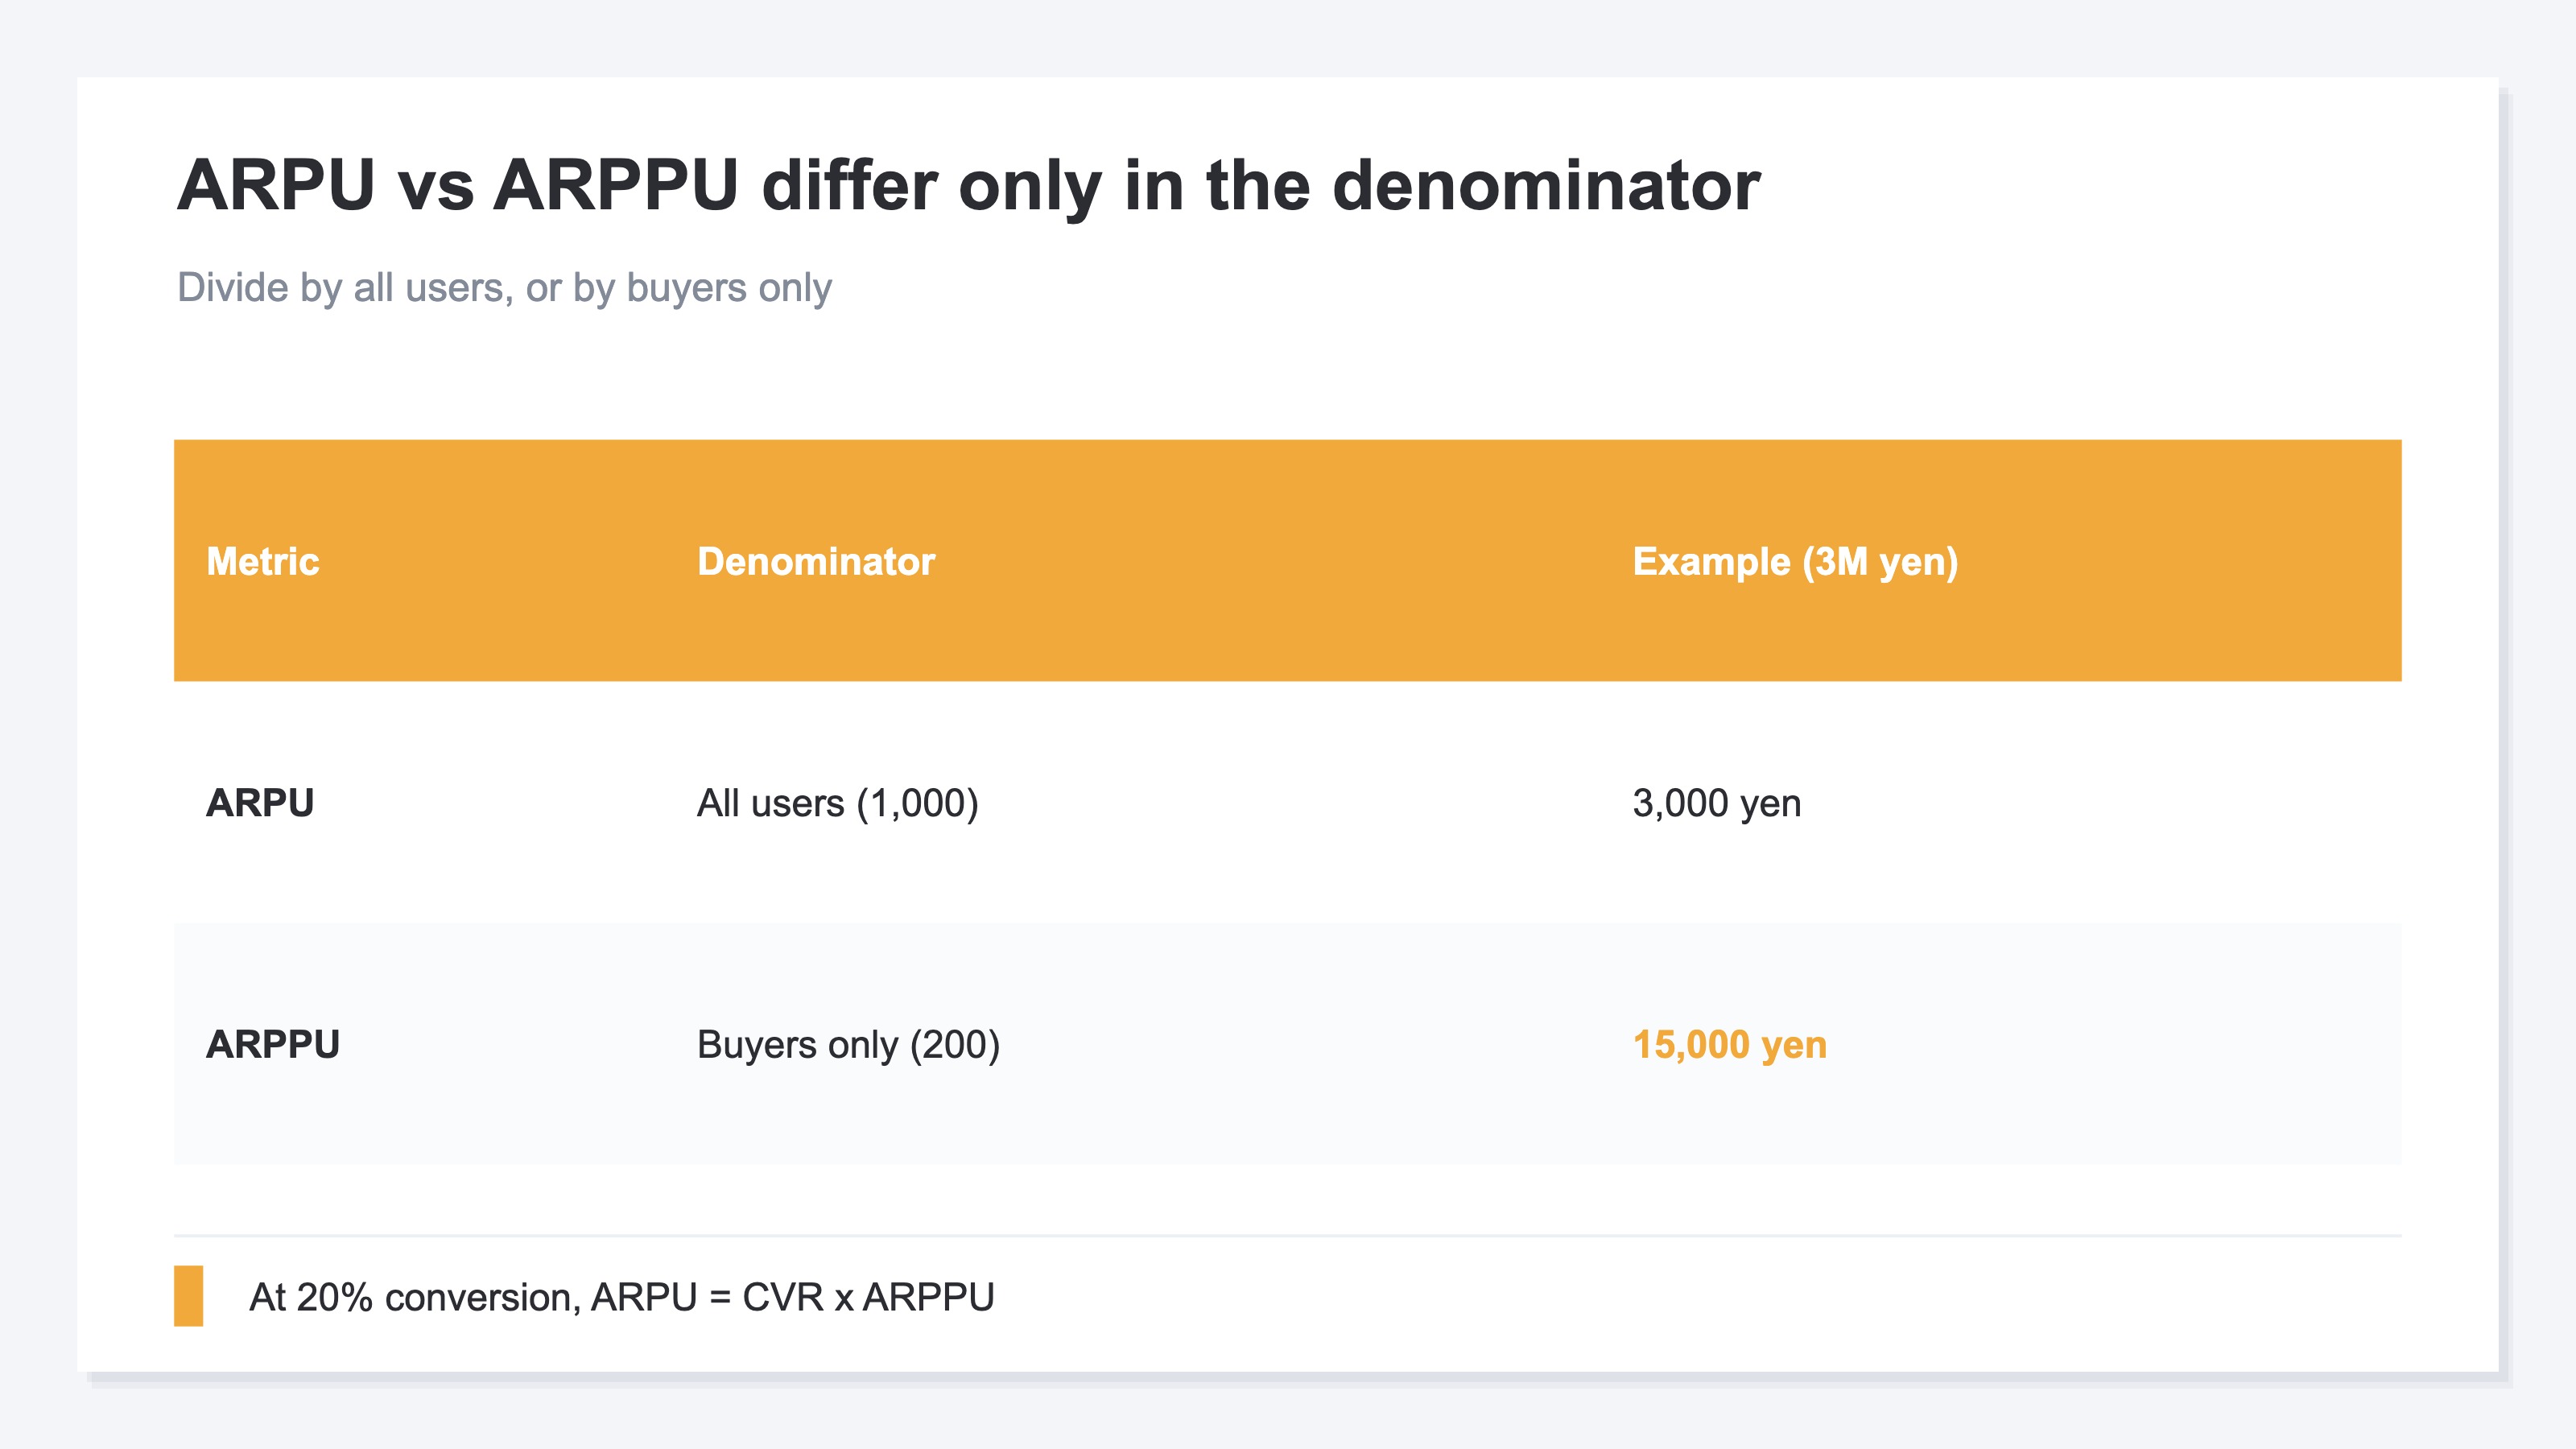
As noted, the only difference between ARPU and ARPPU is the denominator. ARPU uses all users; ARPPU uses buyers only.
ARPPU (Average Revenue Per Paying User) narrows the denominator to buyers only. The formula is "ARPPU = revenue / number of paying users." Using the same ¥3,000,000 monthly revenue, if 200 people bought, ARPPU is ¥15,000. That's five times the ARPU (¥3,000) you get dividing by all 1,000 users. The reason is that the conversion rate (CVR) is 20%—this is exactly the "ARPU = CVR x ARPPU" relationship (3,000 = 20% x 15,000).
Here's how to choose between them. Use ARPU for investment decisions on acquisition channels—it suits comparing "the revenue from bringing in one person" across channels A and B, including the difference in conversion rate. Use ARPPU for improving order value—when you want to raise the average amount of those who bought, and to see the effect of cross-selling and upselling, this is the one [2]. For the business as a whole, look at both: whether ARPU rose because "CVR rose" or because "ARPPU rose"—that breakdown decides your next move. Note that in EC, "average order value (AOV)" and ARPPU are used almost interchangeably, but strictly, AOV is the average "per order" and ARPPU is the average "per buyer." If the same person buys twice in a month, the two diverge. We cover calculating and raising order value in How to Correctly Calculate and Raise AOV.
3. ARPU benchmarks vary by business type#
In short, the level of ARPU varies widely by business type. So compare against your own type's level, not a cross-industry average.
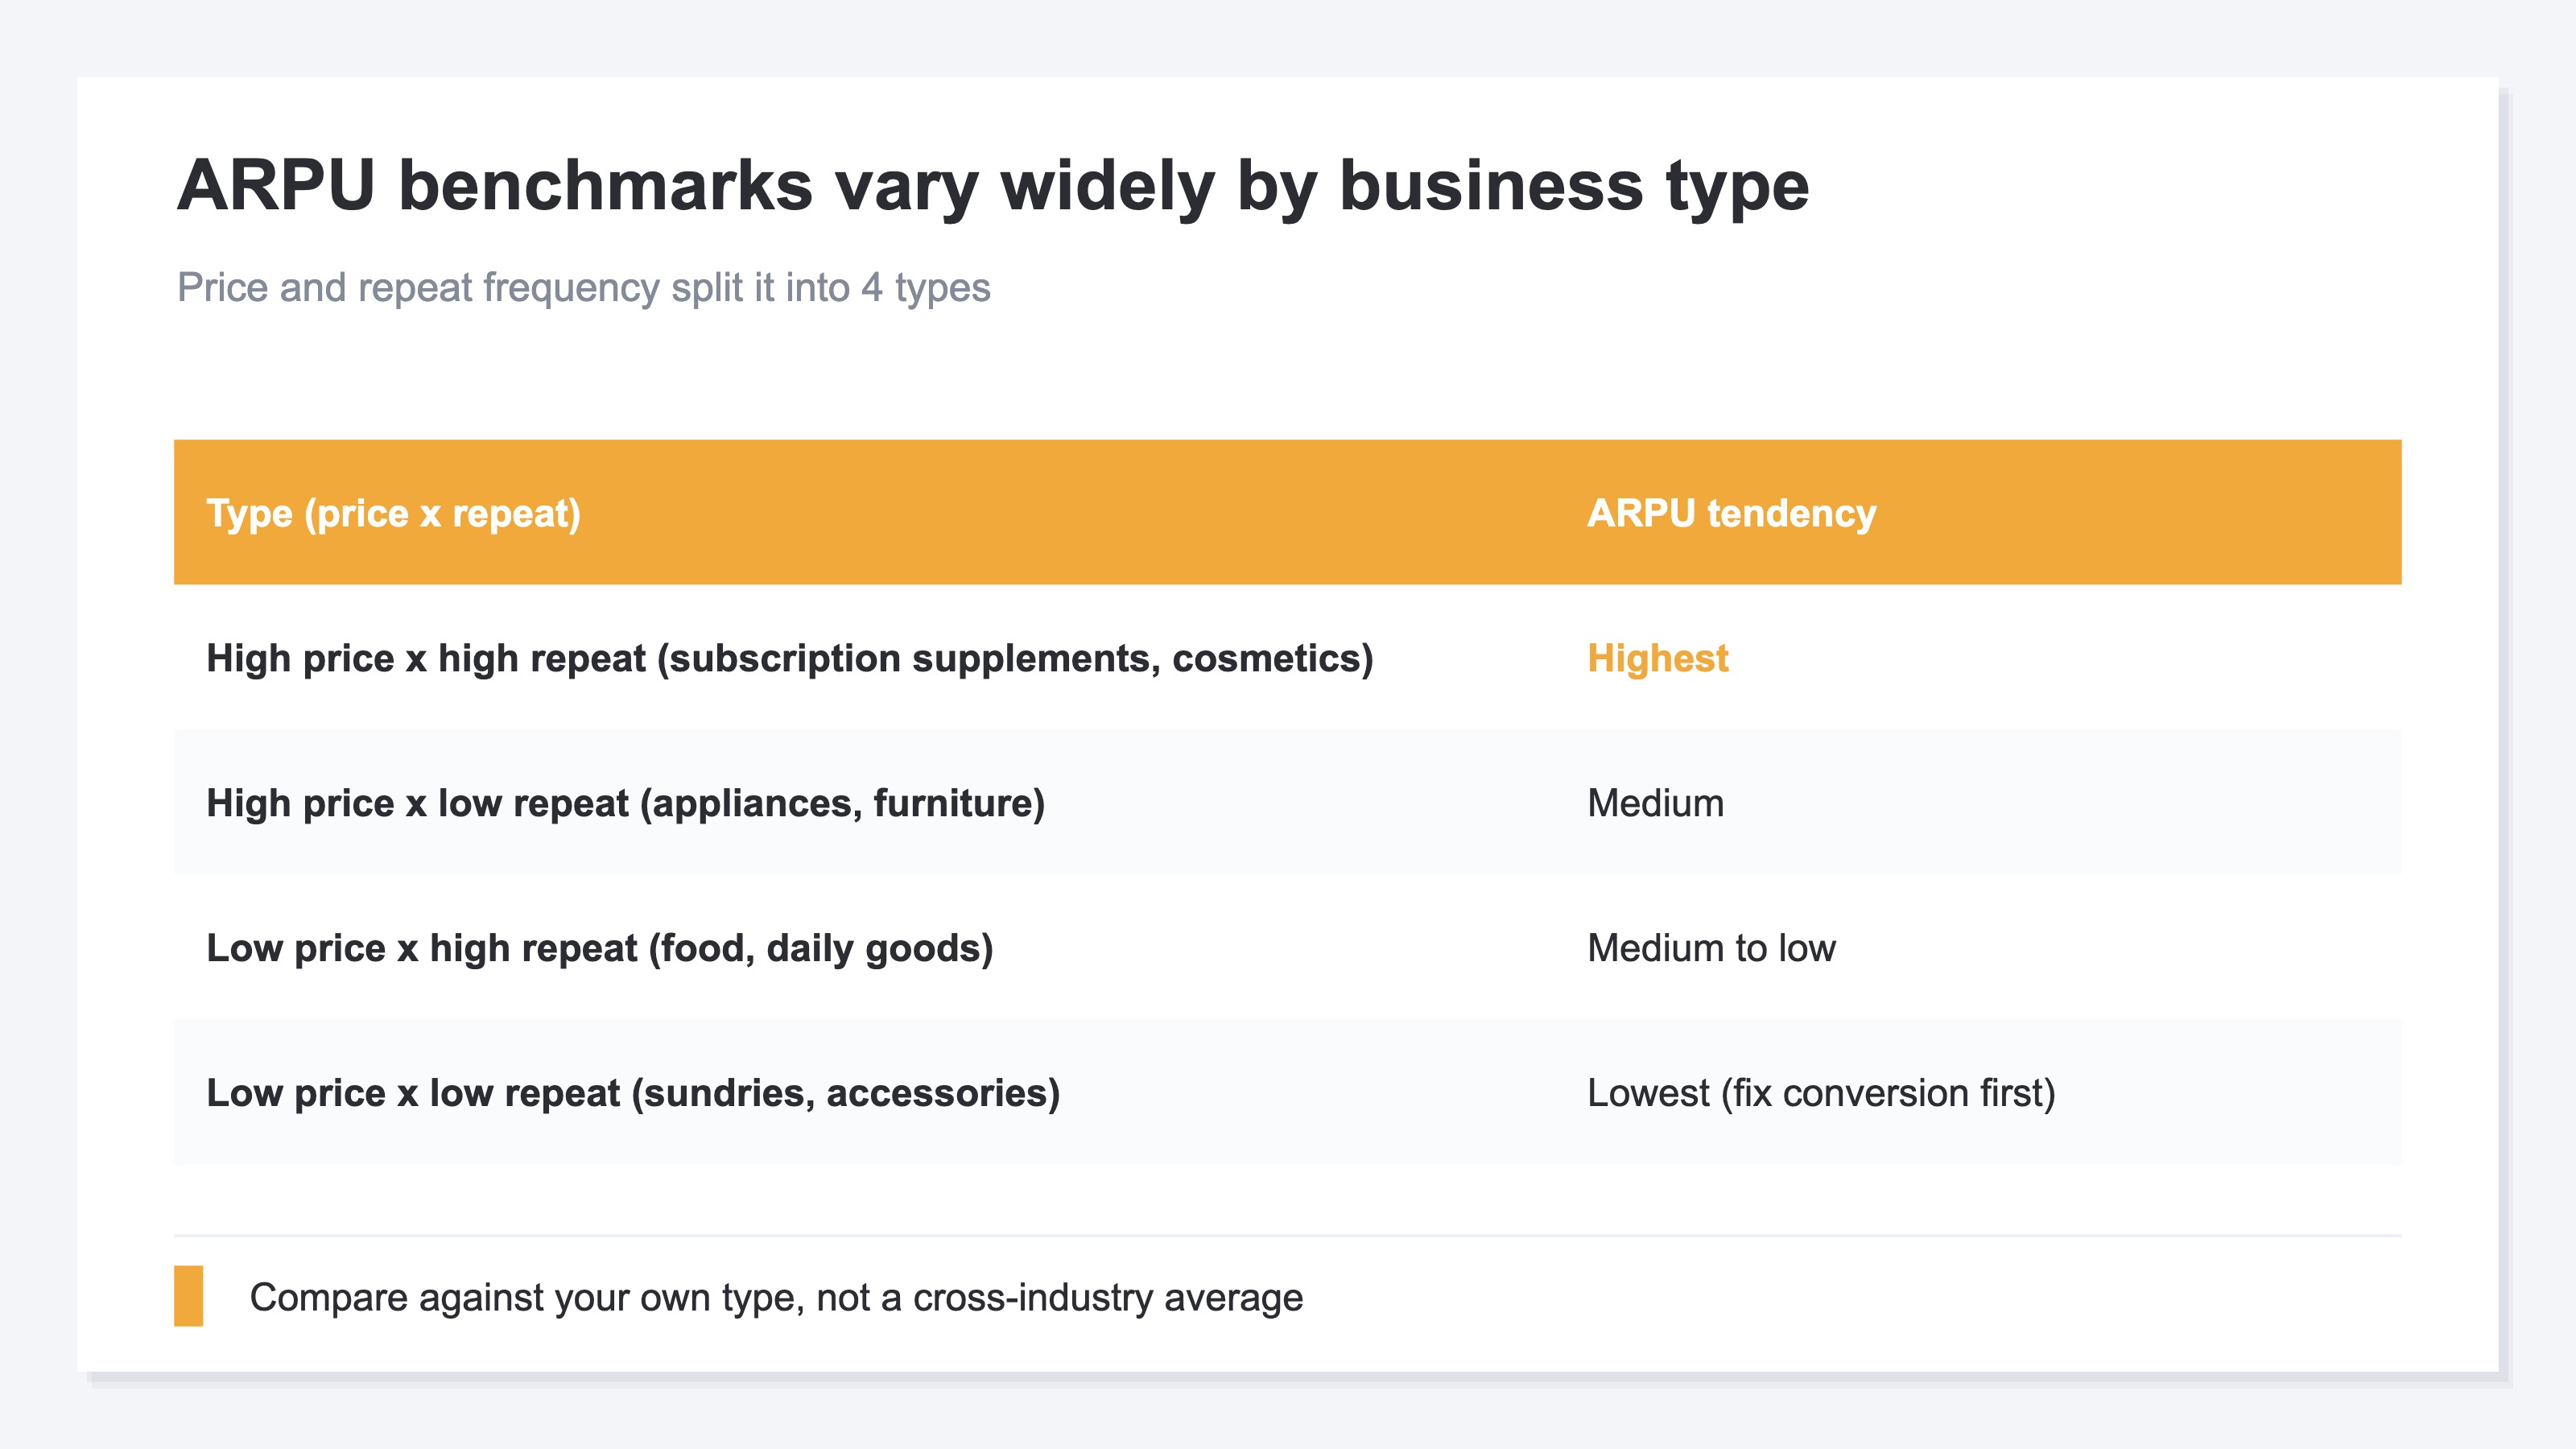
There's no single answer to "what ARPU counts as a pass." A monthly-billed SaaS and a one-off-purchase apparel shop differ by an order of magnitude in ARPU. What drives the benchmark is three things: the product's price, repeat frequency, and billing model. Broadly, it splits into four types. High price x high repeat (subscription supplements and cosmetics) has the highest ARPU, with revenue stacking up through recurring purchases. High price x low repeat (appliances, furniture) is big per purchase but infrequent—medium. Low price x high repeat (food, daily goods) is small per purchase but benefits from repeats—medium to low. Low price x low repeat (sundries, accessories) is the lowest, and improving conversion comes first.
What matters is not applying another company's average ARPU as-is. The right order is to see "which of the four you're in" and compare against the same type's level [1]. And there are only two paths to raising ARPU—"raise CVR" or "raise ARPPU." Which one is the bottleneck becomes visible through the ARPU = CVR x ARPPU breakdown.
4. Leveling by channel and viewing monthly is heavy by hand#
In short, the idea behind producing ARPU is simple. What's heavy is aligning it by channel and by new/returning and repeating it every month.
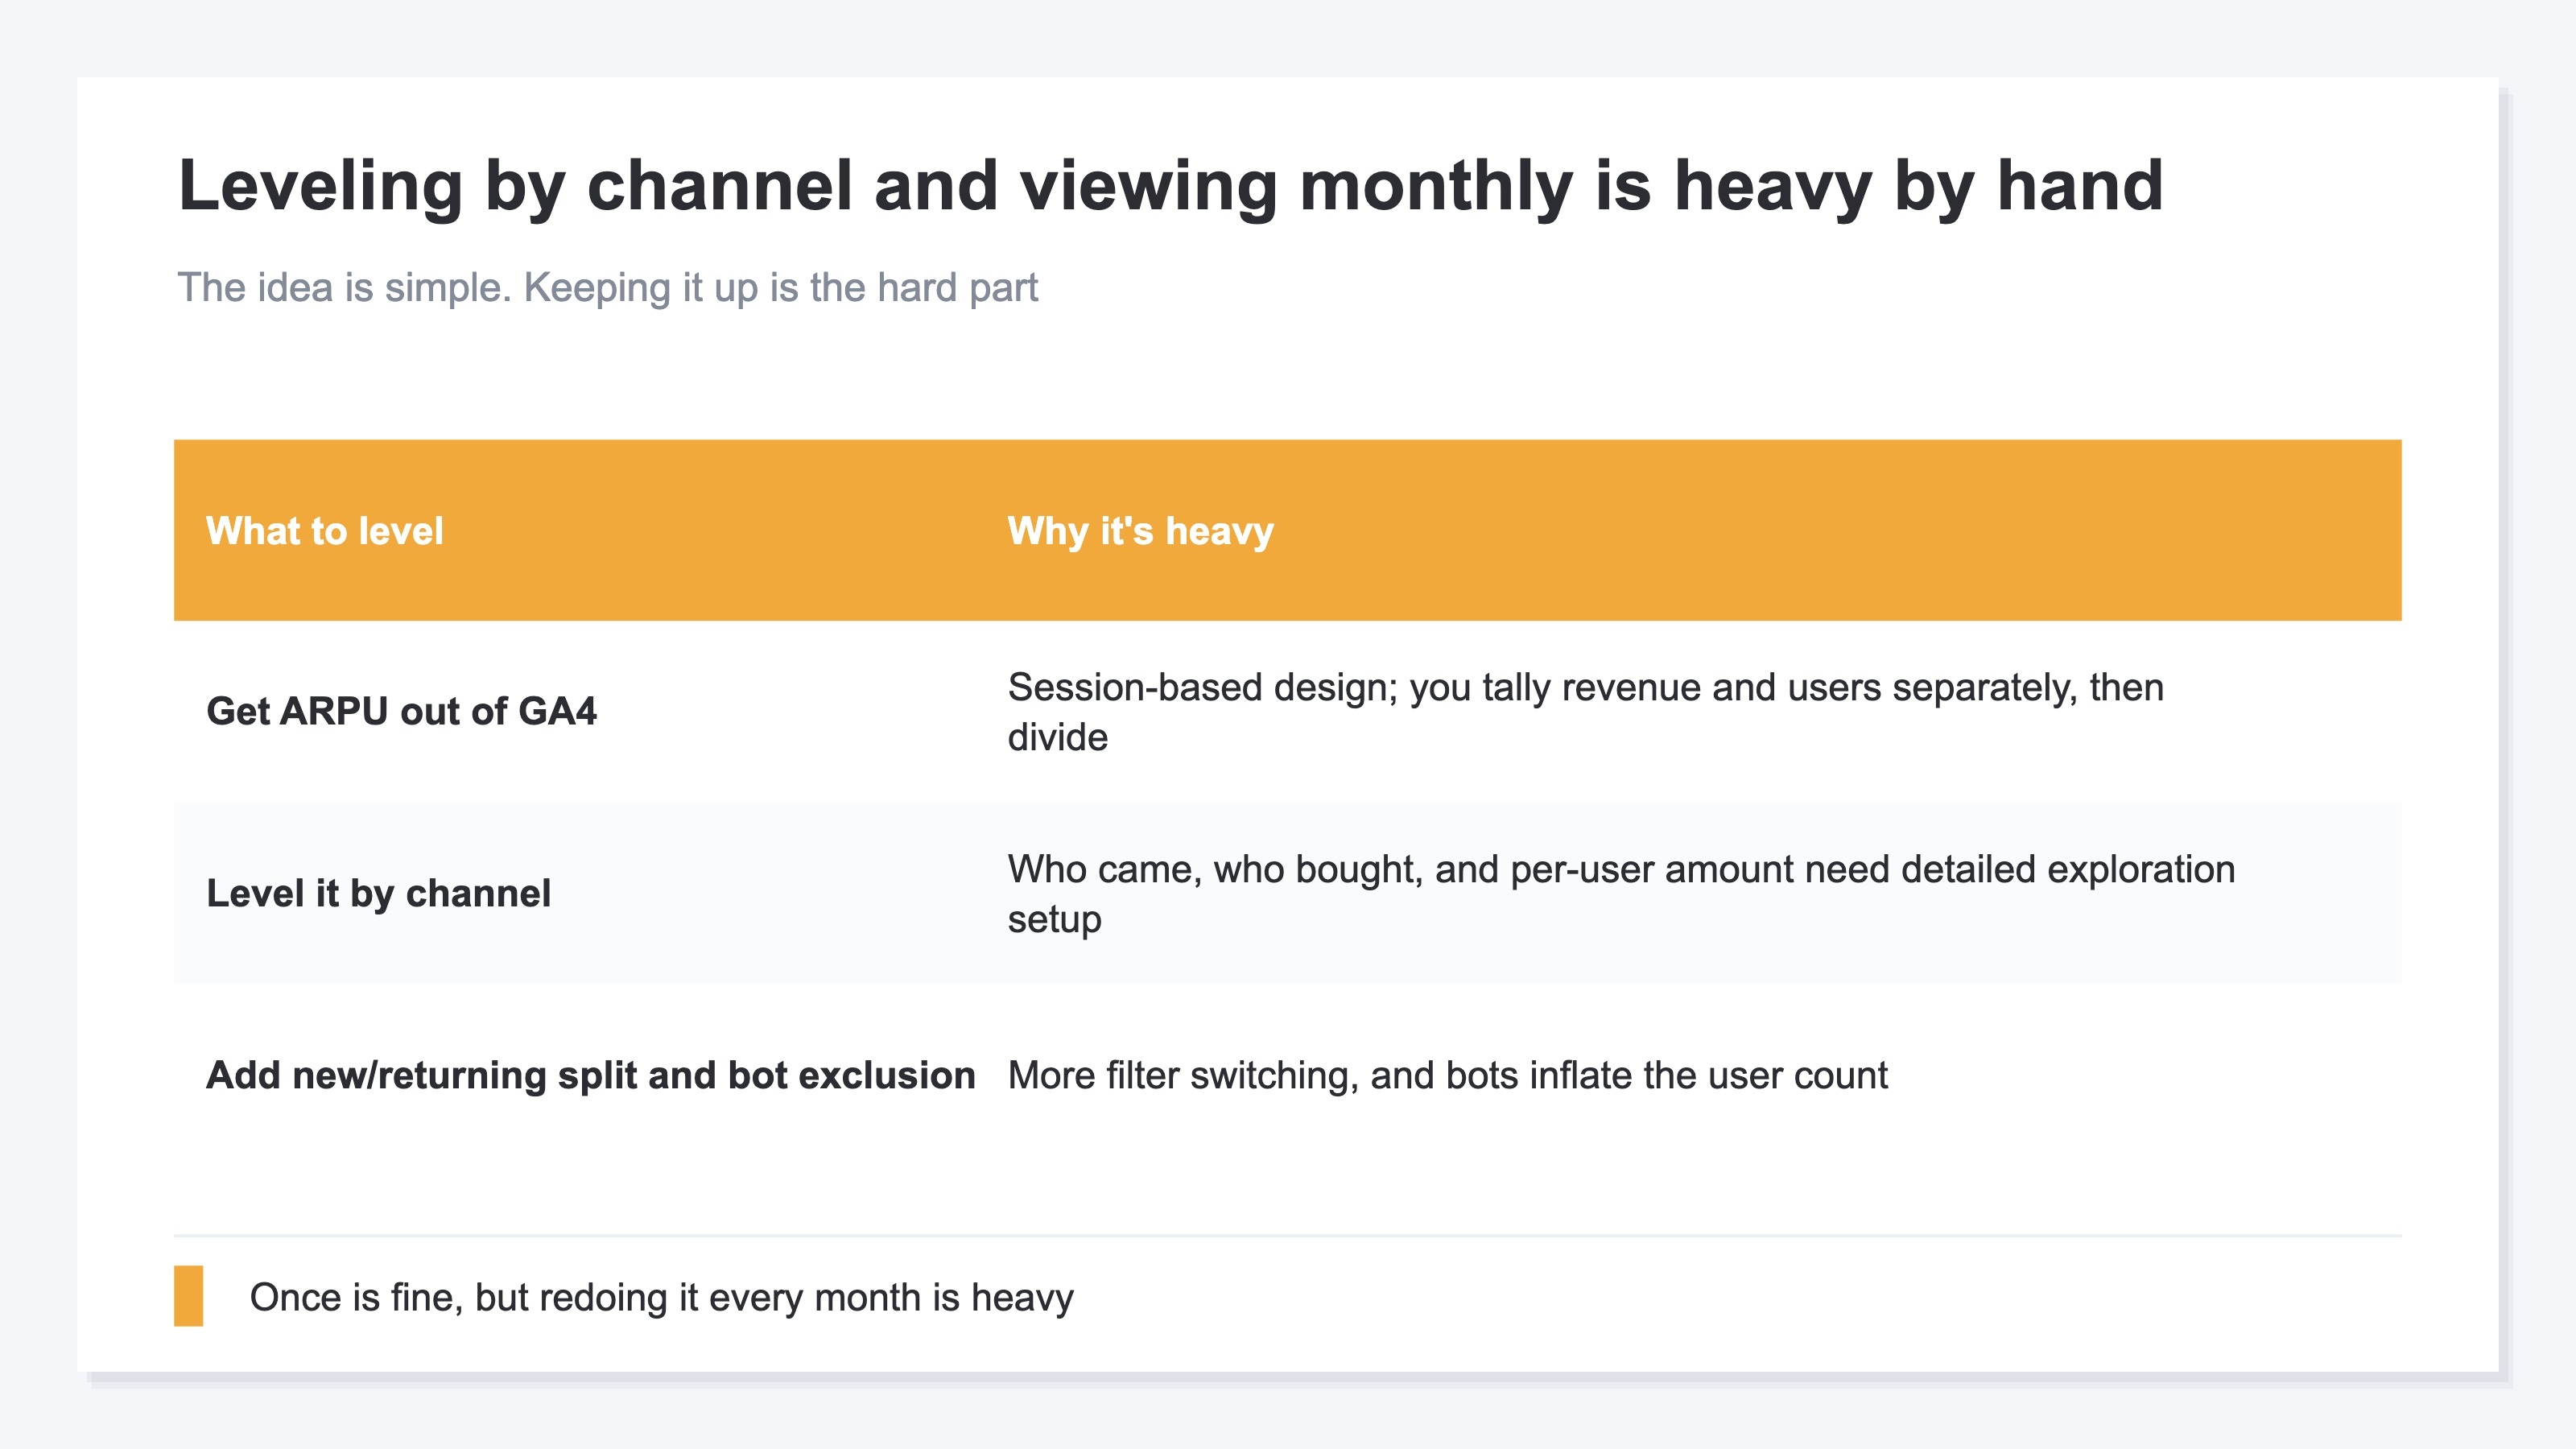
First, it takes effort to get ARPU out of GA4 alone. Because GA4 is designed around sessions (visits), you can get the purchase amount, but to produce "revenue per user with all users as the denominator," you have to tally revenue and user counts separately and divide. Next, the effort of leveling by channel. To line up "how many came, how many bought, and how much per person" for each channel, you have to set up exploration reports in fine detail. On top of that, trying to line up the all-user-denominator ARPU and the buyer-denominator ARPPU at the same time requires switching filters. If you want to split new from returning, that effort grows further. And when automated programs (bots) mix in, the user count alone swells, making ARPU look lower than it really is.
Once is doable. But every time you run a campaign, redoing this prep (tallying revenue and user counts, breaking it down by channel, splitting new from returning, excluding bots) and keeping the comparison going every month is quietly heavy. The idea is simple, but keeping it up is hard—and that's why ARPU rarely takes root as an ongoing measure.
RevenueScope — the solution
When you try to use ARPU for acquisition decisions, you end up hitting the same wall: can you exclude automated programs (bots), and—ideally splitting new from returning—compare "how much revenue each visit generates" by channel, on one screen, month after month? That's where it stalls.
RevenueScope solves this. For each channel (organic search, ads, email, and so on), it shows revenue per session (RPS), order value (AOV), and conversion rate (CVR) together on one screen. RPS is a "per-session metric close to ARPU," letting you compare the revenue per visit across entry points on a revenue basis. The figures are after excluding automated-program (bot) traffic (the figures shown are demo data).
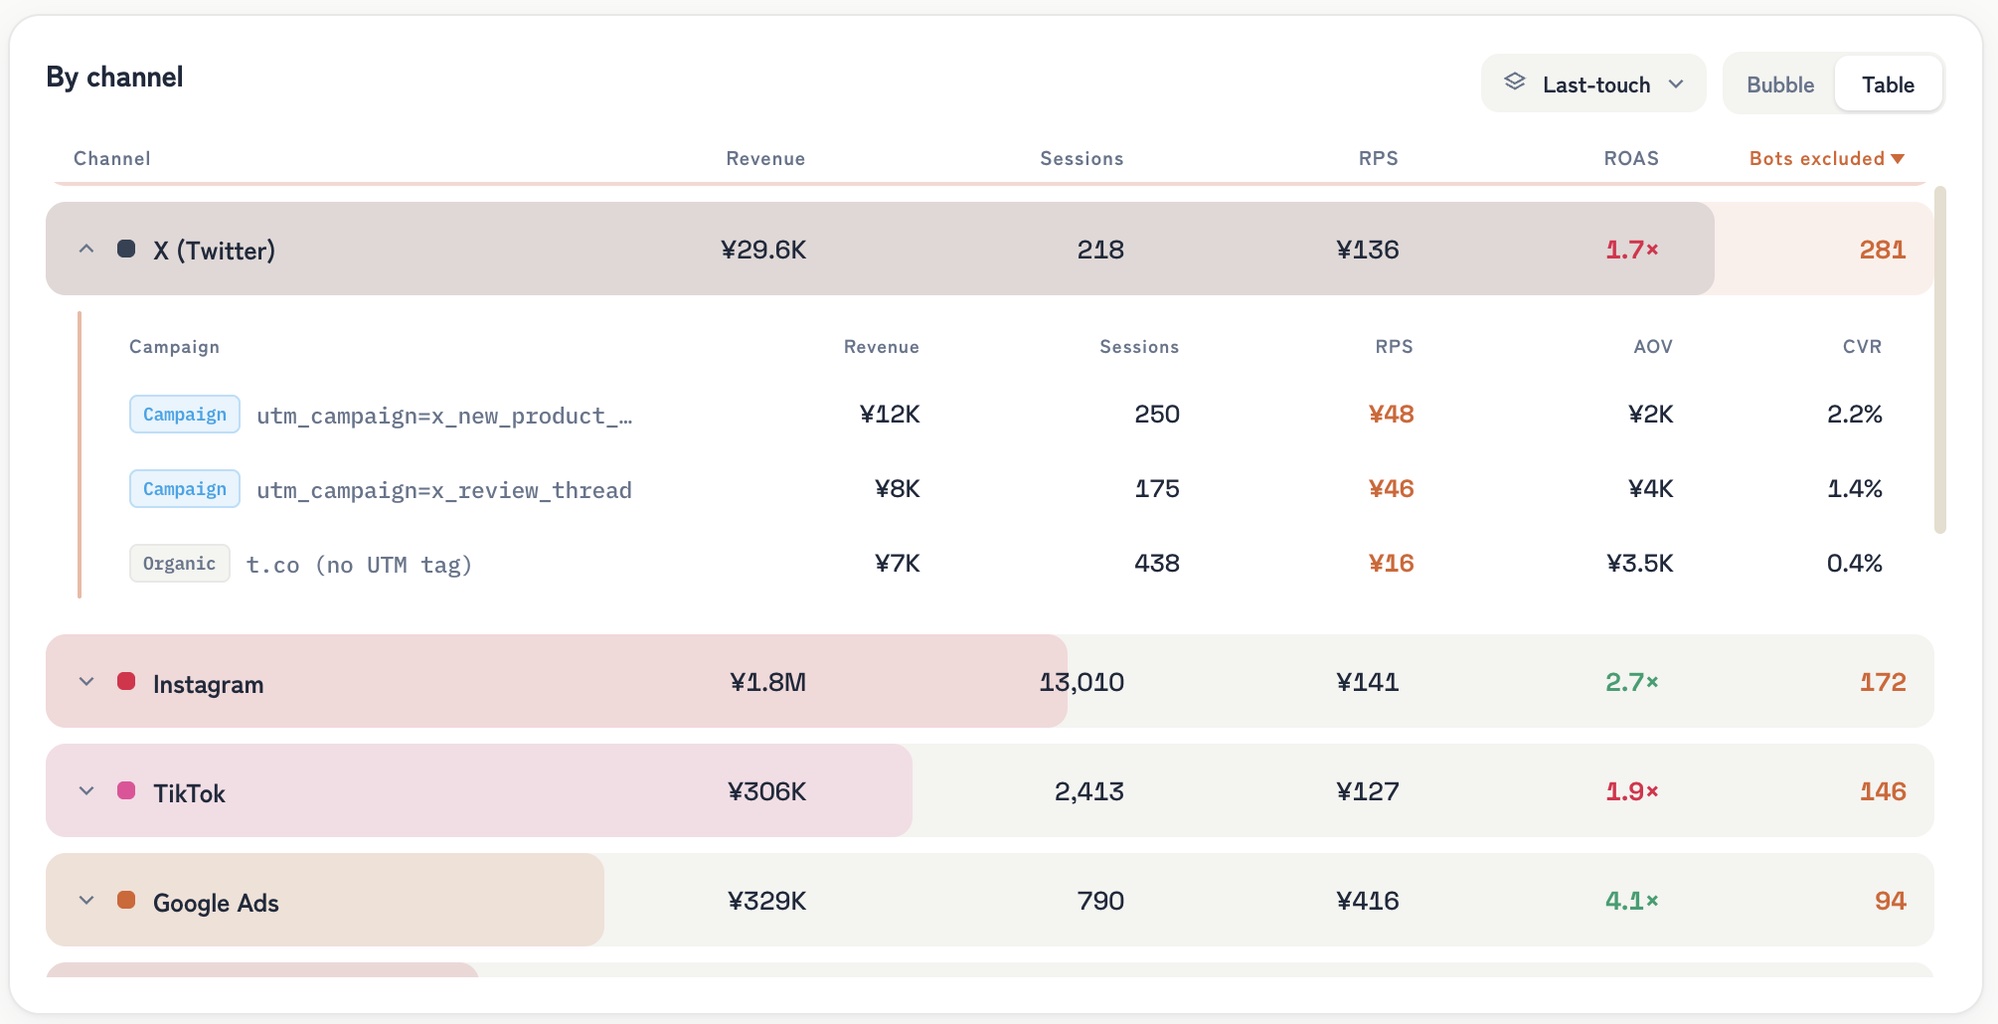
RevenueScope dashboard (demo data shown). Open a channel and RPS, AOV, and CVR are shown by campaign.
A notable feature is that ARPU's breakdown is traceable on one screen. ARPU = CVR × ARPPU (≈ order value), and those two elements — conversion rate (CVR) and order value (AOV) — are shown down to the campaign level when you open a channel. Open X (Twitter), for example, and the untagged organic traffic (t.co) shows a 0.4% conversion rate and ¥16 RPS — thinner revenue per visit than its tagged campaigns (2.2% CVR, ¥48 RPS). Acquisition may rise, but if CVR is low, revenue per person doesn't grow — the truth behind "ads brought in more people, but revenue per person isn't growing" becomes visible as the CVR-and-AOV breakdown. Split further by new and returning, and you can confirm that difference on the same screen. Which channel's CVR to go after, which order value to go after — this gives you the material to decide.
What RevenueScope handles is the ARPU breakdown for acquisition decisions. After excluding bots, it aligns "revenue per visit (RPS)" by channel and by new/returning on the same terms, so you can tell on one screen whether the breakdown is driven by conversion rate (CVR) or order value (AOV). RPS here is per-session efficiency — the practical form of ARPU you use for acquisition investment decisions. Which channel, and which of the two to raise — you decide the next move on a revenue basis.
FAQ#
Frequently asked questions#
Q. How do ARPU and RPS (revenue per session) differ?
A. The unit of the denominator differs. ARPU's denominator is "number of users (people)"; RPS's denominator is "number of sessions (visit count)." If the same person visits three times a month, that's three sessions but one user. It helps to think of RPS as measuring the quality of a visit and ARPU as measuring the quality of a customer. We cover this in detail in What Is RPS (Revenue Per Session): Calculation and Use.
Q. Many free users drag ARPU down—is that a problem?
A. It depends on the cause. Whether low ARPU comes from "lots of free users (a low conversion rate)" or "small purchase amounts (a low ARPPU)" changes what you should do. The first step is to break it down with ARPU = CVR x ARPPU and pin down which is the bottleneck. Even with many free members, if the conversion rate beyond them holds up, it isn't necessarily a problem.
Q. Is there any point in looking at ARPU for EC?
A. Yes. It's especially effective when you want to compare "the revenue from bringing in one person" across acquisition channels. Channel A may gather people cheaply but generate thin revenue per person, while channel B is expensive but generates thick revenue per person—a difference you can only see by lining up ARPU (or per-session RPS) by channel. Even in EC centered on one-off purchases, it helps with acquisition investment decisions.
Summary#
ARPU is "revenue per user" with all users as the denominator. ARPPU is the average with buyers only as the denominator. Only the denominator differs, but what you're looking at changes. Use ARPU for investment decisions on acquisition channels, and ARPPU for improving order value. And the "ARPU = CVR x ARPPU" breakdown reveals whether what you should raise is conversion rate or order value.
But aligning that breakdown by channel and by new/returning and repeating it every month is heavy work by hand. GA4 is designed around sessions, so even just producing the all-user-denominator ARPU takes tallying and dividing, and once you line it up by channel and by new/returning and exclude bots, the effort grows further.
Exclude bots, and align "revenue per visit" by channel and by new/returning on the same terms. If you can take the monthly repetition of that off your plate, you can judge—by numbers, not by gut—whether the acquisition your ads brought in is truly generating revenue per person.
See which ads actually drive revenue, at a glance
Free up to 2,000 sessions/month, AI connection included. No credit card required. Up and running in 5 minutes.