
The F2 conversion rate is the share of first-time buyers who come back for a second purchase. The figure is up on last month, and the revenue line sitting on the same page of the deck is at the level it was. When those two run separately, the part to revisit is the denominator. This article lays out the three denominators in practical use and settles which one tracks revenue.
Contents
TL;DR#
- The numerator of the F2 rate is the same everywhere. What splits in practice is the denominator
- There are three: sessions, visitors, and first-time buyers inside a fixed window
- With the same numerator of 60 buyers, the rate runs from 0.5% to 5.0% depending on which one you divide by
- The third one is a cohort, so changing acquisition spend swaps the people who fall inside the denominator
- Fix one denominator and one window, put actual revenue next to the rate, and a month where the numerator grew separates from a month where the denominator swapped
1. The Rate Doubled in July and Revenue Held at the May Level#
Put the rate and revenue on one screen and the two lines come apart from July.
In the monthly deck, the F2 conversion rate is indexed to May = 100 and reaches 200 in July. Revenue on the same page, indexed to May = 100, reads 101 in July. The rate alone has doubled, and revenue is at the level it held in May.
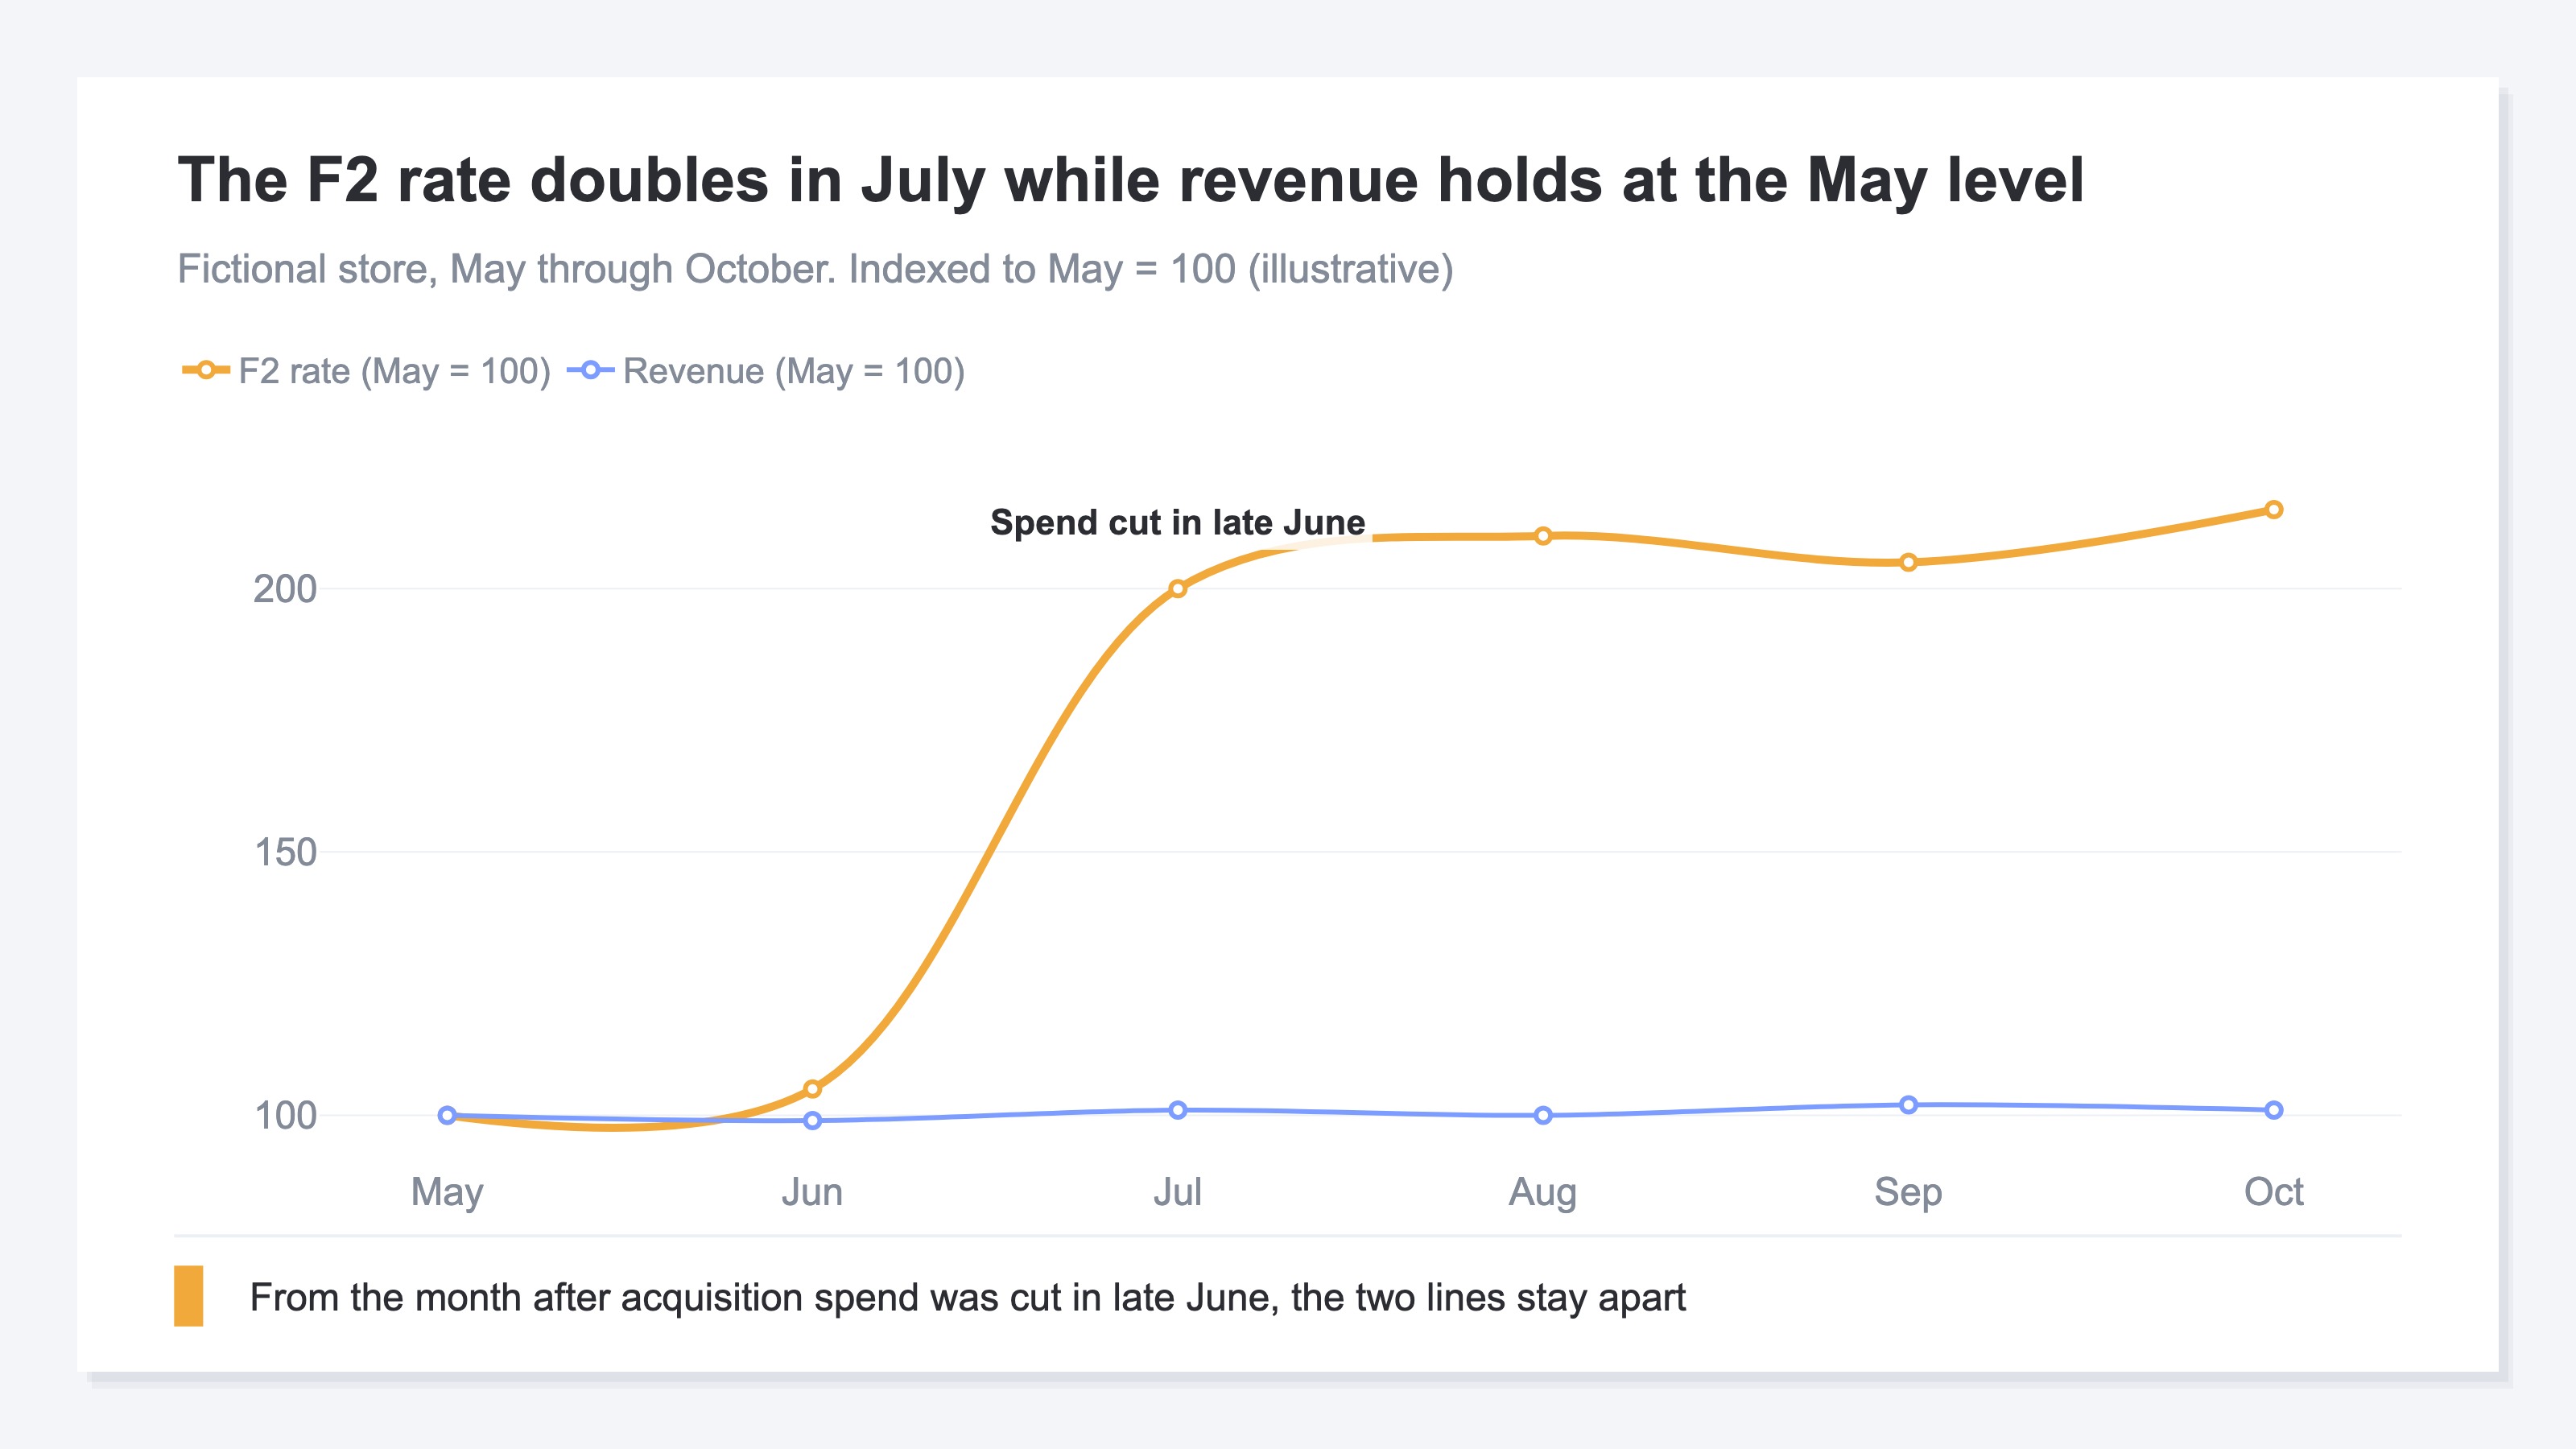
One change went in at the store during the month those lines separated. Acquisition spend was cut at the end of June. The ad budget came down and new visits fell with it. Nothing changed in what existing customers were sent.
The F2 conversion rate before the end of June and the F2 conversion rate after it share a name and point at different groups. The earlier denominator holds first-time buyers acquired through ads; the later one does not. The 200 recorded in July is no longer a figure that lines up against the 100 recorded in May.
What that acquisition spend was buying, priced per customer, is covered in CAC: the formula and the benchmarks.
2. Three Denominators Are in Use, and the Rate Runs Ten Times Apart#
The numerator of the F2 rate is "people who made a second purchase" everywhere. What splits in practice is the denominator.
Take May at the fictional store. Hold the numerator at 60 people who made a second purchase in May, and apply three denominators to it.
The first is sessions. A session is the set of actions from arriving on the site to leaving, counted as one unit [1]. May carried 11,000 sessions in total, and 60 divided by 11,000 gives 0.5%. The question it answers is how likely a second purchase is per visit.
The second is visitors. Visitors count one person as one however many times they come back [2]. May had 7,300 visitors, and 60 divided by 7,300 gives 0.8%. The question it answers is per person who reached the site.
The third is first-time buyers inside a fixed window. Take the 1,200 people who bought for the first time in April, divide 60 by 1,200, and the rate is 5.0%. The question it answers is what share of people who bought once came back.
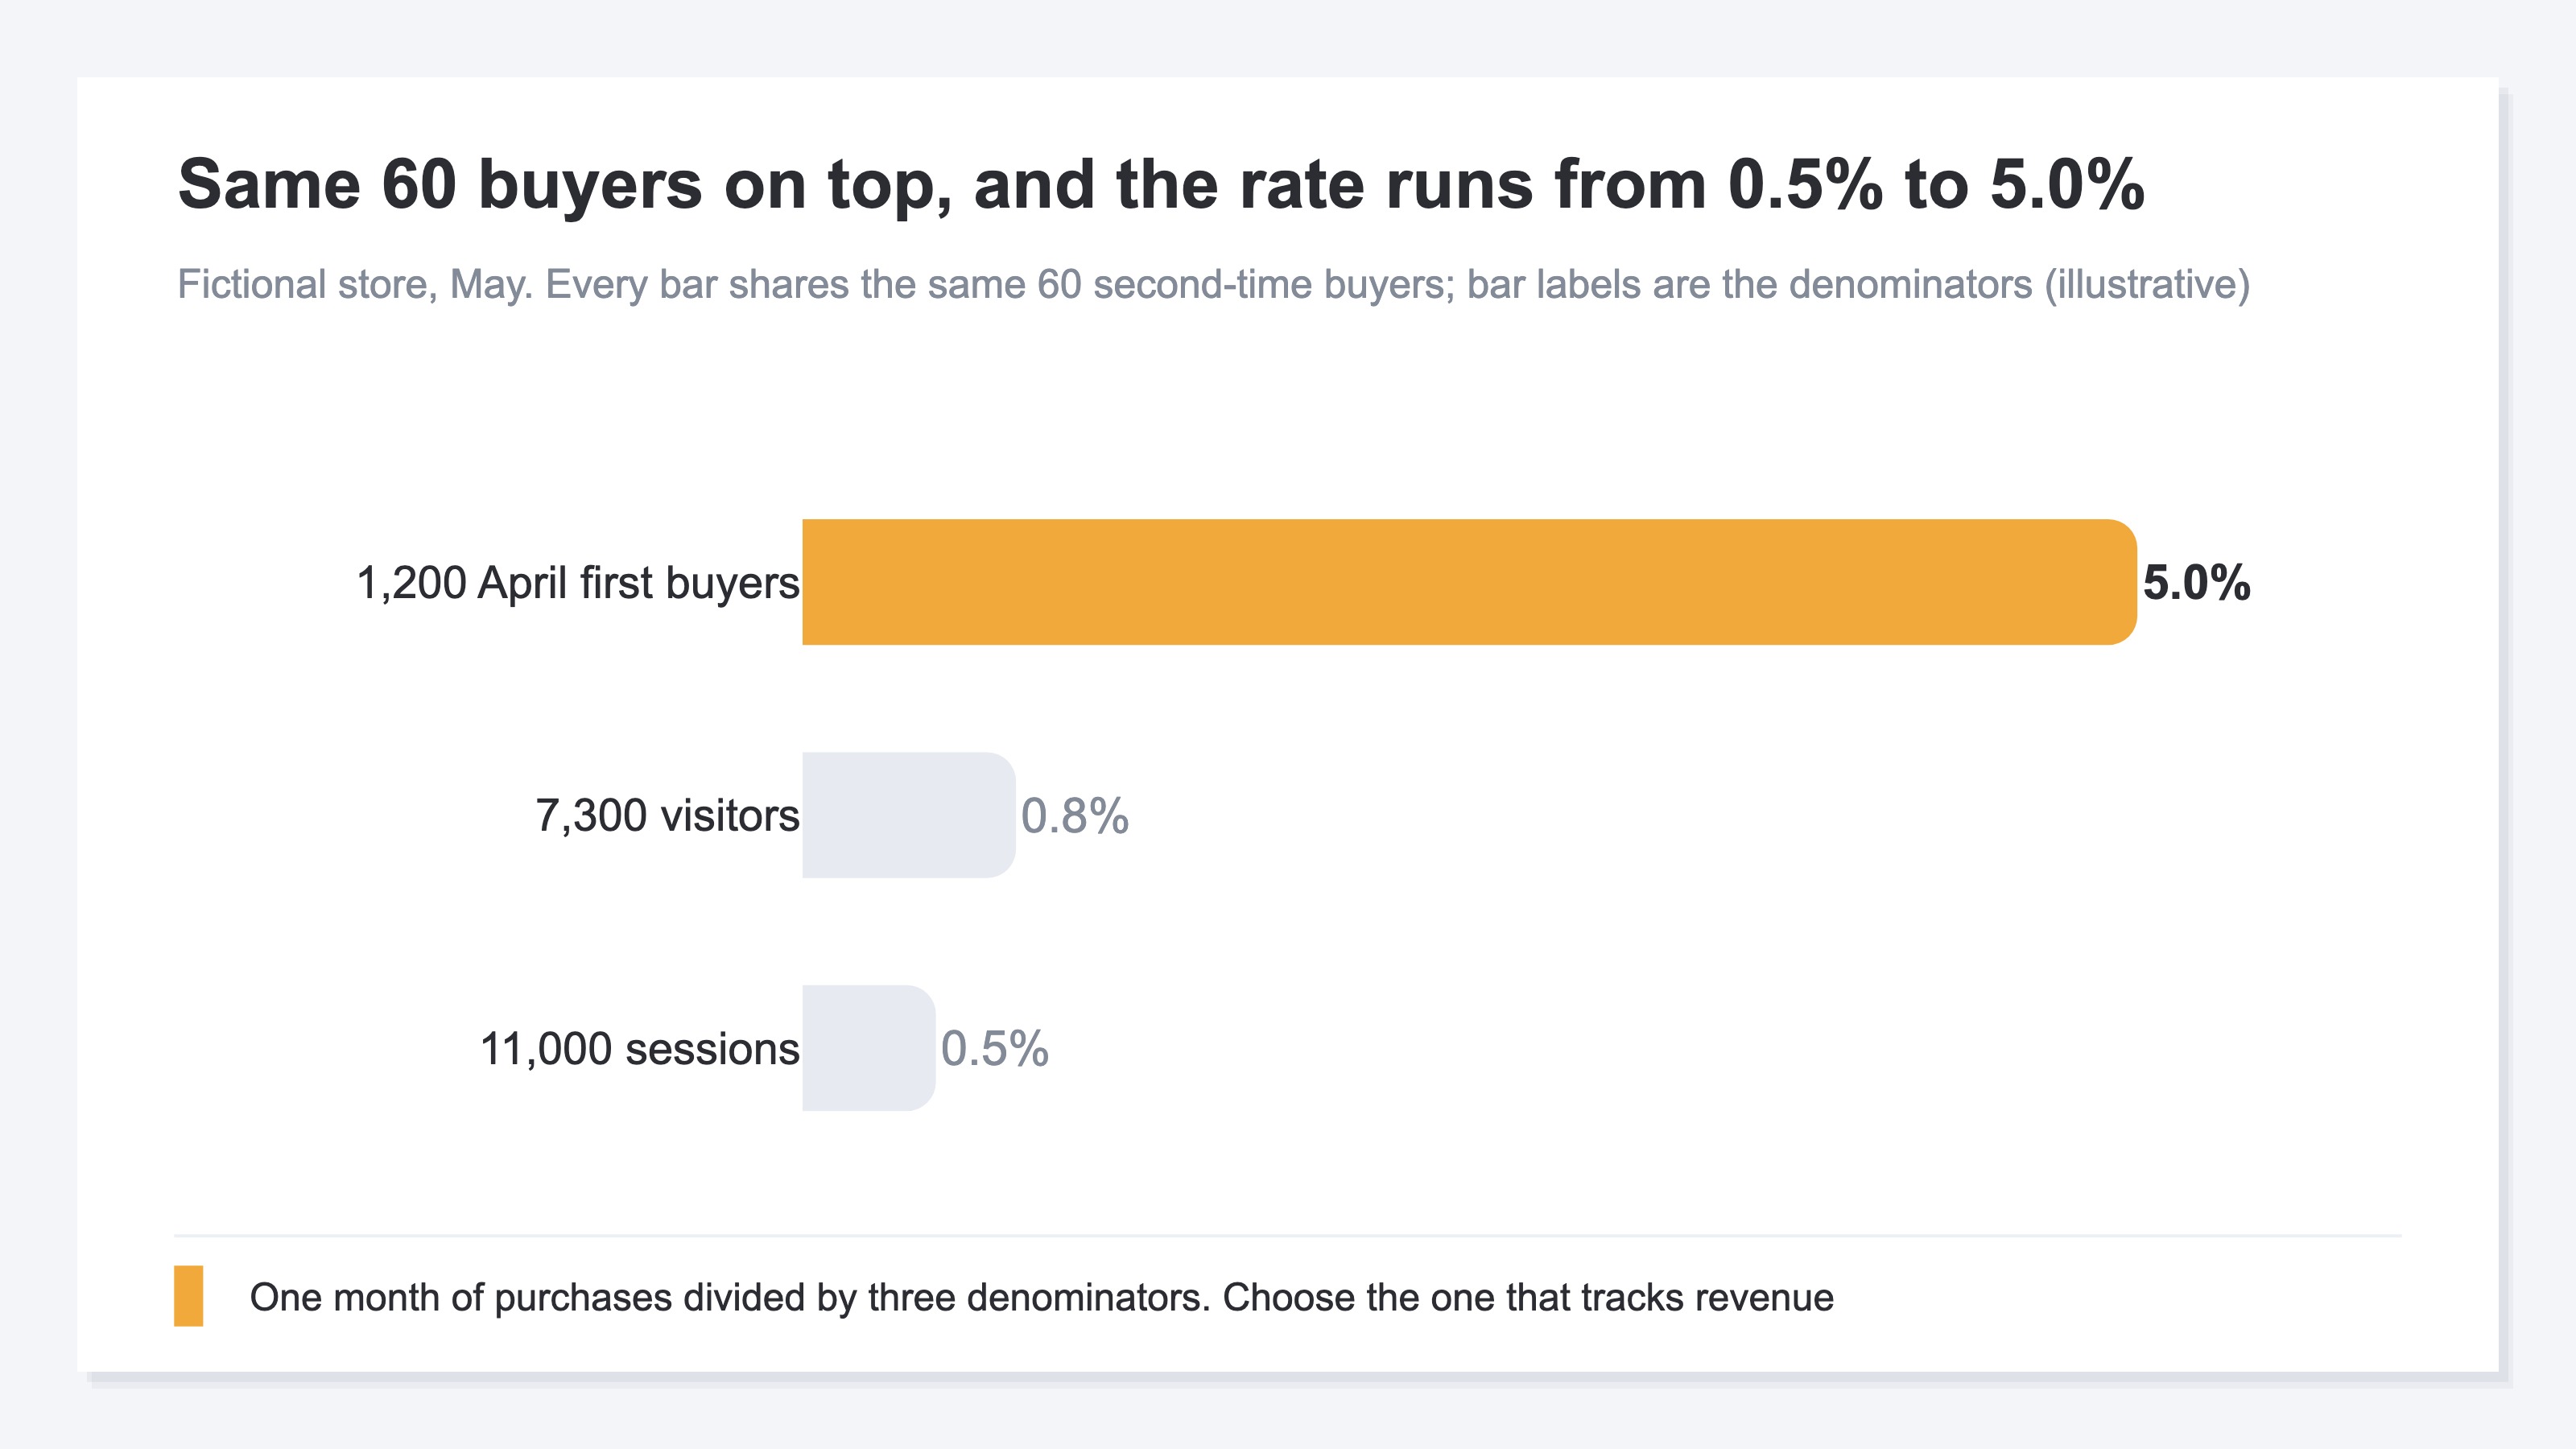
The three answer different questions, so a tenfold spread between them is consistent. What has to be settled is not which one is correct but which one tracks revenue. In the first two the denominator is acquisition volume itself, so the rate falls when you spend more and rises when you cut. It moves in a direction of its own, separate from revenue. Only the third follows how first-time buyers come back.
Choosing the third comes with a condition: it has to be cut by a window. Take "everyone who has ever bought for the first time" as the denominator and it only grows, which leaves month-to-month comparison without a basis. First-time buyers from the previous month, or first-time buyers in the last 90 days. Define it in a shape where people enter and people leave.
Once the denominator is settled on the third, the benchmarks worth reading it against are in What a typical ecommerce repeat rate looks like.
3. When the Denominator Swaps Its Members, the Rate and Revenue Come Apart#
The third denominator is a cohort cut by a window, so the month after acquisition volume changes, the number of people inside it changes with it.
Back to the store that cut spend at the end of June. Compute the July F2 rate on the third denominator and the denominator is "people who bought for the first time in June." June acquisition was cut, so that count is lower than April.
The numerator works differently. "People who made a second purchase in July" are not drawn only from those who bought first in June. Someone who bought in March, and someone who bought in April, also make a second purchase in July. The numerator is carried by many months of first-time buyers while the denominator holds one month. A cut in acquisition reaches the denominator within a month and spreads thinly across the numerator over many. That lag is why July shows a shrinking denominator and a rising rate.
Reverse the direction and the same thing happens. The month after acquisition is increased, the denominator alone swells and the rate falls. Nothing has changed in how existing customers come back, and the deck shows a decline. Across a month where acquisition volume changed, almost all of the movement in the rate is explained by the acquisition side. Reading how existing customers behave takes a different view.
The people inside the denominator are not uniform either, which compounds it. The share who come back differs sharply by the channel they arrived through. Change the mix of acquisition and the same headcount holds a different set of people.
What is happening here is not a measurement fault but a change in composition. The figures are counted correctly in every month. What swapped is what sits inside the denominator. Splitting revenue between new and returning once the denominator is fixed is covered in Splitting revenue between new and returning visitors.
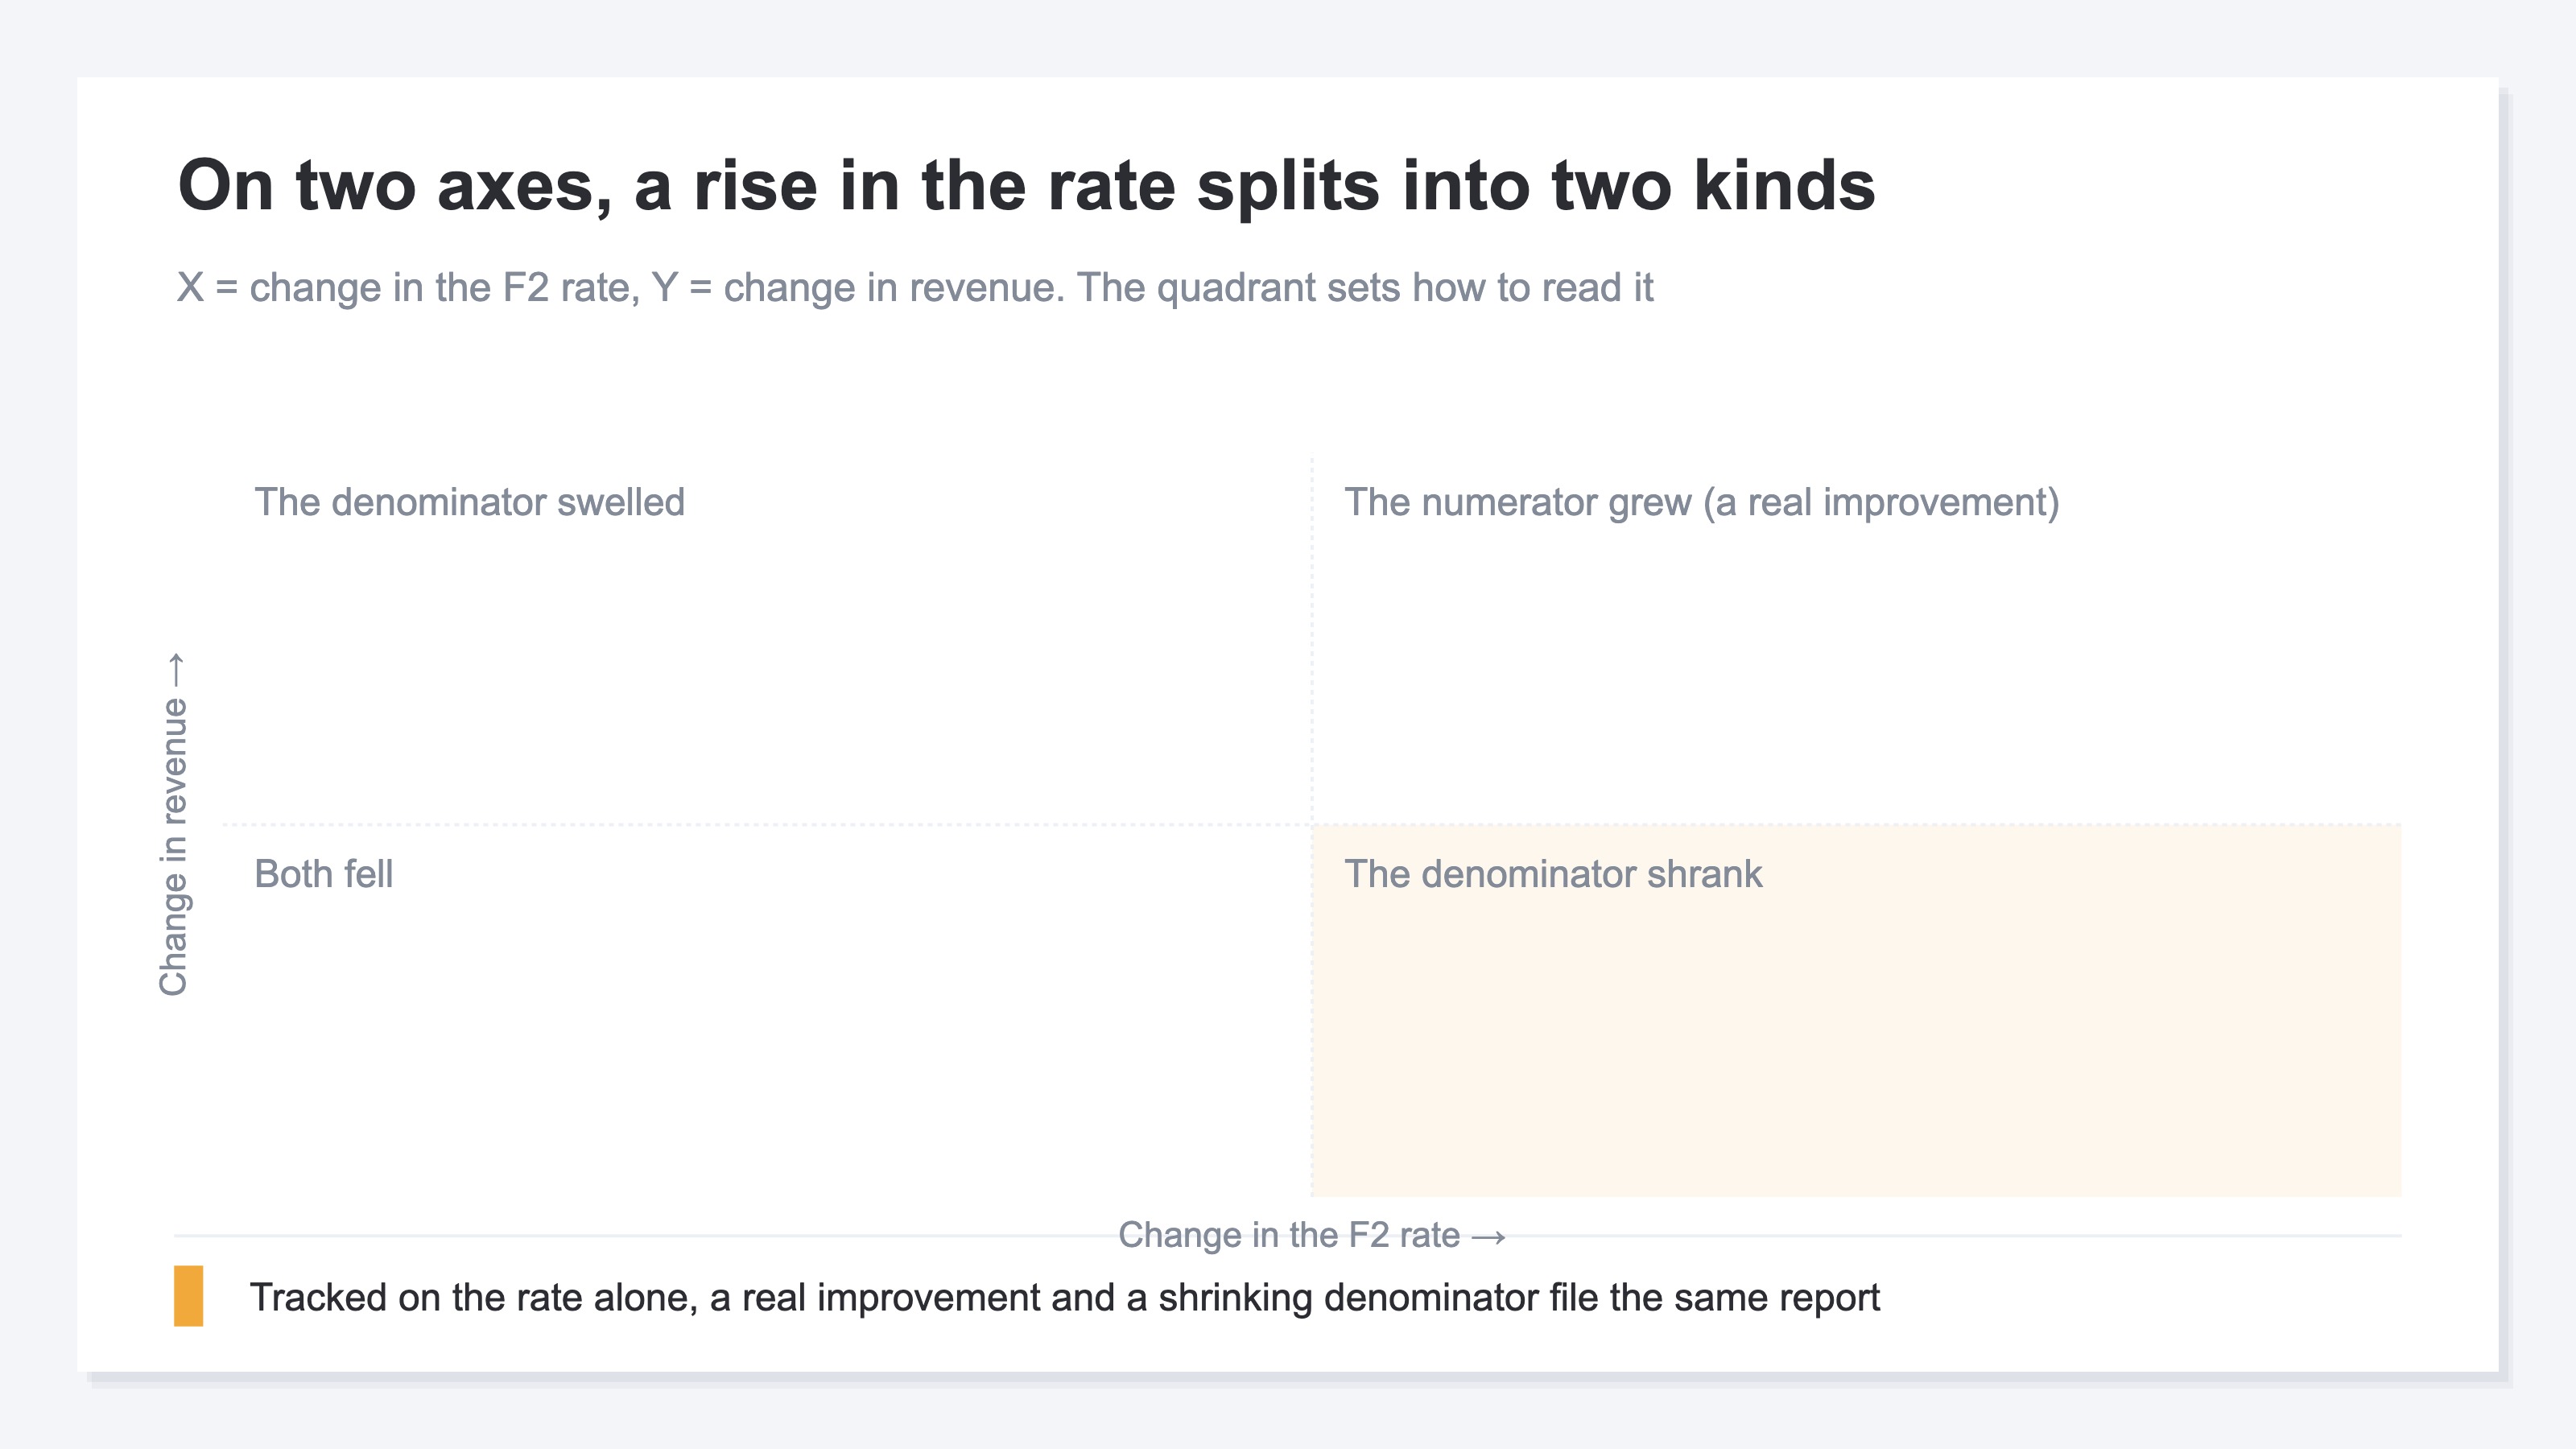
Put the rate and revenue on two axes and the quadrant this month lands in sets how to read it. Tracked on the rate as a single axis, the lower right and the upper right are both filed as a month that went up.
4. Fix One Denominator, Then Put Actual Revenue Beside It#
There are two moves. Settle on one denominator and leave it alone after that, and put actual revenue next to the rate.
Any of the three will do. The point is that the one you settle on does not change from report to report. Choose the third and the window length gets fixed at the same time. First-time buyers from the previous month, or first-time buyers in the last 90 days. Change the window and the denominator becomes a different metric.
Then put actual revenue next to the rate. Set revenue on the new side and revenue on the returning side into the same table as the rate. A month where the rate rose and the money rose with it is a month the numerator grew; a month where the rate rose and the money stayed level is a month the denominator shrank. Nothing on the rate side of the table tells those two apart.
Deciding is as far as it goes. Most of the work sits in the reconciliation that follows. The third denominator lives only on the order data, because when someone first bought is not present anywhere in web analytics. Export first-time buyers from the order data month by month, then reconcile them against visits and revenue on the analytics side. That work comes back every month. Change the definition or the window length and the past months get rebuilt as well.
Lifting the share who come back, once the denominator is settled, is covered in Raising the repeat rate in ecommerce. To go one step finer and classify customers, see RFM analysis for ecommerce.
For the person who opens the rate chart alone each month, the 200 in July is displayed as an improvement. Can that screen show them the 200 came from a shrinking denominator? Telling the difference takes the revenue line laid over the same screen. The divergence only appears once the two are together.
RevenueScope solution
When the raw figures that sit underneath the rate are already on one screen, the work of rebuilding a denominator never starts.
RevenueScope splits visitors into new and returning and shows sessions, revenue, RPS, AOV and conversion rate for each. Returning here is a session-level classification, decided by whether the same visitor already had a session on an earlier day. It is a different cut from a second purchase counted by order number, and it puts the raw denominator and numerator that sit underneath the rate in plain view.
Set the period to May and display once, set it to July and display again, and the two months come out in the same shape of table.
New and returning at the fictional store (illustrative)
| Period | Segment | Sessions | Revenue | RPS | AOV | CVR |
|---|---|---|---|---|---|---|
| May | New | 9,000 | 990,000 yen | 110 yen | 11,000 yen | 1.0% |
| May | Returning | 2,000 | 600,000 yen | 300 yen | 10,000 yen | 3.0% |
| July | New | 5,000 | 550,000 yen | 110 yen | 11,000 yen | 1.0% |
| July | Returning | 3,500 | 1,050,000 yen | 300 yen | 10,000 yen | 3.0% |
Note: the new-versus-returning table is a worked example of how to read this screen. The sample store behind the CTA refreshes its data daily, so the figures shown there differ from these.
The only thing that changes rank is revenue. In May the 990,000 yen on the new side sits above the 600,000 yen on the returning side, and in July the 1,050,000 yen on the returning side sits above the 550,000 yen on the new side. RPS, meanwhile, holds at 110 yen for new and 300 yen for returning in both months. The rank changed because volume changed, and performance per visit is unchanged. Decide the allocation in May from the revenue rank alone and you drop the side that was consistently ahead per unit.
Whether next month leans to the new side or the returning side is settled once this table is open. The argument about how to define the denominator does not survive into it.
FAQ#
Frequently Asked Questions#
Q. Which denominator is the correct one for the F2 rate?
A. The point is to pick one of the three and hold it; correctness is not settled among them. To have the rate track revenue, divide by first-time buyers inside a fixed window. Divide by sessions or visitors and the rate turns in the opposite direction every time acquisition volume changes.
Q. Should the window be 90 days?
A. Set the window from the purchase cycle of what you sell. The gap to a second purchase is very different for consumables and for durables, so deciding a length that fits your own cycle and holding it works better than matching someone else at 90 days.
Q. What happens to past months after the definition of the denominator changes?
A. Recompute the past months on the new denominator before laying them out. Line up months across a change of definition and the effect of a campaign mixes into the same movement as the change of definition. Keeping the month of the switch as a note in the deck lets the next reader judge for themselves.
Q. Can the new versus returning split in web analytics be used directly as the F2 rate?
A. Treat it as a separate classification. The analytics split is session-level, decided by whether the same visitor came to the site on an earlier day. F2 counted by order number covers a different group, so putting an equals sign between them in one table leaves two figures pointing at different things. Read acquisition efficiency on the session basis and the return to purchase on the order basis.
Summary#
Before the F2 conversion rate goes into a report, settle which denominator it is built on. The denominator splits three ways — sessions, visitors, and first-time buyers inside a fixed window — and with the same numerator of 60 buyers the rate runs from 0.5% to 5.0%.
Divide by first-time buyers inside a window and a month where acquisition volume changed swaps the people inside the denominator. The numerator is carried by many months of first-time buyers while the denominator holds one month, so the month after a cut shows a shrinking denominator and a rising rate.
Fix one denominator and one window, and put actual revenue next to the rate. A month where the rate and the money turned together is a month the numerator grew; a month where only the rate turned is a month the denominator swapped. With those two apart, next month's allocation is decided from one table.
See which ads actually drive revenue, at a glance
Free up to 2,000 sessions/month, AI connection included. No credit card required. Up and running in 5 minutes.