Carts fill up almost every day. And yet most of them are left behind, never bought. If you run an ecommerce store, "cart abandonment" is something you've worried about at least once. Across the world, there's data showing that about 70% of items added to carts end up unpurchased (Baymard Institute).
Looking at that "70%," most people panic: "I've been losing that much—I need to fix it now." But the first thing this article wants to offer is a shift in how you relate to the cart-abandonment number. Chasing the single number that is cart abandonment rate won't show you where, and how much, revenue is slipping. What matters isn't the rate but seeing which channel a person came from, and where the ones who had the intent to buy are abandoning their carts. We'll start with the formula and the truth behind the ~70%, then move through why it happens and how to read it by channel through revenue.
Table of contents
What this article covers#
- Cart abandonment rate = the share of people who added items to a cart but didn't complete the purchase. The global average is about 70% (Baymard). But that figure mixes in browsing, price comparison, and automated programs (bots)—not all of it is "lost revenue"
- More than the rate being high, what matters is whether people drop off at the "cart stage" (just wanting to check shipping) or the "checkout stage" (leaving mid-entry). The recoverable one—where intent is already set—is the latter
- The single number that is cart abandonment rate won't show you where revenue is slipping. The practical move is to see revenue, CVR, and RPS by channel, then act first on the channels losing the most
1. What is cart abandonment rate | the formula and the truth behind the average#
Cart abandonment rate is "the share who added to cart but didn't buy," and the global average is about 70%. But that 70% is not lost revenue as-is. Let's start with the formula.
Cart abandonment rate (%) = (1 − completed purchases ÷ carts created) × 100
For example, if 100 carts are created and 30 of them lead to a completed purchase, then (1 − 30 ÷ 100) × 100 = 70% is your cart abandonment rate.
The part that trips people up is what to use as the denominator (the number you divide by). The basic choice is "the number of carts created." A similar-but-different metric uses "the number that proceeded to checkout" as the denominator—a "checkout abandonment rate"—and the number changes even on the same site. First decide for your own store that you'll use "carts created" as the denominator, and measure on the same basis every month. If the basis drifts, comparing month over month becomes meaningless.
The figure most often cited as the industry average is about 70% from Baymard Institute, a research firm on user behavior[1]. Roughly, the feeling is "even when something is added to a cart, five out of seven aren't bought."
But it's too quick to take that ~70% straight as "lost revenue." Adding an item to a cart often includes stages where the decision isn't made yet: "just want to check shipping," "comparing prices with another store," "waiting for payday." On top of that, in recent years automated programs (bots) testing stolen card details flood carts and checkouts in large numbers, making the cart abandonment rate look higher than reality. In other words, 70% is a combined value of genuine drop-off, browsing, and bots. If anything, a fair amount of cart abandonment is the flip side of something healthy—that people are reaching the cart at all.
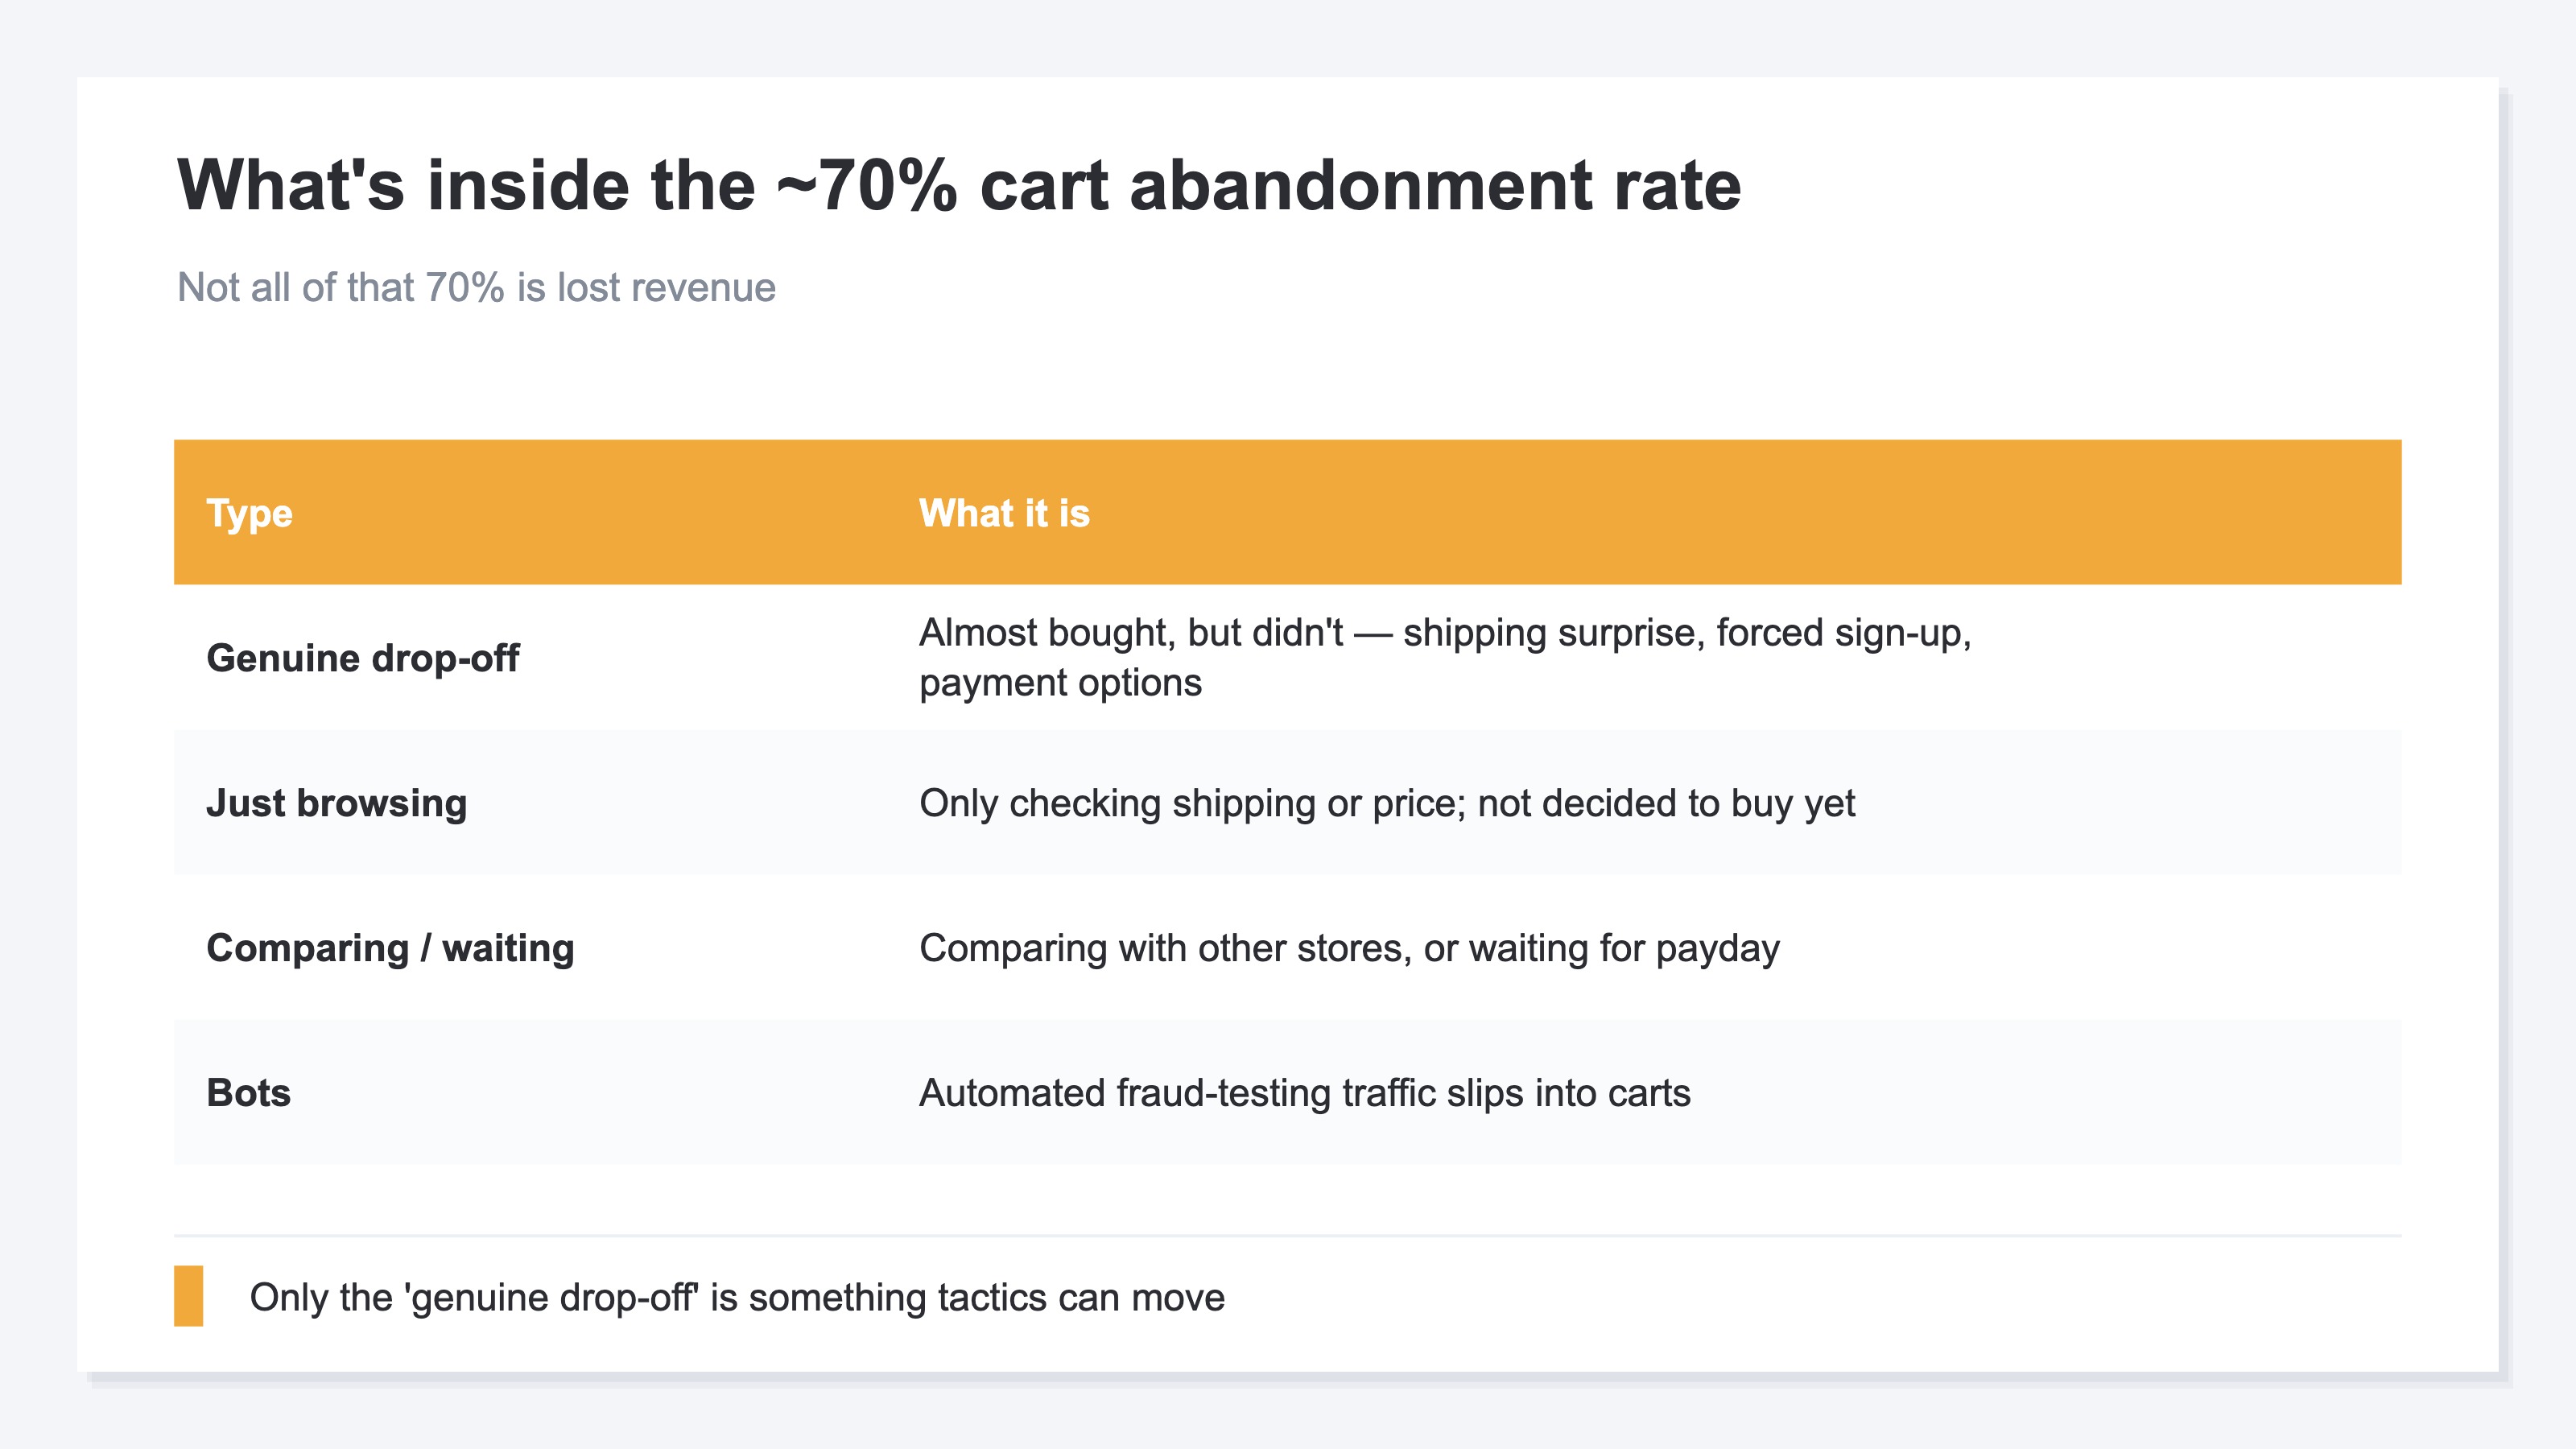
That's exactly why staring at the absolute value of the rate won't get you to a revenue decision. Next, let's split where that 70% drops off into two stages.
2. Why it happens | cart stage and checkout stage differ in recoverability#
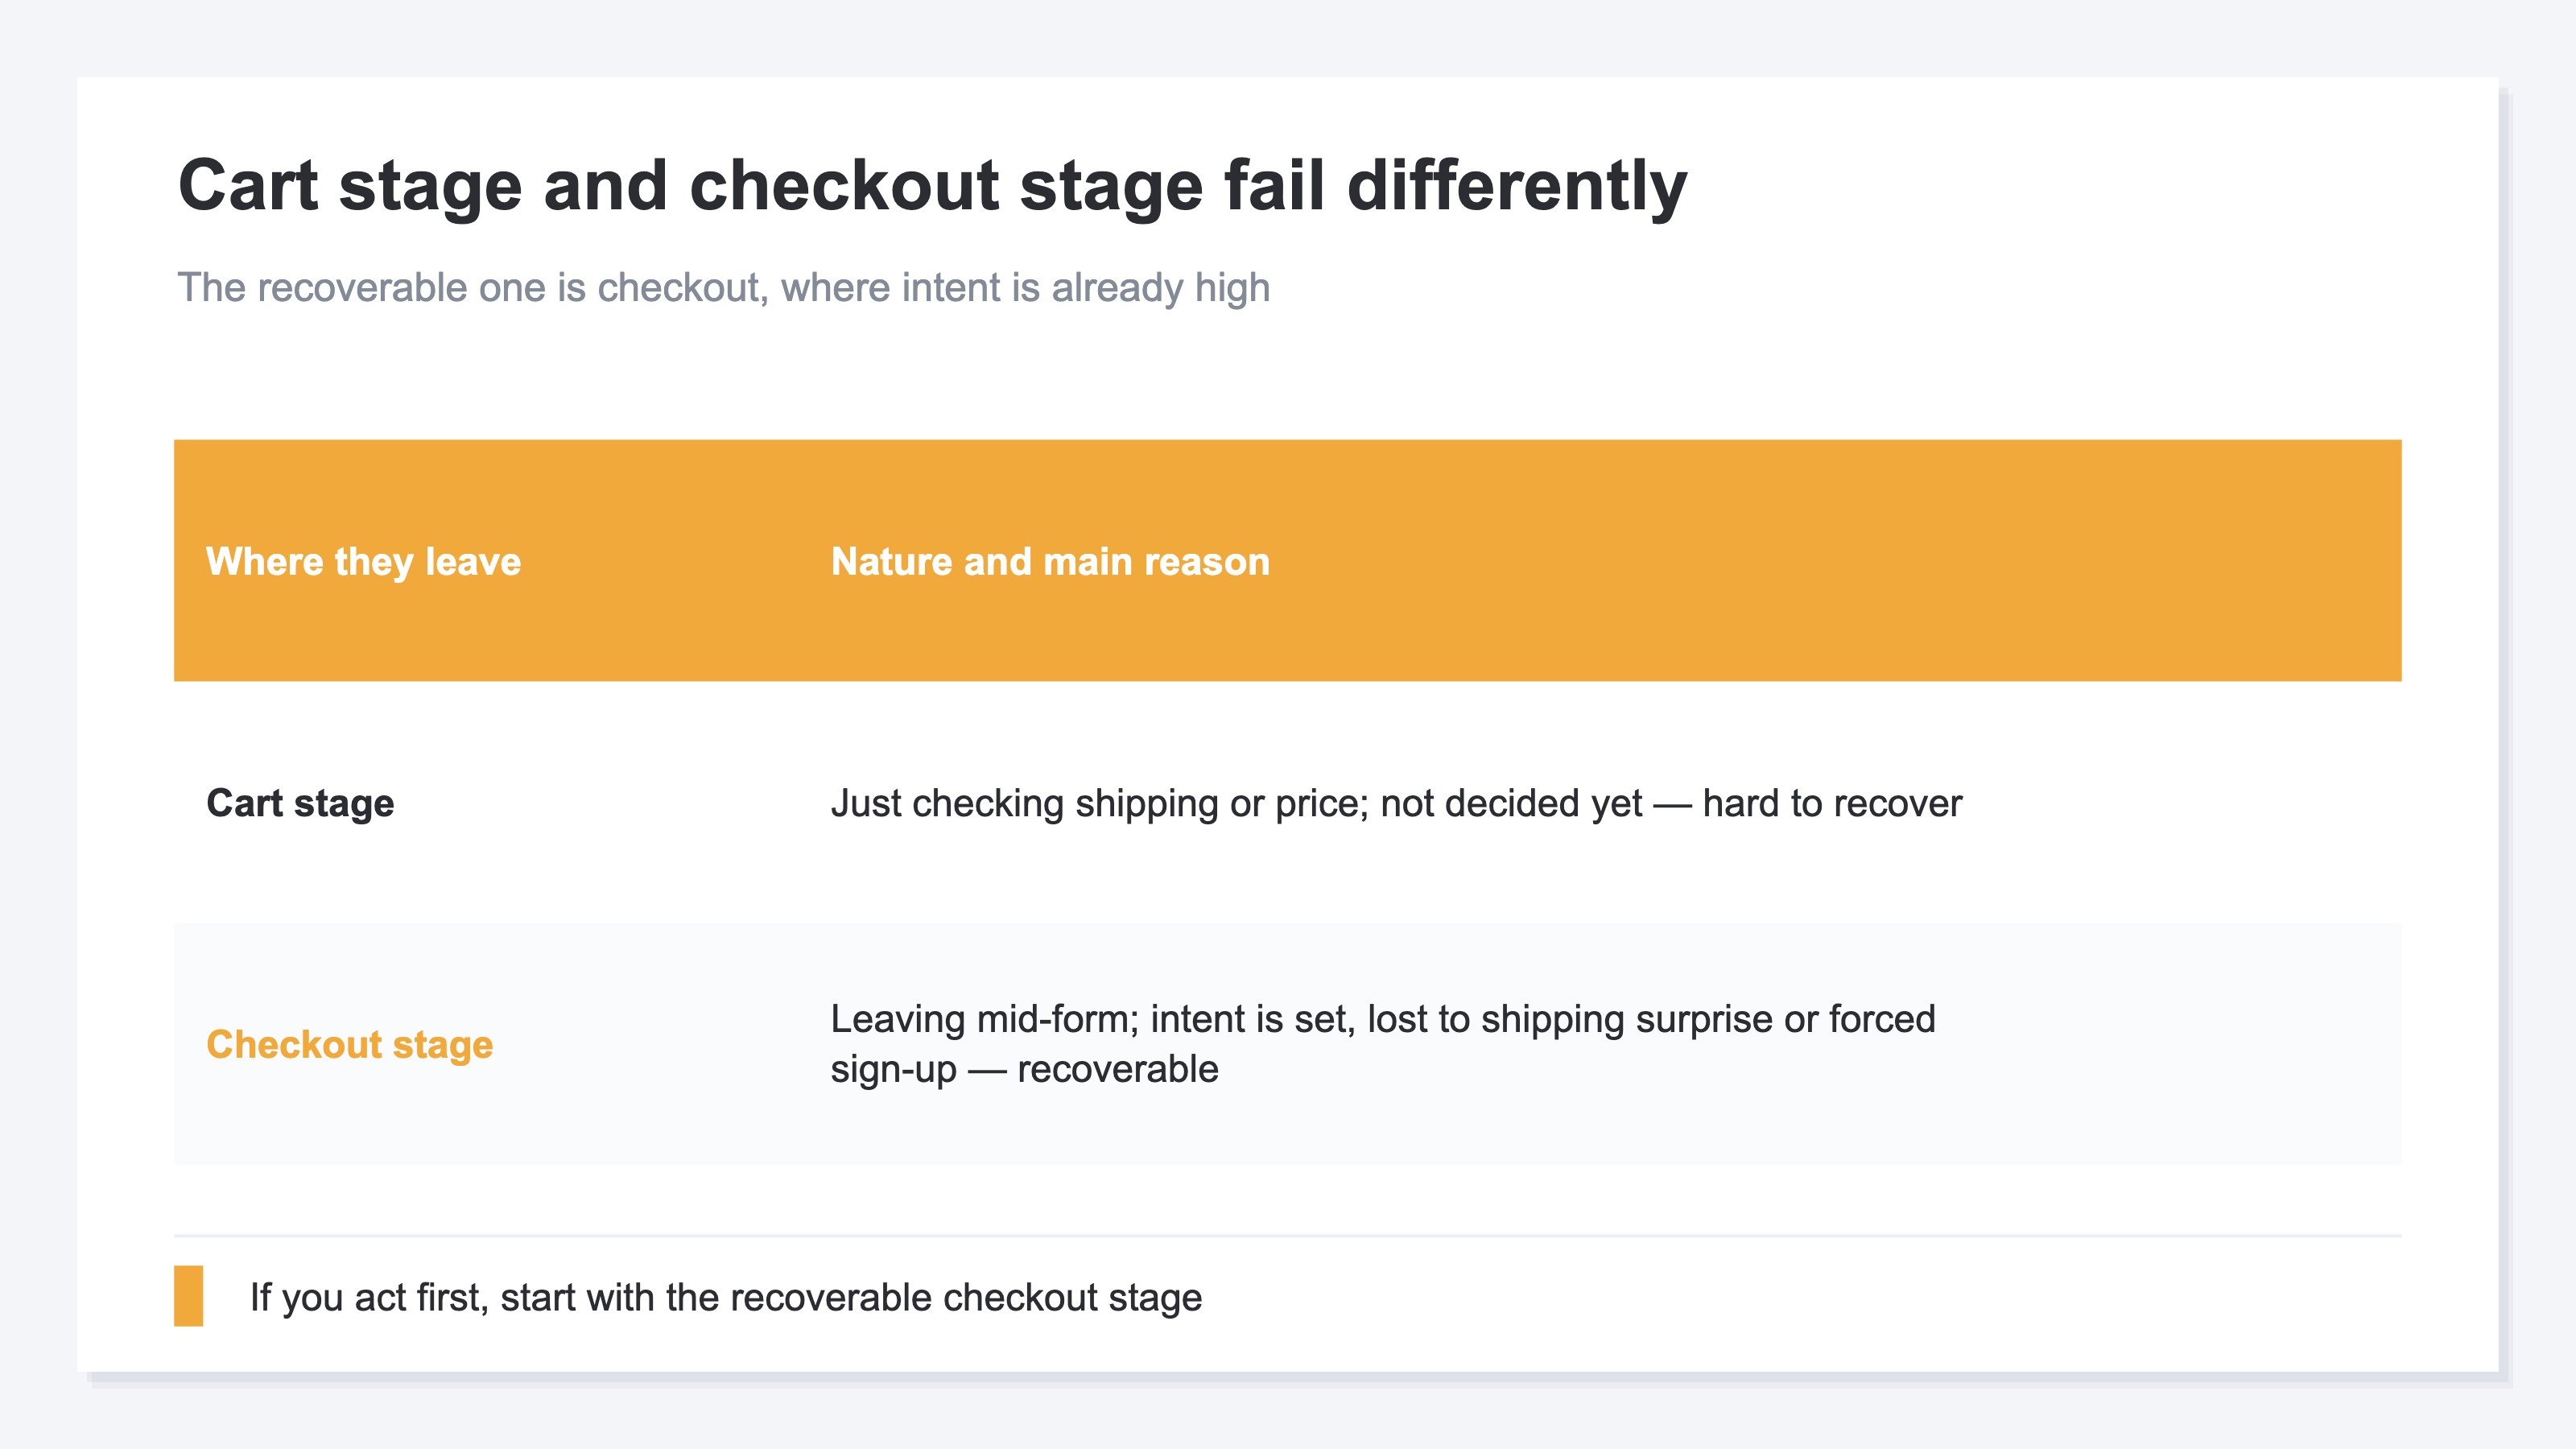
Even within cart abandonment, how recoverable it is changes a lot between the "cart stage" and the "checkout stage." The checkout stage, where intent is already set, is the easier one to win back.
Cart abandonment happens in two broad places. One is the "cart stage"—adding items to the cart and checking shipping and the total. The other is the "checkout stage"—dropping off midway through entering name, address, and card number. These two are completely different in nature.
Most people who leave at the cart stage haven't decided to buy yet. They see the shipping cost and feel "that's higher than I thought," or they step away meaning to buy later. People who reach the checkout stage, on the other hand, have largely made up their minds. When their hand still stops mid-entry, it's because of an "almost there" snag. So even within cart abandonment, the ones easier to win back through tactics are those who hesitated at the checkout stage.
Among the many reasons, the most common is shipping. When shipping isn't visible on the product page and is tacked on right before payment, people leave in droves. Put the other way: simply showing shipping at the product-page stage can cut abandonment considerably. Other reasons follow—requiring account creation drives off about one in four shoppers, too few payment options (deferred payment, mobile wallets, and so on), and long, confusing entry forms[2].
Concrete fixes—showing shipping, sending reminders, adding payment methods—are numerous, so we've gathered them separately in 30 checklist items to lift CVR. But trying every one of them blindly isn't wise. They all look promising, but whether they actually worked can only be told by whether revenue moved. The next section lays out how to see that.
3. The rate cannot show revenue | see revenue lost, by channel#
The single number that is cart abandonment rate won't show you where, and how much, revenue is slipping. So shift your angle from "the rate" to "revenue by channel."
The clues are conversion rate (CVR, the share of people who visited and actually bought) and RPS (revenue per session). If cart abandonment rate is "the share who didn't buy," conversion rate is its flip side—"the share who did." Line up actual revenue and RPS for each channel next to these, and "which channel is losing revenue relative to its traffic" comes into view. For the difference between CVR and RPS, see RPS vs CVR: which to watch in ecommerce.
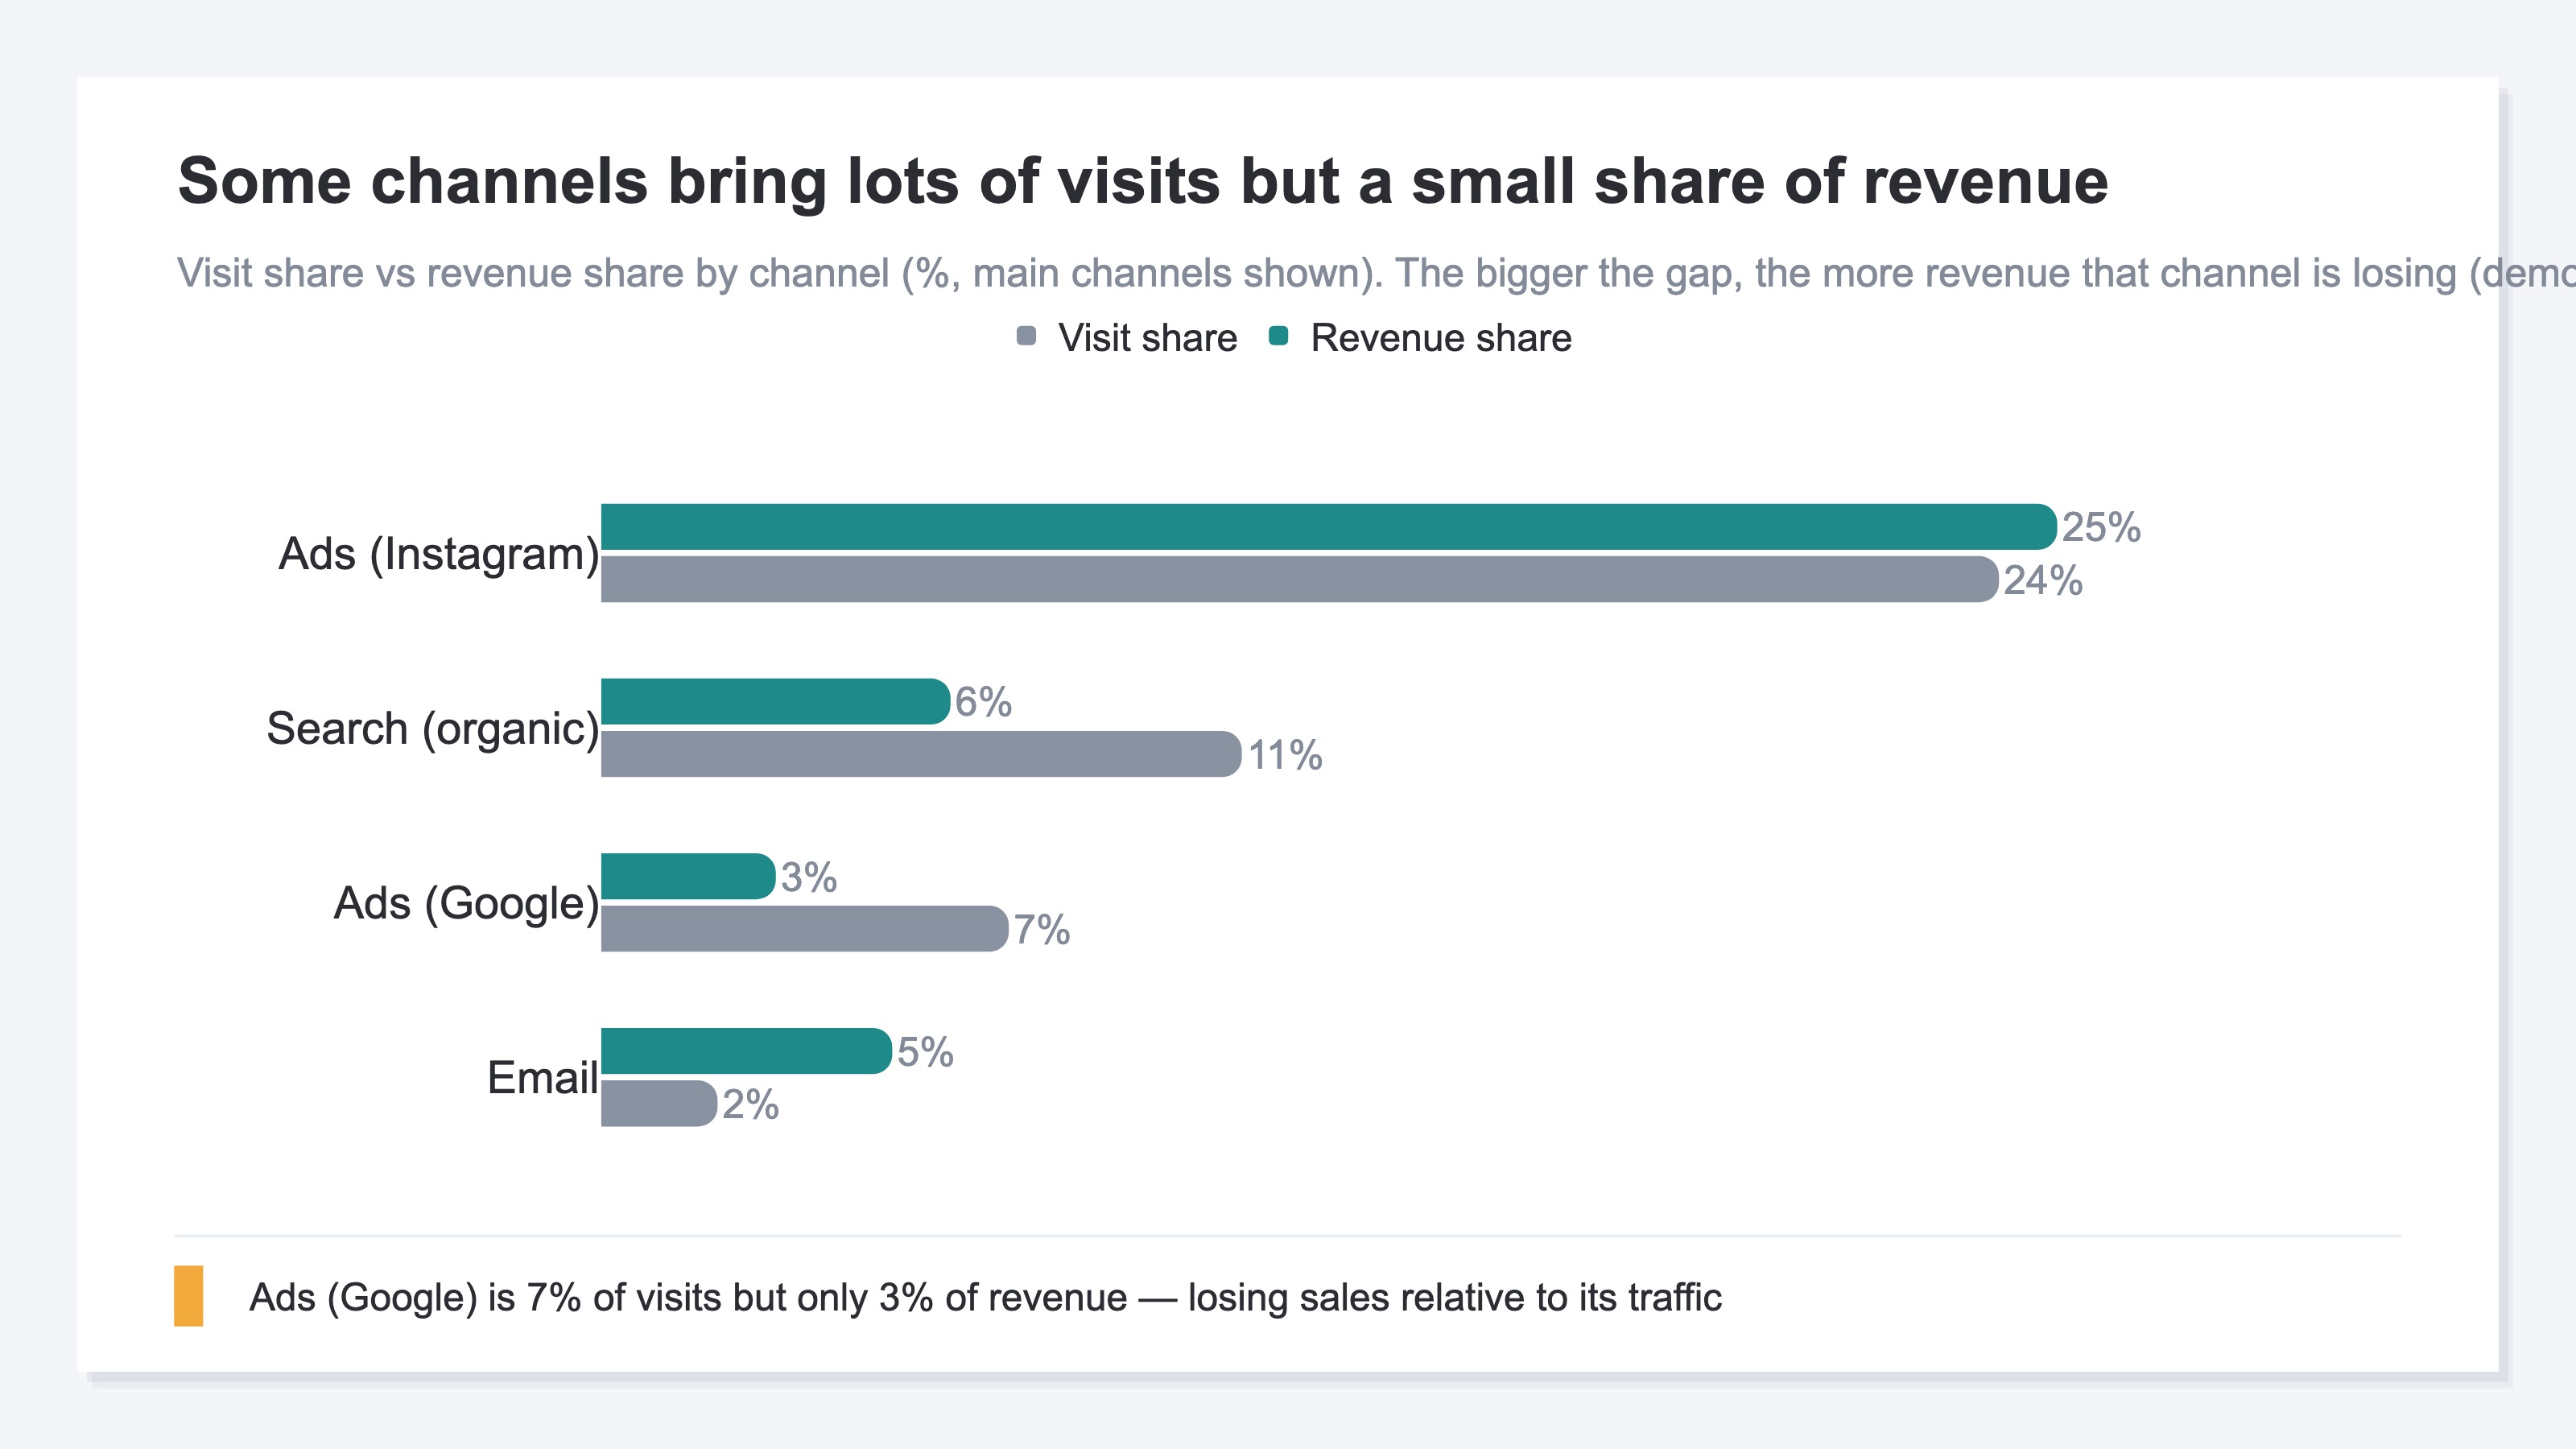
For example, it's common for ad traffic to be large in number yet low in RPS, while search traffic is small in number yet high in RPS. Ads bring in many "clicked on a whim, low intent to buy" visitors. We also cover per-channel revenue efficiency in Comparing EC acquisition channels. Even within the same cart abandonment, a channel whose revenue share is small relative to its visit share is the prime suspect for high-purchase-intent shoppers abandoning their carts. That's where to act first.
But try to produce this in GA4 alone and you stumble partway. Direct/(none) that clumps up when the referrer is missing, attribution that leans toward last-click, and reconciling with purchase data—the more precisely you try to split revenue by channel, the more the numbers break down. The attribution pitfall in particular is covered in The trap of judging by last click alone. The idea is simple, yet trying to keep splitting revenue by channel accurately every month is where you run out of steam—that's the real wall.
RevenueScope solution
When you try to grasp cart abandonment through revenue, you keep hitting the same wall. You want to know precisely "which channel is losing revenue," but the numbers for that are scattered across multiple places and break down on Direct/(none) and attribution.
RevenueScope consolidates this scattered data and displays revenue and RPS (revenue per session) for each channel together (figures are demo data). You can switch the attribution model beyond last-click to first / linear / time-decay to check the same revenue from another angle. Revenue that ties to no channel (unattributed) is shown, too.
| Channel | Sessions | Revenue | RPS |
|---|---|---|---|
| Ads (Instagram) | 946 | ¥184,525 | ¥195 |
| Ads (Google) | 293 | ¥24,972 | ¥85 |
| Search (organic) | 455 | ¥48,345 | ¥106 |
| 91 | ¥40,365 | ¥443 | |
| Unattributed (no referrer) | — | ¥73,237 | — |
What stands out in this table is that visit count and revenue efficiency (RPS) don't line up. Ads (Instagram) draws the most visits at 946 sessions, yet its RPS is ¥195; and the same "ads" bucket holds Google Ads at the lowest RPS of ¥85 — plenty of people arrive, but they drop off just short of turning into revenue. Email, meanwhile, has just 91 visits but the top RPS at ¥443. So if you're going to put effort into cart abandonment, start with the ads that draw many visits yet run a low RPS — Google Ads above all. Try moves like showing shipping on the product page and adding payment methods, aimed precisely at the ad-sourced people who are losing you revenue, then check whether RPS and revenue moved from ¥85. That sequence comes into view. For which pages actually earn revenue, the thinking in Landing page revenue efficiency also helps.
What RevenueScope shows is revenue and RPS by channel, attribution switching, and disclosure of unattributed revenue. It does not produce the cart abandonment rate itself, a stage-by-stage breakdown of "what percent dropped at the cart stage and what percent at the checkout stage," or an estimate of recoverable amount—but it provides the material to grasp, in revenue terms, which channel is losing you sales, and the recovery estimate is something you can calculate yourself: RPS × the sessions you're losing.
FAQ#
Frequently asked questions#
Q. What cart abandonment rate should I aim to stay under?
A. There's no single "you're safe at this number." It varies widely by industry and price point—higher-priced products get considered longer, so the rate runs higher. What matters is the trend and per-channel revenue, not the absolute value. First get a read on your own rate, then watch whether it has suddenly risen compared with last month or the month before. And rather than chasing one rate, seeing "which channel's people are abandoning their carts" in revenue terms reveals the move to make.
Q. How are cart abandonment rate and conversion rate (CVR) different?
A. They're two sides of the same coin, seen in reverse. If cart abandonment rate is "the share who added to cart and didn't buy," conversion rate is "the share who visited and bought." The difference is that conversion rate can be broken down by channel (ads, search, email, and so on) and by page. Cart abandonment rate is a single number rolled up for the whole, so it won't tell you where to act. When you want to confirm whether a tactic worked, conversion rate along with RPS and revenue are the practical lens.
Q. I ran tactics but the cart abandonment rate won't drop. Why?
A. Cart abandonment rate includes not just genuine drop-off but also browsing, price comparison, and automated programs (bots). Those can't be reduced by tactics, so the overall rate barely moves. That's exactly why, instead of watching the rate go up and down, you confirm the effect by whether the revenue and RPS of the channel you acted on rose. Even if the rate is flat, if the revenue from higher-intent buyers went up, that tactic is working.
Summary#
Cart abandonment rate is the share of items added to a cart but not bought, and the global average is about 70% (Baymard). But that figure is a combined value of genuine drop-off, browsing, and bots—a high rate isn't a failure in itself. If anything, it's the flip side of something healthy: people are reaching the cart.
What matters isn't chasing a single rate, but seeing—in revenue terms—whether people drop off at the "cart stage" or the "checkout stage," and "which channel's people are abandoning their carts." The recoverable one is checkout-stage drop-off, and the biggest cause is shipping shown late. After you run a tactic, confirm its effect by whether revenue and RPS moved. First measure your own cart abandonment rate once, clearly, then shift your eyes to revenue and RPS by channel. Once that comes into view, tactics you used to play on gut feel turn into moves backed by evidence.
See which ads actually drive revenue, at a glance
Free up to 5,000 sessions/month, AI analyst included. No credit card required. Up and running in 5 minutes.