
"We did install the GA4 ecommerce events — but in the end we still can't tell where customers are dropping off." This is the most common question we hear from EC operators who got the setup done but stalled just before turning the numbers into improvements.
This article first lays out, step by step, how to visualize the drop-off from product view to completed purchase in GA4 and judge which stage is leaking — in a three-layer structure of setup HOW, interpretation WHY, and improvement ACTION. Then, at the end, it goes one step further into what GA4's standard reports structurally cannot show: not where on the whole site customers fall away, but which channel's funnel you should fix first to grow revenue.
Contents
What this article covers#
-
Build the funnel in 5 stages
View → add-to-cart → checkout start → payment info → purchase lets you visualize which stage of the whole site is leaking[1]
-
Read the numbers on two axes — industry comparison and stage comparison
Don't read absolute values. Spot the abnormal stage from the gap against industry-typical rates and from the unevenness of stage-to-stage drop[2]
-
GA4 only takes you as far as "where customers drop off"
What GA4 shows is which stage of the whole site is leaking (WHERE). For the same drop-off, fixing the leak on a channel that generates revenue is what moves the needle. But the material for deciding which channel's funnel to fix first — channel-level CVR and revenue efficiency (RPS) — structurally never appears in GA4's standard reports.
1. What funnel analysis is — the 5-stage structure#
Bottom line: EC funnel analysis is a method that splits the drop-off path to purchase by stage and visualizes "where, across the whole site, customers are leaking."
EC funnel analysis is a method to visualize the drop-off stages on the way to purchase. With GA4's standard e-commerce events, you can observe the following five stages with zero additional implementation.
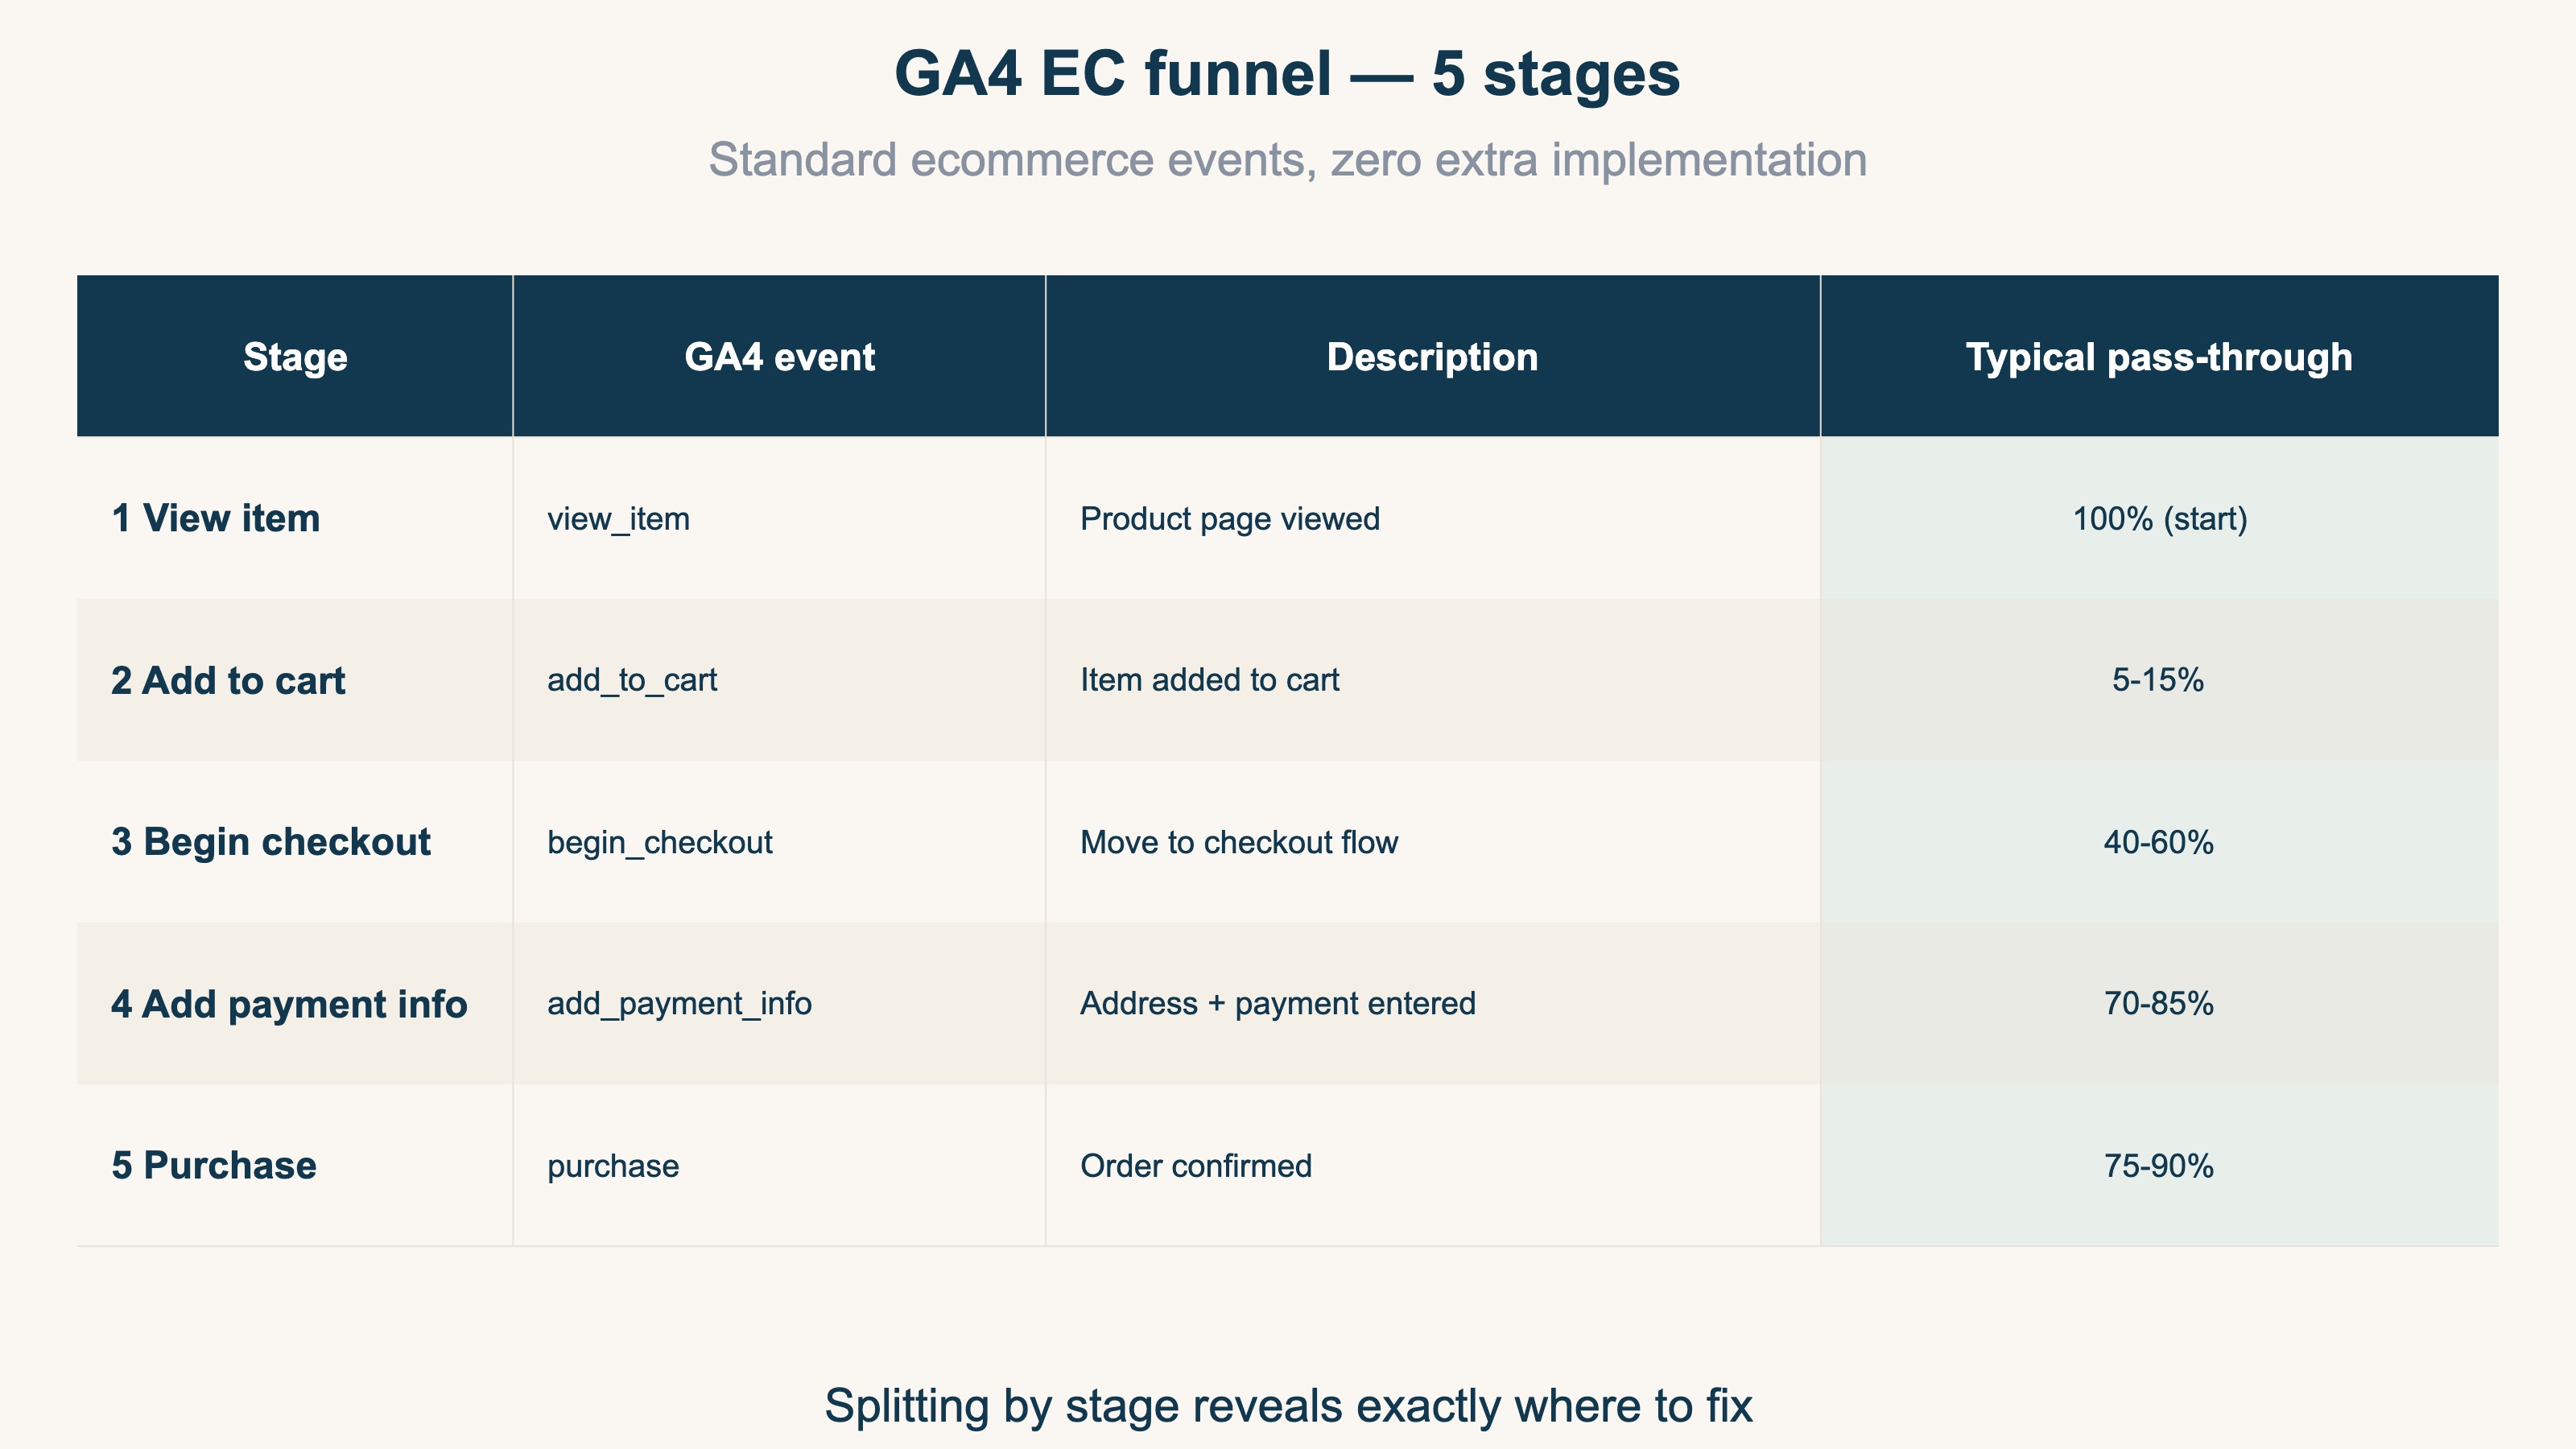
The five stages are view_item (product view) → add_to_cart → begin_checkout → add_payment_info → purchase. Calculating the pass-through rate at each stage decomposes the site-wide CVR into "where it is dropping," stage by stage.
If your site has a CVR of 1.5%, a view_item→add_to_cart rate of 8%, and an add_to_cart→purchase rate of 18%, you can conclude that the biggest leak is at the very first stage. Looking at CVR alone, all you see is "low overall," and your fixes scatter — but split it by stage and the spot to fix becomes identifiable.
When you want to see session-level revenue efficiency, pairing it with RPS (Revenue Per Session — a metric not yet widely adopted in Japan) makes your judgment more three-dimensional (RPS complete guide).
2. The 5-step GA4 setup#
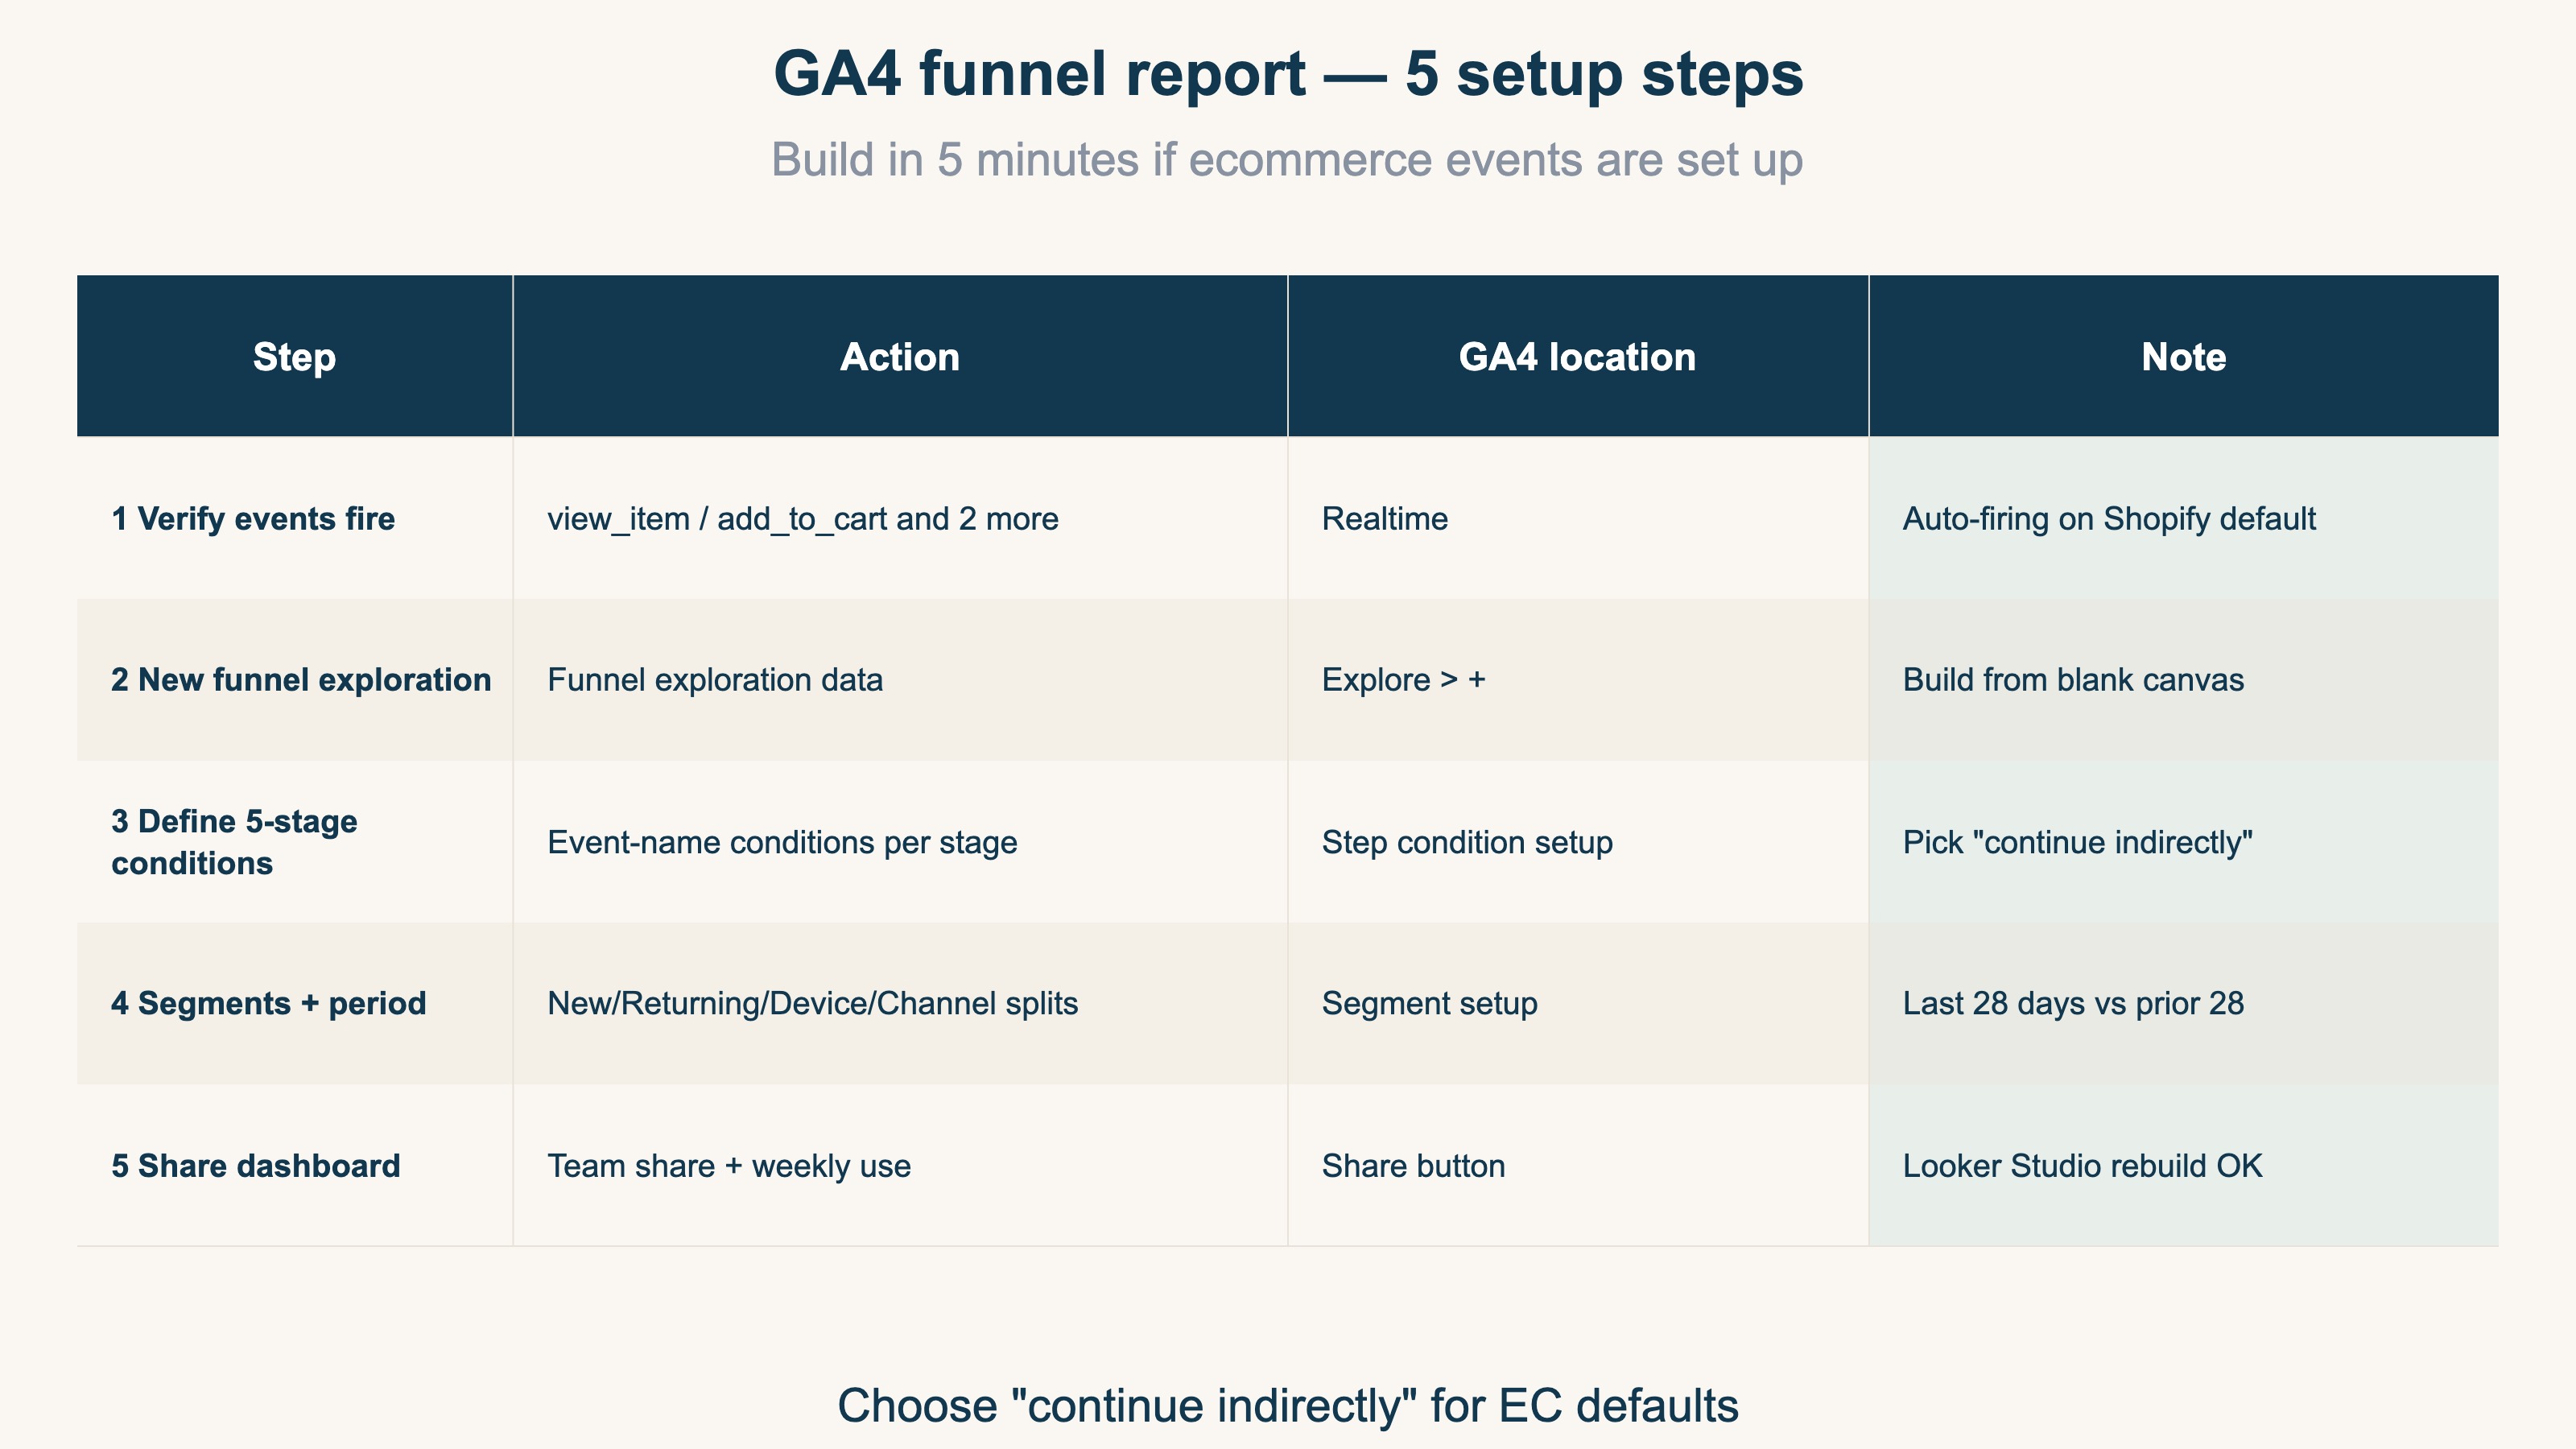
Bottom line: If your ecommerce setup is done, you can build the funnel in five minutes in the exploration report. The procedure itself isn't hard.
If your GA4 ecommerce setup is done, you can build the funnel in five minutes in the exploration report. For the full post-setup revenue-analysis flow, see Shopify×GA4: Metrics That Matter After Setup.
Step 1: Verify ecommerce events fire#
In GA4's "Realtime" report, confirm the four events view_item, add_to_cart, begin_checkout, and purchase are firing. Shopify's standard integration fires them automatically; custom themes sometimes miss events (GA4 ecommerce setup checklist).
Step 2: Create a new funnel exploration#
Go to GA4 "Explore" → "+" → "Funnel exploration." Building from a blank canvas gives you more customization freedom.
Step 3: Define the 5-stage step conditions#
Set "event name = view_item" for each step. Choosing "continue indirectly" captures drop-off across multiple sessions as well. Because EC has long consideration periods, continue-indirectly is the standard.
Step 4: Configure segments, period, and comparison#
Add segments by new/returning, by device, and by channel. The standard period is the last 28 days vs. the prior 28 days.
Step 5: Share the dashboard#
Hand the completed funnel to your team via "Share." Adopting a routine of opening the same funnel in your weekly review keeps improvement tracking continuous.
3. Reading the funnel numbers — industry-typical values#
Bottom line: Pass-through rates vary widely by industry, so read against the gap from industry-typical values, not against absolute numbers.
Pass-through rates at each stage vary widely by industry, so read against the gap from industry-typical values rather than absolute numbers.
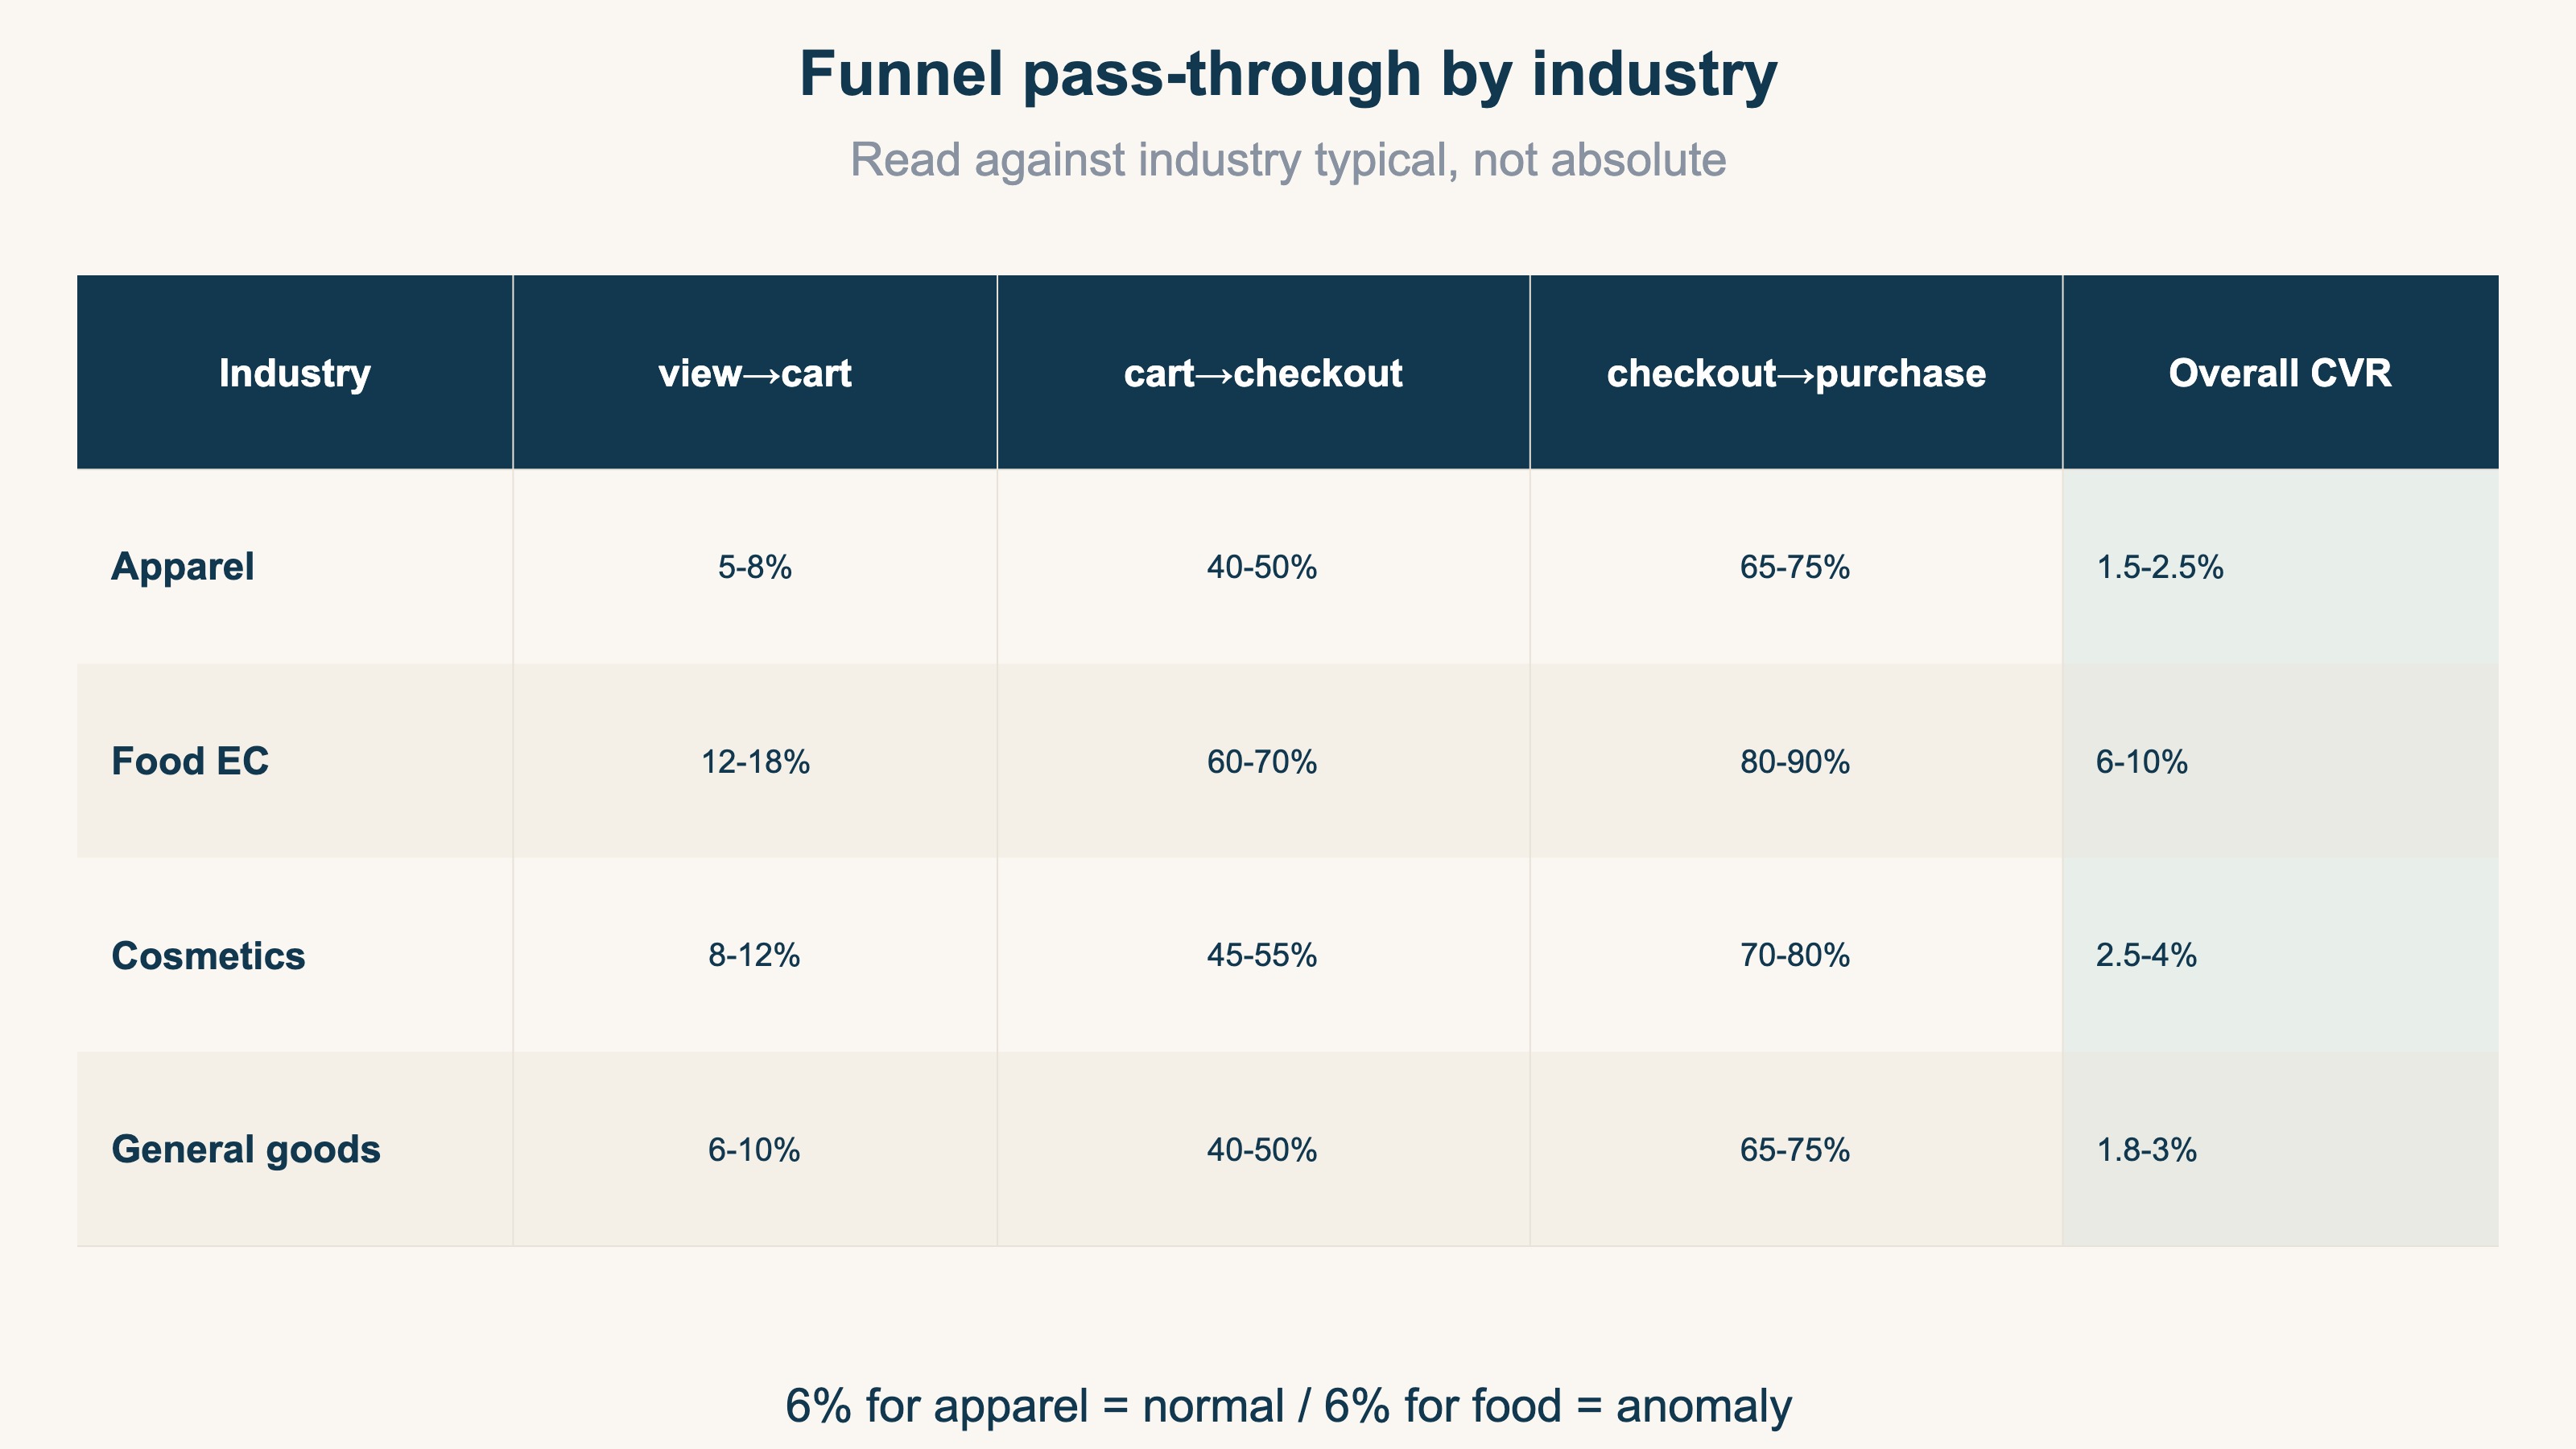
Apparel shows a low view_item→add_to_cart rate of 5-8%, but that's not abnormal because browsing behavior is high. Food EC, by contrast, is high at 12-18% — because many visits come from immediate need.
Before deciding "our pass-through rate is 6%, so we'll improve the LP," be aware that if the industry-typical value is 5-8%, holding steady can be a valid call too. The room for improvement is large only at stages clearly below the typical value.
Beyond the funnel-stage numbers, looking at the final CVR and AOV (average order value) together sets your improvement priorities (How to raise CVR and AOV together).
4. Stage-by-stage improvement actions#
Bottom line: Once you see "which stage is abnormal," separate cause and action by stage. Target the wrong stage and your campaign spend is wasted.
Once you can see "which stage is abnormal," separate the actions by stage. Because targeting the wrong stage wastes campaign spend, mapping cause to action matters.
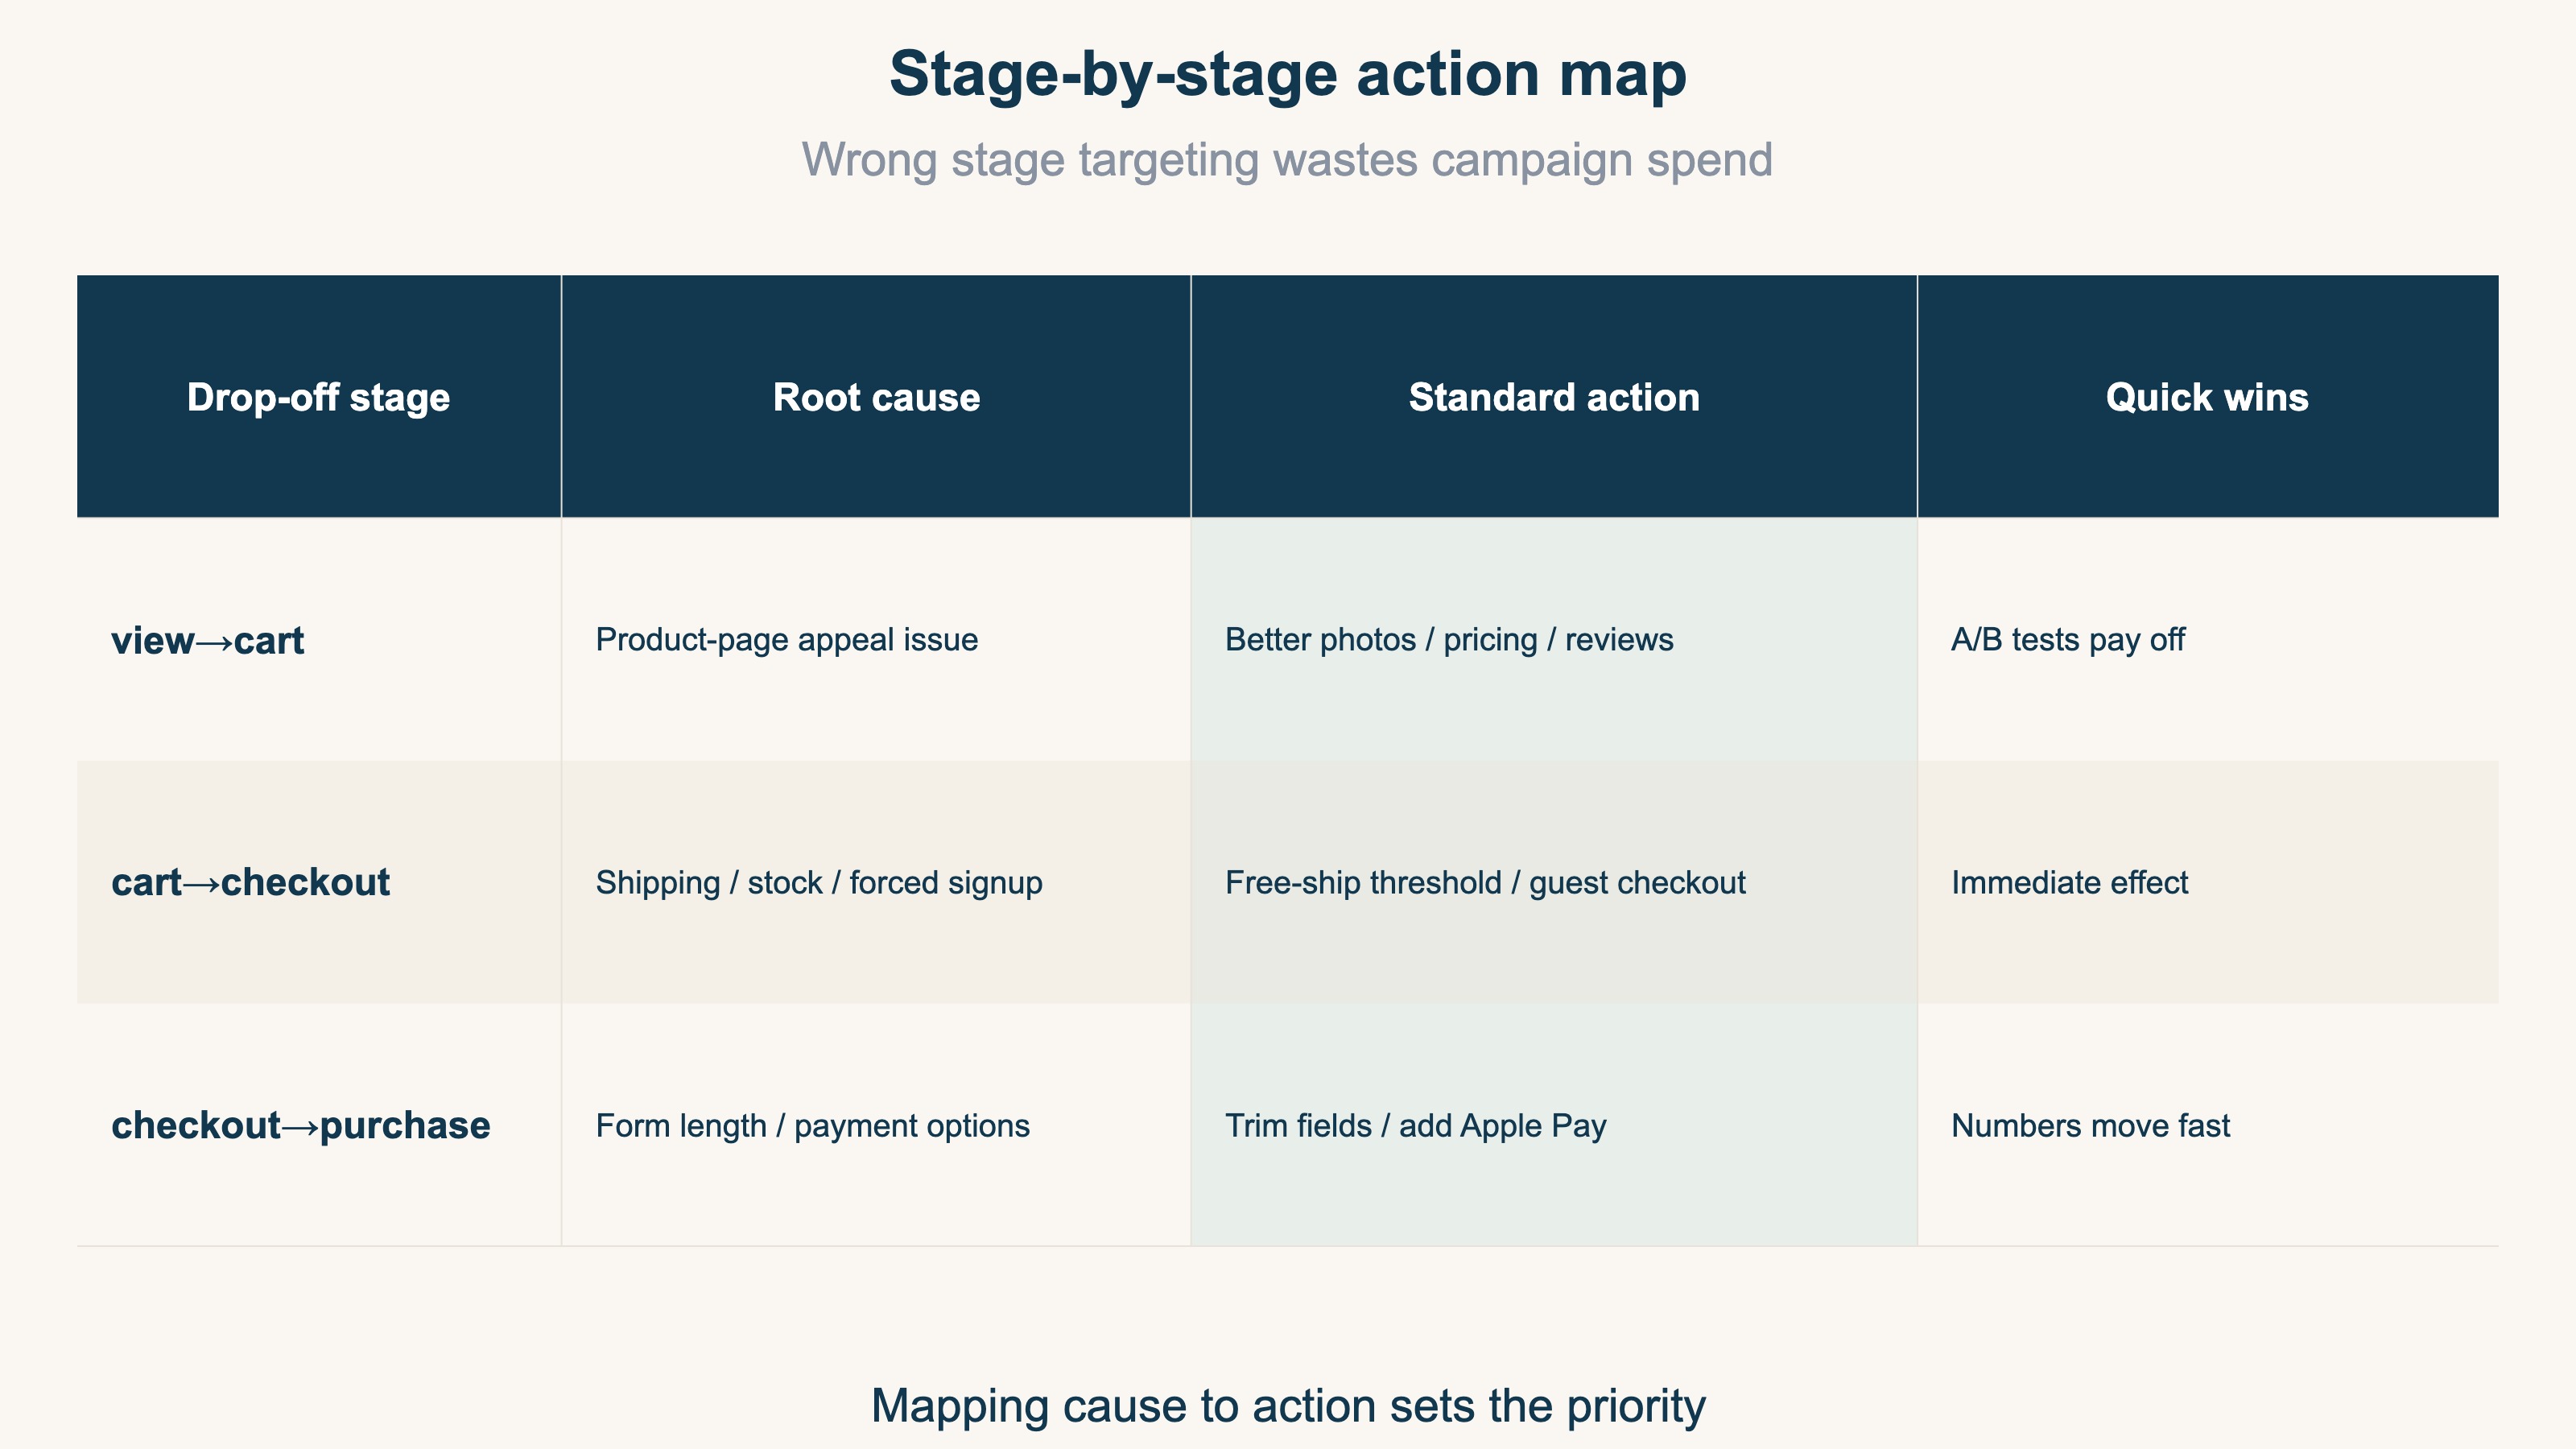
A view_item→add_to_cart leak is a product-page appeal problem. Product photos, price display, review count, and stock notation all matter. The numbers move easily on LP appeal changes, and A/B tests pay off readily at this stage.
An add_to_cart→begin_checkout leak is a shipping, stock-out, or forced-signup problem. Adjusting the free-shipping threshold and adding guest checkout are the go-to fixes.
A begin_checkout→purchase leak is a form-length or payment-options problem. Trimming form fields and adding Apple Pay / Amazon Pay are effective.
Looking at the AOV (average order value) of users who completed purchase after running your fixes captures the overall effect (AOV complete guide).
5. GA4 only shows you "where" customers drop off#
Bottom line: Everything the GA4 funnel above shows you is "which stage of the whole site is leaking (WHERE)." "Which channel's funnel to fix (WHICH CHANNEL)" structurally does not appear in GA4's standard reports.
By now it's clear that GA4 funnel analysis is a powerful tool. But there's a ceiling on what it reveals. What the GA4 funnel shows you is which stage of the whole site is leaking — that is, the WHERE of "they're dropping at the cart" or "they're dropping at payment." The setup procedure, the way to read the numbers, the stage-by-stage actions — all of it you can complete DIY up to this point.
The moment you go to act on a fix, though, a question one level deeper blocks the way. For the same "20% drop at the cart," the question remains: which channel's customers are dropping? The funnel of someone who came from search ads and the funnel of someone who came from your newsletter differ completely — both in the rate of reaching purchase (CVR) and in the revenue per single visit (RPS). For the same 20% drop-off, fixing the leak on a channel that generates strong revenue has a far bigger effect on profit. Conversely, however much you polish the funnel of a channel with inherently low revenue efficiency, the upside is limited.
The problem is that the material for deciding which channel's funnel you should fix first structurally never appears in GA4's standard reports. Because GA4 aggregates around sessions and events, you can see the whole-site funnel and, at most, the pass-through rates per segment. But lining up CVR, AOV, and revenue efficiency (RPS) by channel in a single table to name "which channel's funnel grows revenue if fixed" — that perspective lies outside the structure of the standard reports. And if you try to view this on actual figures after excluding bot access, the manual-work wall gets one step higher still.
In other words, GA4 funnel analysis is a tool that takes you as far as WHERE (which stage is dropping). The next part — WHICH CHANNEL (which channel's funnel is worth fixing) — won't reach you unless you add a different lens. This is the fork between setting up the funnel and stopping there, and pushing on to the priorities of revenue improvement.
RevenueScope — how it helps
Bottom line: RevenueScope lines up CVR, AOV, and revenue efficiency (RPS) by channel on one screen, so you can name "which channel's funnel grows revenue if fixed." It's the tool that fills in the WHICH CHANNEL that lies beyond the WHERE GA4 shows you.
Even when the GA4 funnel tells you "which stage is dropping," the last wall is always the same. You want to decide which channel's funnel to fix first, but channel-level CVR and revenue efficiency don't come out separated in GA4's standard reports.
RevenueScope consolidates those unseparated numbers onto a single screen. It matches each ad platform's ad spend (importable via a read-only Google Ads integration, or by manual entry) against the site's revenue and sessions, and lines up CVR, AOV, and revenue efficiency (RPS) by channel (figures are demo data).
| Channel | Visits | CVR (purchase rate) | AOV | RPS (revenue efficiency) |
|---|---|---|---|---|
| 800 | 7.5% | ¥12,000 | ¥900 | |
| Search (organic) | 2,500 | 3.2% | ¥9,800 | ¥314 |
| Search ads (Google) | 3,000 | 3.0% | ¥10,000 | ¥300 |
| 2,200 | 1.4% | ¥8,500 | ¥119 |
Seen on a single screen, what the whole-site GA4 funnel hid surfaces at once. Email tops the purchase rate (CVR) at 7.5% and stands out on revenue per visit (RPS) too, at ¥900. Instagram, meanwhile, has plenty of visits at 2,200 yet a CVR of only 1.4% and an RPS of just ¥119. That's a sign of a big drop-off somewhere in the funnel of customers coming from Instagram. For the same "dropping at the cart," the one most worth fixing first is Instagram's funnel — high in visits, low in efficiency. The priority gets decided by the numbers. It's a call you could never reach staring flatly at the whole-site funnel.
Let's be clear about one thing. What RevenueScope does is split CVR, AOV, and revenue efficiency (RPS) by channel and line them up on a single screen. Which channel's funnel to tackle first — that final decision is yours. And profit margin (gross margin), customer lifetime value (LTV), and inventory — numbers on the accounting and inventory-management side — are not handled by RevenueScope. What it produces goes as far as purchase rate, revenue efficiency, and AOV by channel. It assembles the material for where to fix, but you're the one holding the wheel.
Frequently asked questions#
Q1: Exploration report numbers differ from Realtime report numbers#
Exploration reports have a 24-48 hour delay by design and pull from a separate data layer. Use prior-day numbers for daily decisions, and wait until day 3 of the following month for monthly judgments.
Q2: What's the difference between "continue indirectly" and "continue directly"?#
"Continue directly" measures within the same session only; "continue indirectly" captures drop-off across multiple sessions. Because EC frequently sees "cart held, purchased the next day," choose continue-indirectly.
Q3: Can I see channel-level funnels or CVR in GA4?#
You can split pass-through rates by channel with GA4's segment feature, but the perspective of lining up CVR, AOV, and revenue efficiency (RPS) by channel in a single table to compare "which channel's funnel grows revenue if fixed" lies outside the structure of the standard reports. You end up moving back and forth between multiple reports and rebuilding it by hand, and that monthly compiling becomes the biggest hurdle when turning the funnel into revenue improvement.
Summary#
Bottom line: Once the GA4 funnel shows you "which stage is leaking (WHERE)," the next step is to push on to "which channel's funnel to fix first (WHICH CHANNEL)" — only then do the priorities for revenue improvement get set.
GA4 funnel analysis is a powerful first step for visualizing "which stage is leaking" across the whole site. The setup, the way to read the numbers, the stage-by-stage actions — all of this you can complete DIY.
But what moves profit beyond that is the priority of which channel's funnel to fix first. For the same drop-off, fixing the leak on a channel that generates strong revenue is what works. For that, split CVR, AOV, and revenue efficiency (RPS) by channel and compare them on one screen. First, just once, lift your view up from the whole-site funnel and try splitting the numbers by channel. The moment you see the "low-efficiency channel's funnel" that the overall average had been covering up, the next place to fix changes.
See which ads actually drive revenue, at a glance
Free up to 5,000 sessions/month, AI analyst included. No credit card required. Up and running in 5 minutes.
References#
[1] Google "Recommended events for GA4" (2026)
[2] Baymard Institute "50 Cart Abandonment Rate Statistics 2026" (2025)


