Since the start of June, impressions and clicks in Google's Performance Max have been climbing. Orders and revenue, though, are the same as last month. The cause of that step is neither demand nor bidding. In June 2026, product reporting widened the range it aggregates. What grew is not demand — it is the breadth of the counting.
Contents
TL;DR#
- From June 2026, the range covered by Google Ads product reporting has expanded[1]
- Google states that the change may cause a one-time increase in metrics for Performance Max campaigns only[1]
- What is newly counted is PMax's networks beyond Search, plus Video, App and Demand Gen data[1]
- Impressions are counted for each product, so a single ad serve stacks up as many of them as there are products carried[1]
- Product report totals failing to match campaign report totals is a state Google describes as expected behavior[1]
1. What Grew Is the Scope the Product Report Counts#
In June 2026, the range covered by Google Ads product reporting expanded[1].
Until then, product metrics were available only for products in Performance Max ads serving on Search networks and in Standard Shopping campaigns[1]. From June, every network in a PMax campaign enters the same report, along with data from Video, App and Demand Gen campaigns[1]. This is why PMax alone jumps. One PMax campaign serves on surfaces beyond Search, so the newly counted range is at its widest there.
Google's help page states the effect of the change outright: "This may cause a one-time increase in metrics such as impressions, clicks, and more for Performance Max campaigns only"[1]. PMax is named as the thing that increases, so a screen that jumps for PMax alone is exactly the phenomenon that sentence describes.
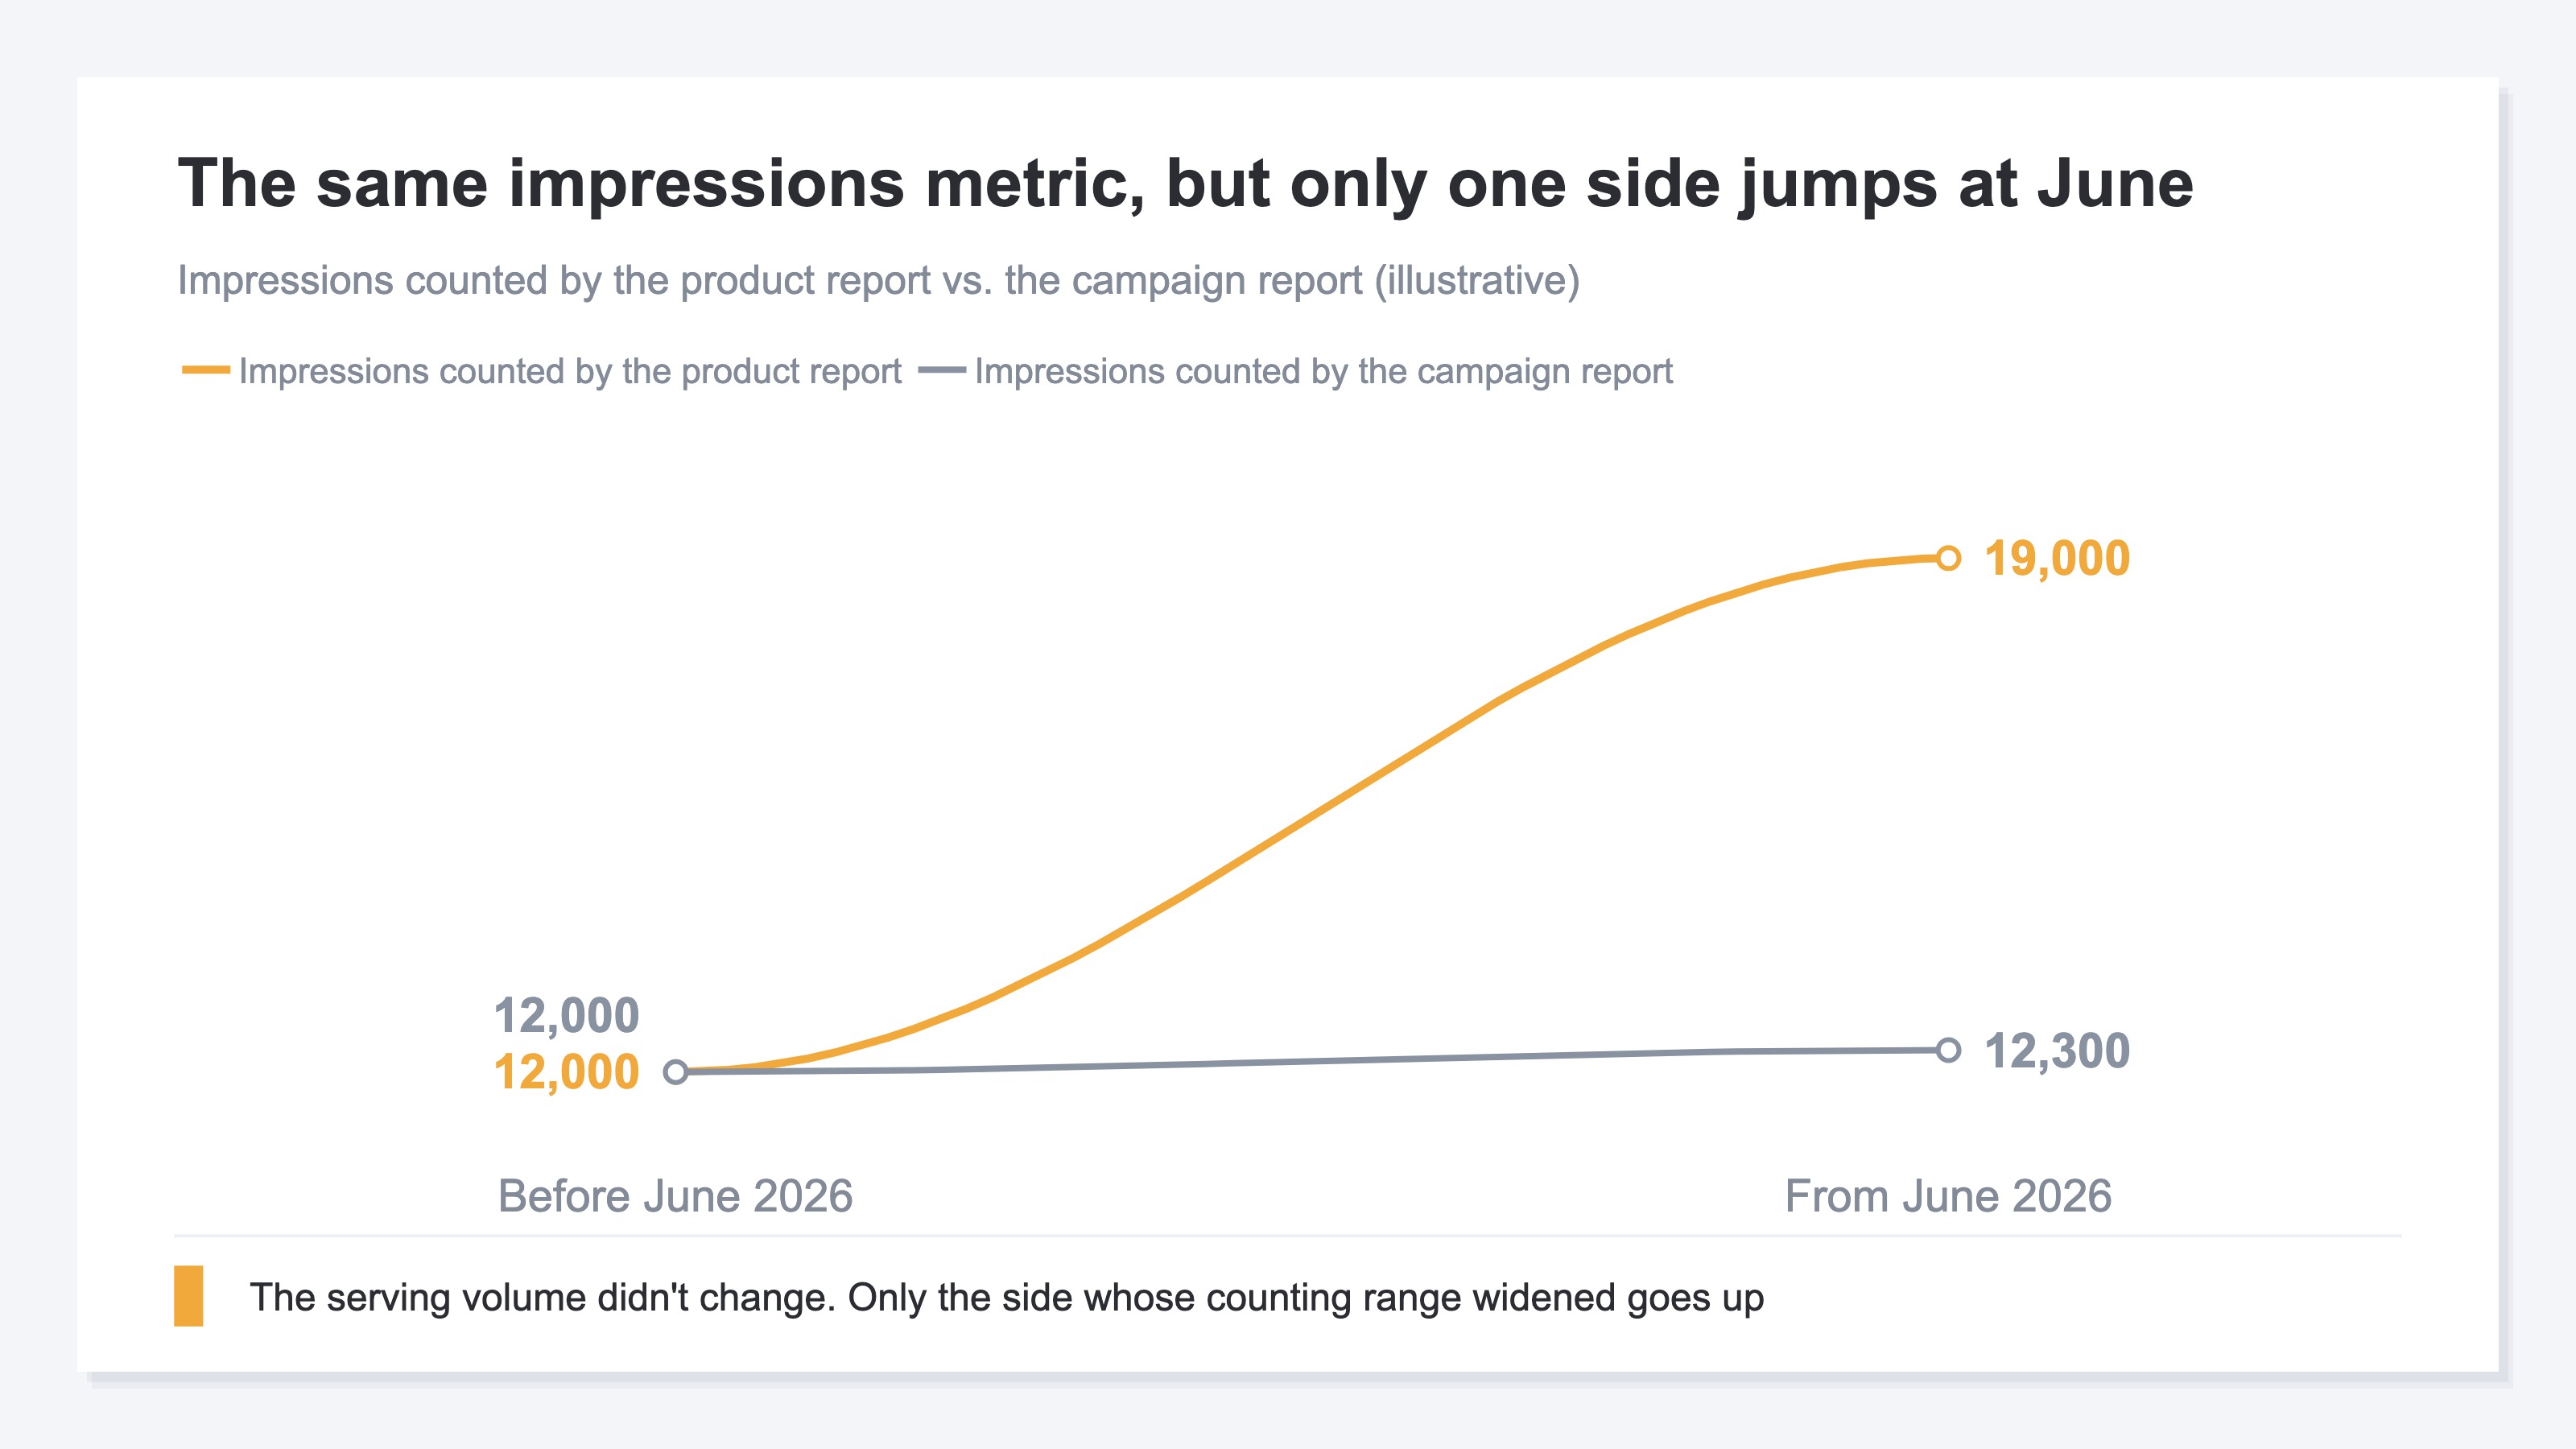
Nothing about the serving setup was changed. Bids, budget and the product feed are the same as they were before June. What changed is the range the report gathers from, not the way the ads go out. So impressions and clicks alone rise, while orders and revenue stay at the same height. What an impression counts as one is covered in what an impression is.
Product report totals sometimes do not agree with campaign report totals. Google writes that down as expected behavior too[1]. The step on the screen right now sits on the side of the spec, not on the side of a fault. Once you know there is nothing to fix, the next thing to settle is the axis you judge on. What will you treat the added impressions and clicks as, from here?
2. Counting Per Product Inflates the Volume Metrics#
An impression is counted not once per ad serve, but once for each product carried in it[1].
If a single ad features 5 products, one serve makes the product impressions 5[1]. For ads that look identical, a day carrying 2 products and a day carrying 5 leave data that differs by more than double. An impression was originally a metric that counts the number of times an ad was shown[2]. In product reporting it is counted by the number of products, so the number alone swells even when the volume served has not moved.
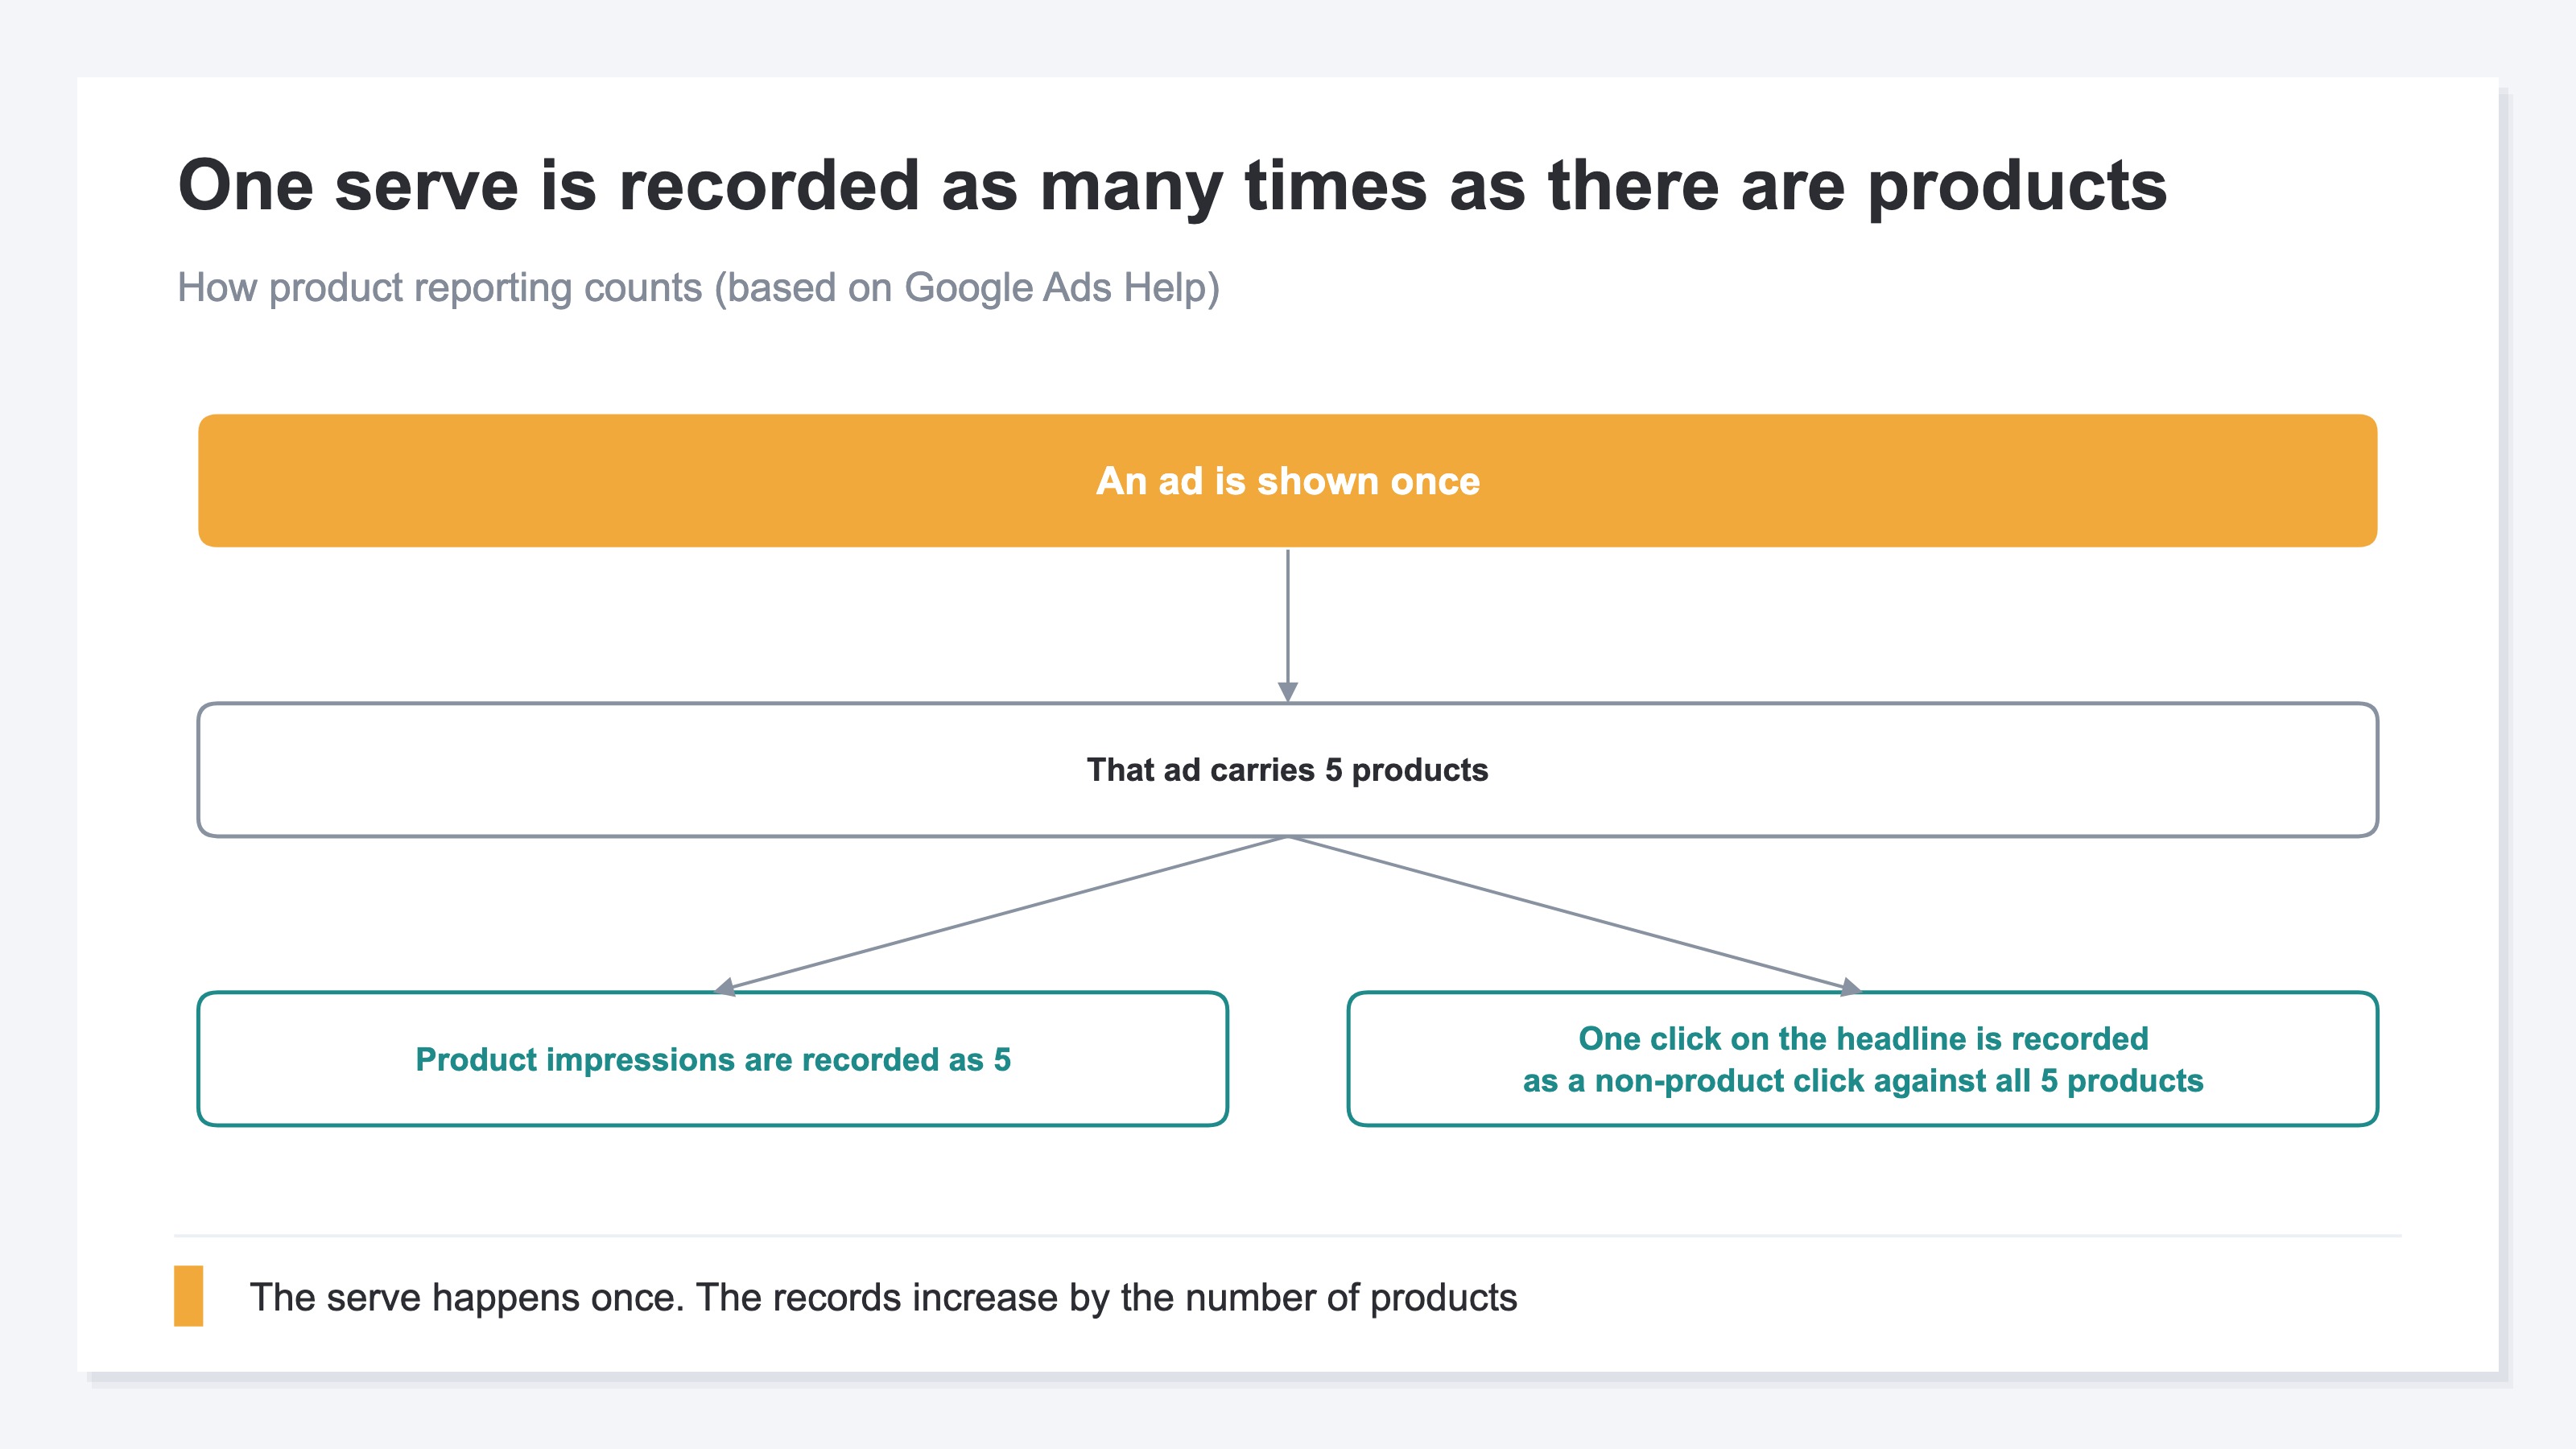
The click columns split in two as well. "Product clicks" is the number of times a specific product inside the ad was clicked directly[1]. "Non-product clicks" is the number of times the ad's headline or store name was clicked, and that one is recorded against every product included in the ad[1]. One click stays behind on as many rows as there were products carried.
Widen the denominator and the ratios move with it. CTR is clicks divided by impressions[3], so in a period where only the impressions side rose, it reads lower. The creative did not degrade.
What bites in practice is the column rename. The "Product clicks" column was previously titled "Clicks"[1]. Line last year's screenshot up against today's screen and a similarly named column in the same position is not necessarily counting the same thing. When you match against past material, it is safer not to treat a matching column name as your grounds.
Changes that alter the serving unit itself happen separately from this. How to verify when the Shopping surface widened is covered in checking AI Max Shopping traffic with UTM. This time it runs the other way: nothing about the serving changed, yet the report's numbers alone went up.
3. Separate What Changed From What Stayed Put#
What moved in June is only the volume metrics in product reporting. Orders, revenue and ad spend have not moved.
What is newly counted is PMax's networks beyond Search, plus Video, App and Demand Gen data, all of which sat outside product reporting until then[1]. Serving was not increased, and bids were not raised. So ad spend does not change, and orders do not change. What grew is the breadth of what gets counted.
The sorting finishes here. What changed its counting method at the June boundary is the per-product metrics lined up in product reporting. What did not change is the ad spend that left the account, and the orders and revenue the site itself received. The former carries a step at June; the latter does not.
So the order you read in starts from the side that did not change, not from the side that grew. Confirm first that orders, revenue and ad spend really are flat, and check the volume metrics that rose after that. Putting revenue per click on the axis is covered in the metric that keeps cheap clicks from pulling you.
4. How to Rebuild a Comparison That Spans June#
What you can use in a comparison that spans June is only the numbers whose counting did not change.
What changed its counting is the volume metrics in product reporting; what did not is orders, revenue and ad spend. Put the two on the same graph and only one of them bends upward at June. Move bids or budget to match the bent line and the investment goes toward demand that never increased.
The direction to confirm is settled. Match the product report totals against the campaign report totals. The two may not agree, and Google explains that as expected behavior[1]. If the way the difference opens changed at the June boundary, the increase can be read as having come from the counting side.
That match-up tells you where the difference came from and no further, though. The practice of not forcing numbers together when they refuse to agree is covered in when ad and GA4 conversion counts don't match.
The ad console displays conversions and conversion value as well. But results counted by the platform sit on each platform's own screen, so they never land on the same row as the orders and revenue the site itself received. The standing approach of judging PMax — whose serving you cannot see inside — by landed revenue is collected in judging PMax by revenue instead of its black box. What this article handles is the response to a definition switching over at one point, June.
At this point, the PMax reporting question changes. Not "why did the clicks increase" but "which numbers can be compared before and after June without their meaning changing". Answering the second one takes not the platform's volume metrics but data that aggregates, per campaign, the orders and revenue the site itself received. The kind of data you need changes along with the question.
RevenueScope solution
The numbers whose meaning did not change before and after June are orders and revenue. Aggregating those per campaign is what RevenueScope does.
The traffic channel rows carry sessions, revenue, RPS (revenue per visit), visitors, average time on site, bounce rate and the number of bot visits excluded. For periods where ad spend has been imported, ad spend and ROAS appear on the same row. ROAS here is revenue that RS aggregated itself, divided by ad spend. Figures the platform declared are not used. Open a channel row and sessions, revenue, RPS, AOV (revenue per order) and CVR (the share of sessions that reached a purchase) appear for each campaign.
Taking one month at Fictional Store D as an example, a campaign comparison reads like this.
| Campaign | Sessions | Revenue | RPS | CVR |
|---|---|---|---|---|
| Summer Arrivals PMax | 1,200 | ¥0 | ¥0 | 0.0% |
| Repeat Staples PMax | 400 | ¥600,000 | ¥1,500 | 3.0% |
| Brand name search | 200 | ¥300,000 | ¥1,500 | 2.5% |
Note: what lines up on the demo screen is sample data from the sample store, refreshed daily. Fictional Store D above is a teaching example rounded for illustration, so neither the cast of campaigns nor the amounts match that table.
"Summer Arrivals PMax" leads on sessions and is the only row with revenue at ¥0. Its 1,200 visits have not turned into a single order across the whole month. Top of the three rows in volume, zero in quality. Meanwhile "Repeat Staples PMax", with a third of the sessions, earns ¥600,000, and its RPS of ¥1,500 matches brand name search. The number of visits and the revenue those visits leave behind line up in a different order.
What gets touched next is not the contents of the added clicks. It is the receiving end for "Summer Arrivals PMax". Review the product page it lands on, or the way products are picked for serving in the first place, and move the budget leaning there over to "Repeat Staples PMax". That decision can be made with numbers the June counting change does not touch.
FAQ#
Frequently asked questions#
Q. What should I do when I want to compare against a period before June?
A. Orders, revenue and ad spend have not changed how they are counted, so they can be compared across the boundary as they are. Product report impressions and clicks mean comparing numbers with different definitions once you span June. Rather than joining before and after into one line on a graph, cutting the line at the June boundary keeps you from misreading it.
Q. Do the added clicks really have no value?
A. You cannot say they have no value. What is newly counted is PMax's networks beyond Search, plus Video, App and Demand Gen data, all of which sat outside product reporting until then[1]. The serving itself did not increase, so treating the added volume as newly won demand estimates it higher than it is.
Q. My product report totals don't match my campaign report totals. Does that indicate a PMax reporting setup error?
A. No. Google explains that product report totals may not match campaign report totals, and that this is expected behavior[1]. Rather than spending time forcing them together, deciding first which report answers which judgment moves things along faster.
Summary#
Impressions and clicks in PMax rising from June while revenue stays put comes from the product report widening the range it counts[1]. What grew is not demand but the subject of the counting. Impressions are counted for each product, so the volume metrics stack up by the number of products carried[1].
One rule of judgment is enough. Use only numbers whose definition is the same before and after June for before-and-after comparisons. For numbers whose definition changed, read the movement inside the period from June onward only. Orders, revenue and ad spend belong to the first group; product report impressions and clicks belong to the second.
Whether you hold that line decides whether a reporting change gets to move the budget, or does not.
See which ads actually drive revenue, at a glance
Free up to 5,000 sessions/month, AI connection included. No credit card required. Up and running in 5 minutes.