
The week after you turn on enhanced conversions, the conversion count in Google Ads goes up. What went up is not the number of sales — it is the orders that until now left no record starting to leave one. Google states as a benefit of the feature that it recovers conversions that otherwise wouldn't have been measured[2]. Recovering means returning what was being missed to the count.
Contents
TL;DR#
-
The setup is correct. The increase is the result of measurement getting more accurate
Google lists recovering conversions that otherwise wouldn't have been measured first among the benefits of the feature[2]
-
One unit in the ad report is recorded inside a conversion window that starts from an ad interaction
A cart order is booked on the day the order was confirmed, so cutting the same week out of both still leaves you with different contents[4]
-
The reported total also holds volume estimated by machine learning
That volume is included only where there is high confidence that the ad resulted in conversions[3]
-
The material for isolating the increase sits on the side of real revenue over the same period
Check whether cart-side order counts and revenue rose the same way across the week you turned it on
1. Before You Add Budget to the Conversions That Went Up#
Add budget to the ad whose conversion count grew. Hold that one first move, and only for the few weeks right after you turn on enhanced conversions.
Answering the increase right after rollout with a raise can leave spend getting heavier while the rate of selling has not changed. What grew is the range of orders that make it into the count, and the orders themselves have not moved. The decision to raise spend is not wrong. It is only that the material behind the decision still has another kind of increase mixed into it.
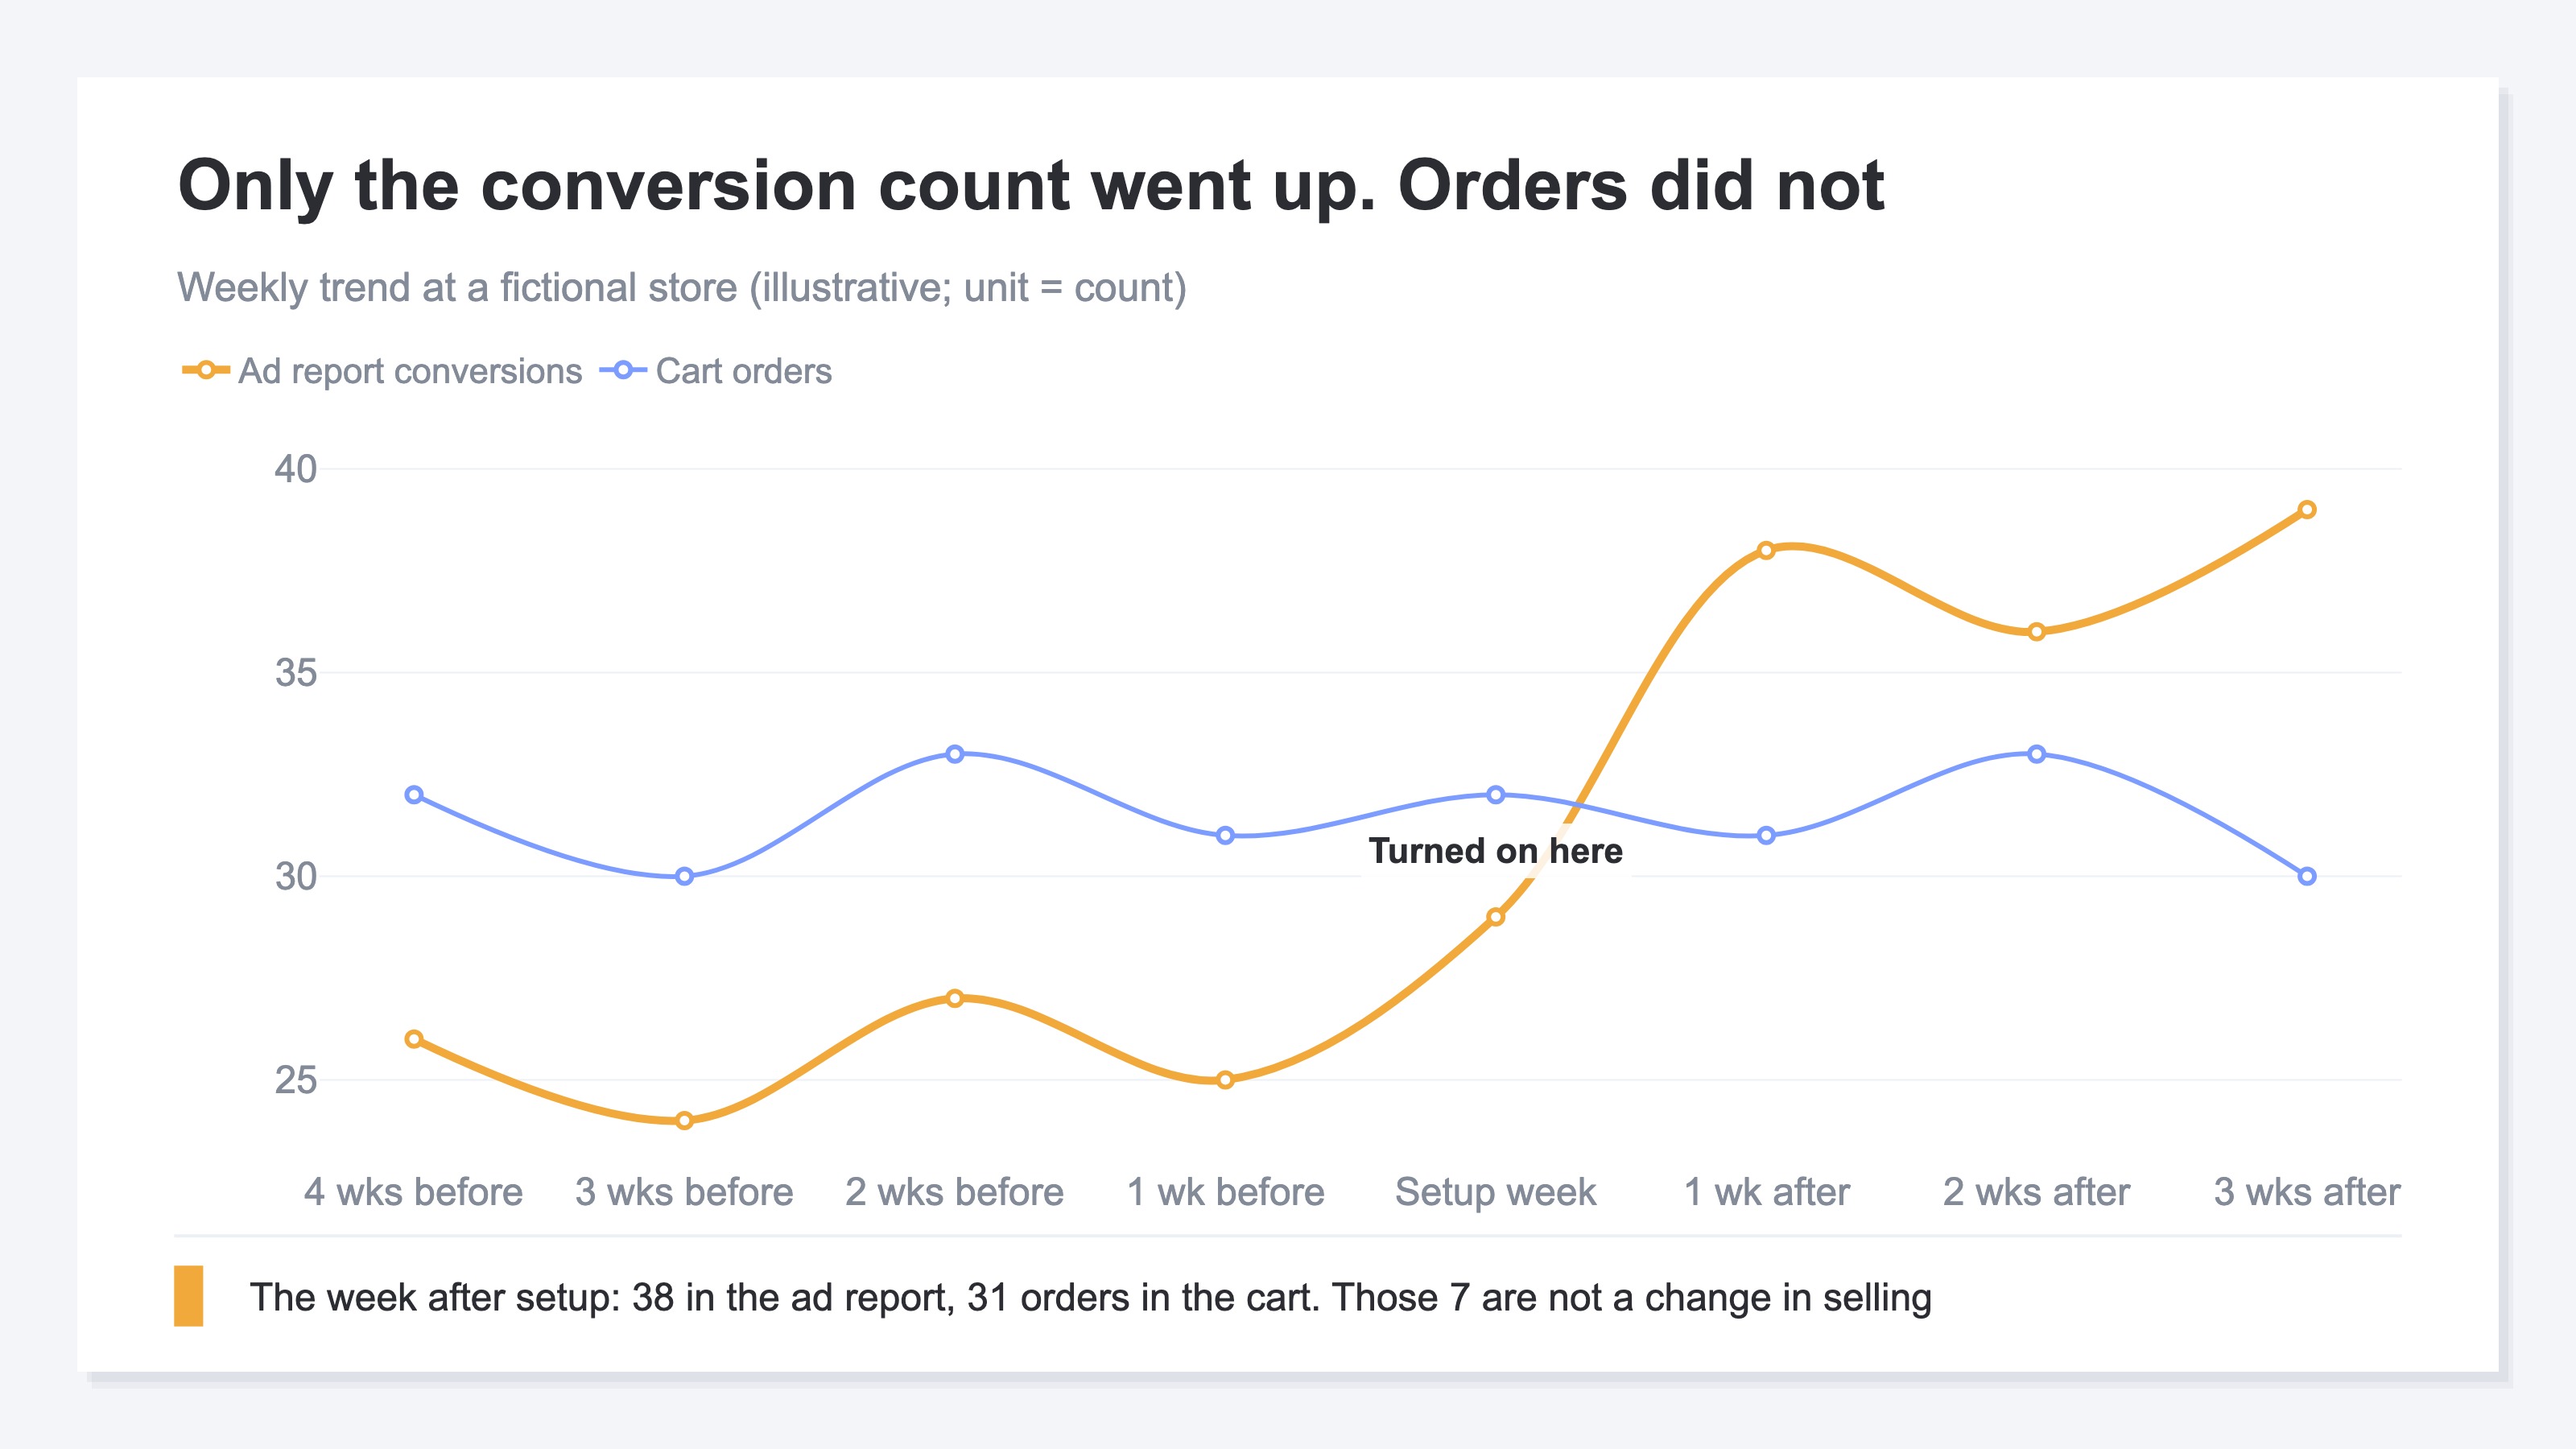
Above is a weekly trend at a fictional store. From the week of setup, only the conversion count line steps up a level. The order count line continues at about the same height, and the week after setup the two lines change places. A shape where the rate of selling has not changed yet one side alone grows is explained by looking at how enhanced conversions works.
The feature handles customer data that the site's tags capture at the moment of a conversion. Email addresses and the like are hashed with SHA256 and sent to Google[1]. The data sent is matched against signed-in Google accounts that engaged with the ads, and the result is reported as a conversion in the account[2]. Google describes this as supplementing existing conversion data, that is, filling in what was not there[1].
And the line placed first among the benefits is that it recovers conversions that otherwise wouldn't have been measured[2]. If nothing about how the store sells was changed before or after setup and only the numbers grew, this recovered volume is the first thing to suspect.
Three entry points are documented for setting it up: Google Tag Manager, the Google tag, and the Google Ads API. These three are being combined into a single on/off setting, and existing users will be migrated automatically[2]. Alongside that, it is written that from April 2026 Google Ads accepts user-provided data from all three routes[2]. Because the feature is light to introduce, the change right after rollout is easy to read as the result of a campaign.
Reports disagreeing with each other on amounts also comes up in GA4 revenue doesn't match the books.
2. Ad Report Conversions and Cart Orders Are Counted Differently#
For the same single week, the Google Ads interface can show 38 conversions while the cart's order list shows 31 orders. That gap of 7 is not a setup failure. The way one unit is made differs from the start.
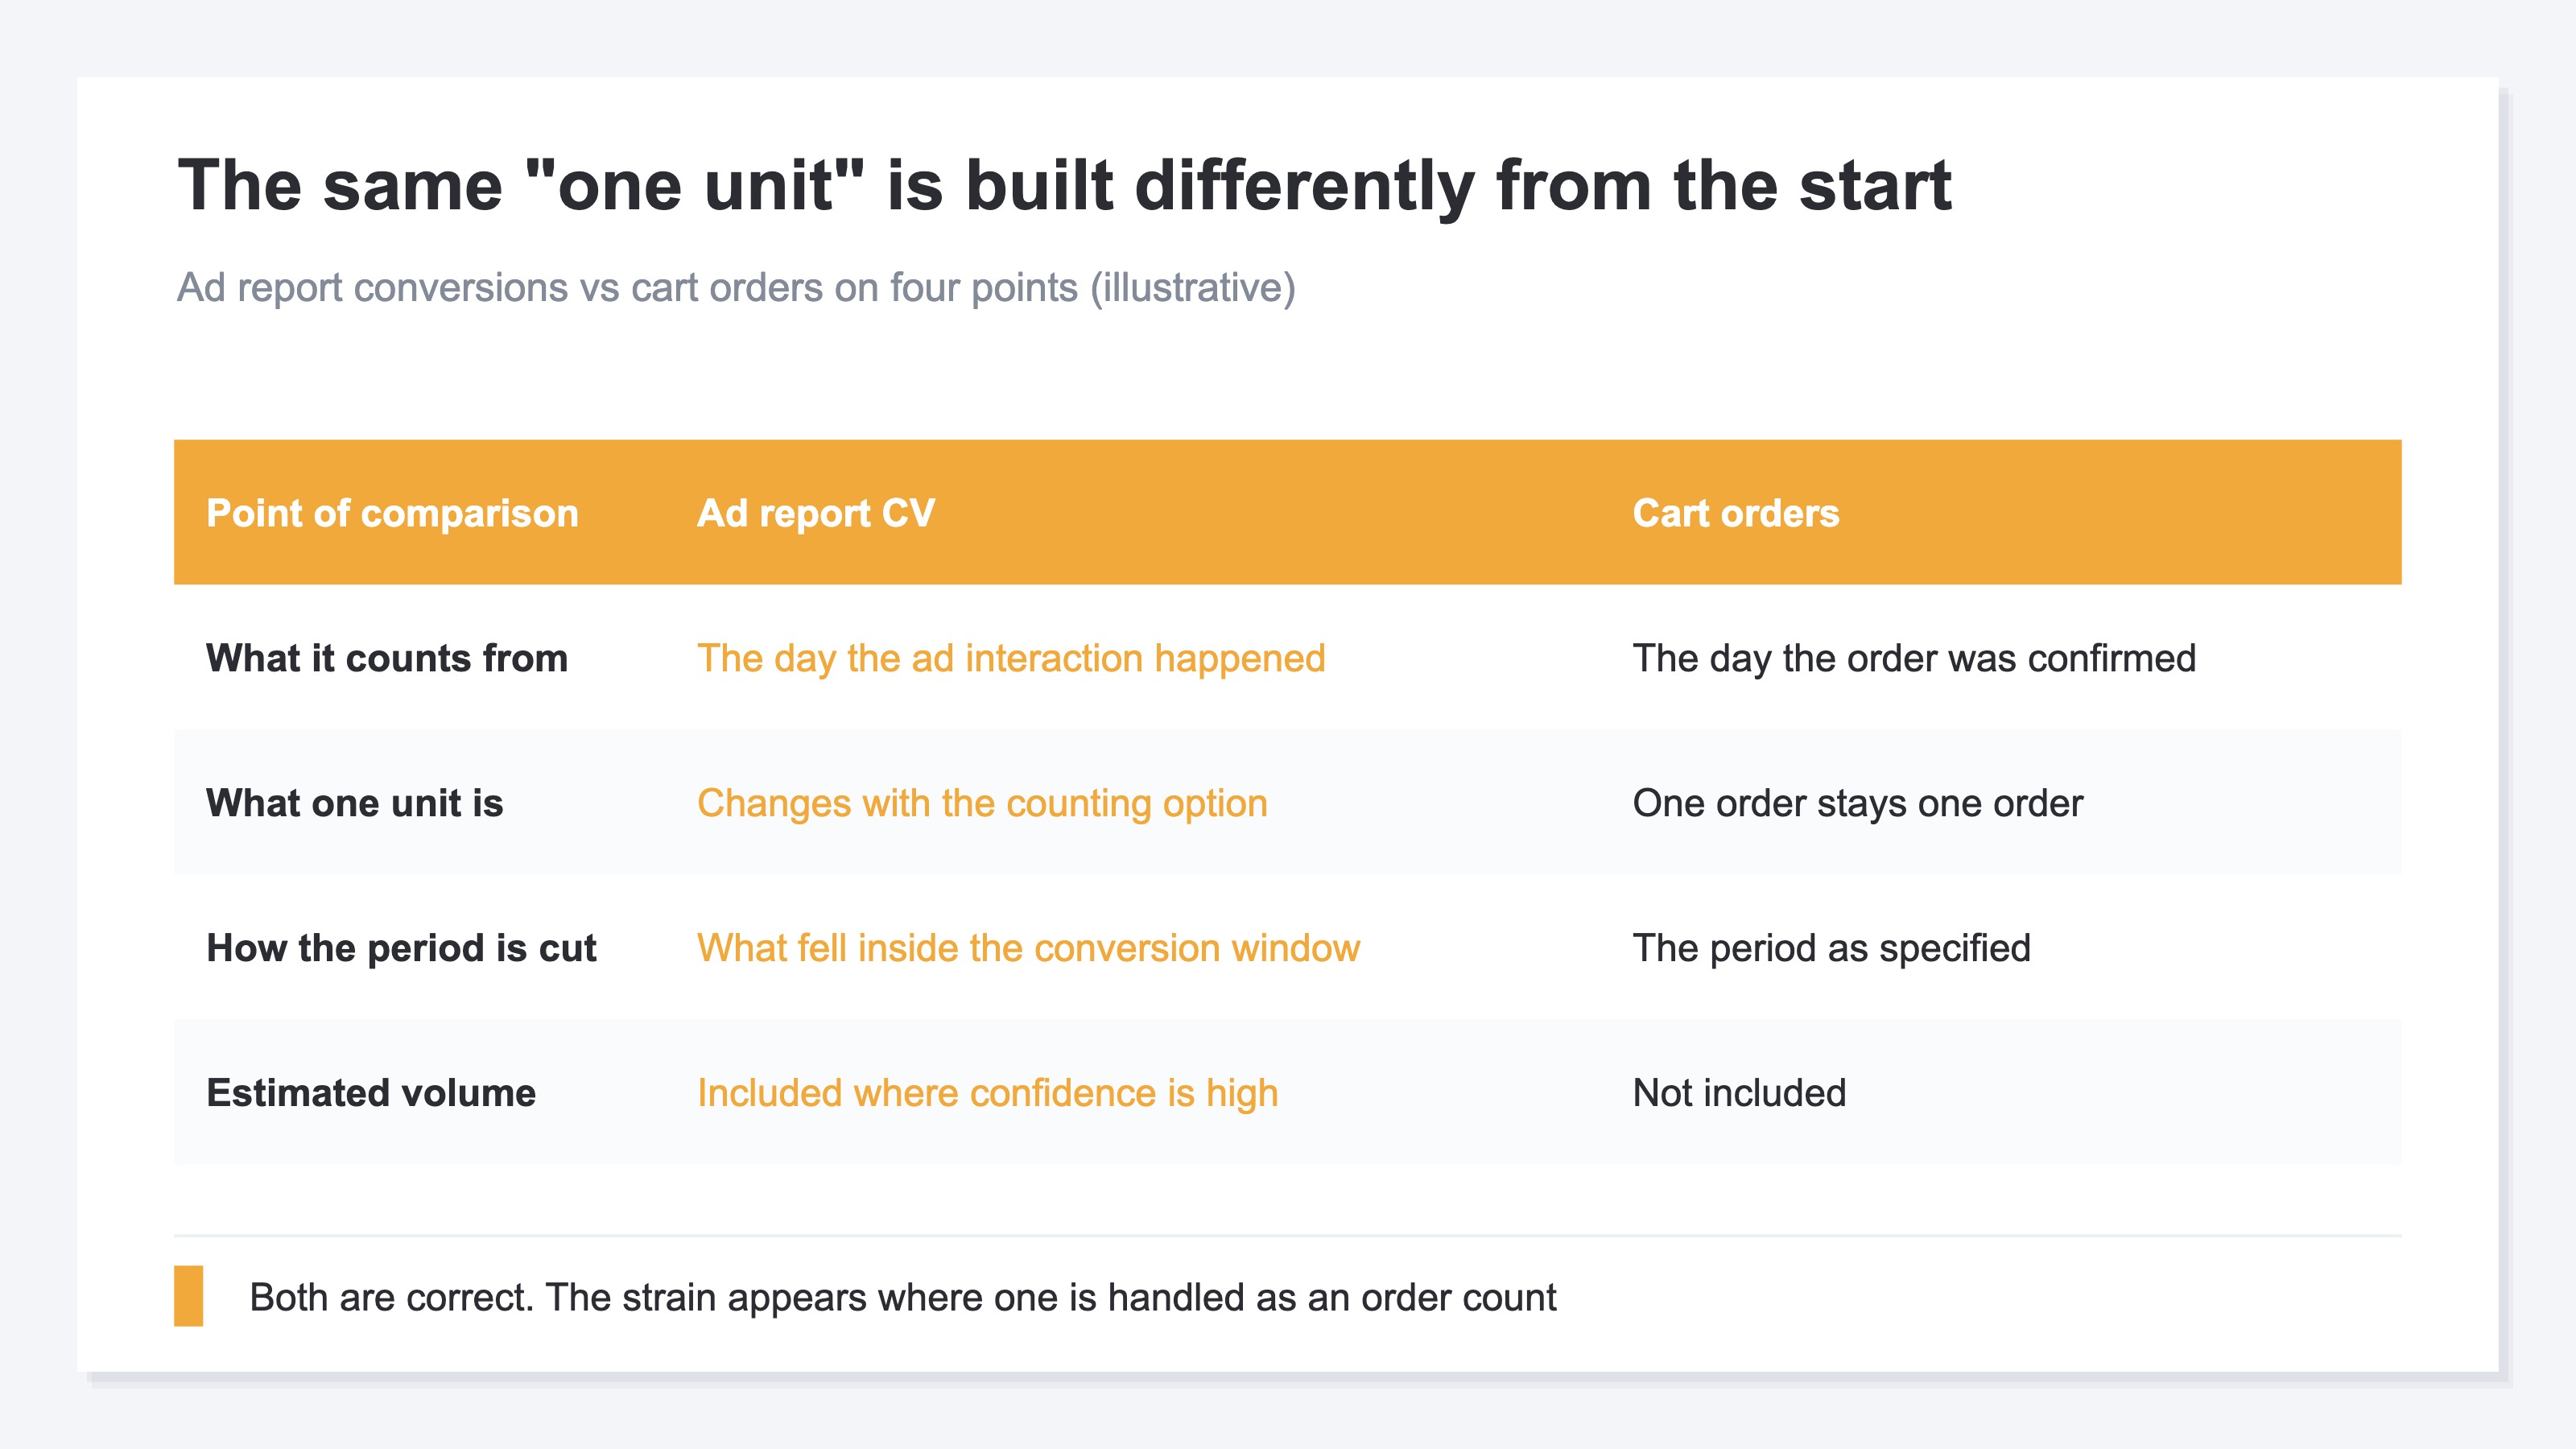
The differences show up in three places.
The starting point differs. A Google Ads conversion window is the period of time after an ad interaction during which a conversion, such as a purchase, is recorded in Google Ads[4]. An ad interaction here includes an ad click or a video view[4]. So one unit on the ad side is recorded tied to the event of touching the ad. One unit on the cart side remains as an order on the day the order was confirmed. The events they start from are separate, so cutting the same week out of both does not give you the same contents.
What counts as one unit changes with a setting too. For any conversion action, you can choose to count every conversion that happens after an ad interaction, or only one[5]. With every conversion, two purchases from a single click count as two. With one conversion, they count as one. The cart's order list holds the real number of orders regardless of that setting.
And what goes into the total is not only what could be observed. The reported conversion total includes conversions estimated by machine learning. That volume is included only where there is high confidence that the ad resulted in conversions[3].
None of which makes the ad report inferior. As a number to feed bidding optimization, it getting more accurate is the intended effect of enhanced conversions[2]. The strain appears only where you take something with a different unit granularity and a different period cut and handle it as an order count.
Misreading the scope of an interface happens across ad types. With Performance Max click surges too, starting from confirming the range you are looking at was the faster route.
3. Isolate the Increase Against Real Revenue From the Same Period#
Whether the increase is volume that came back into the record or volume that actually sold becomes visible once you line it up against real revenue from the same period.
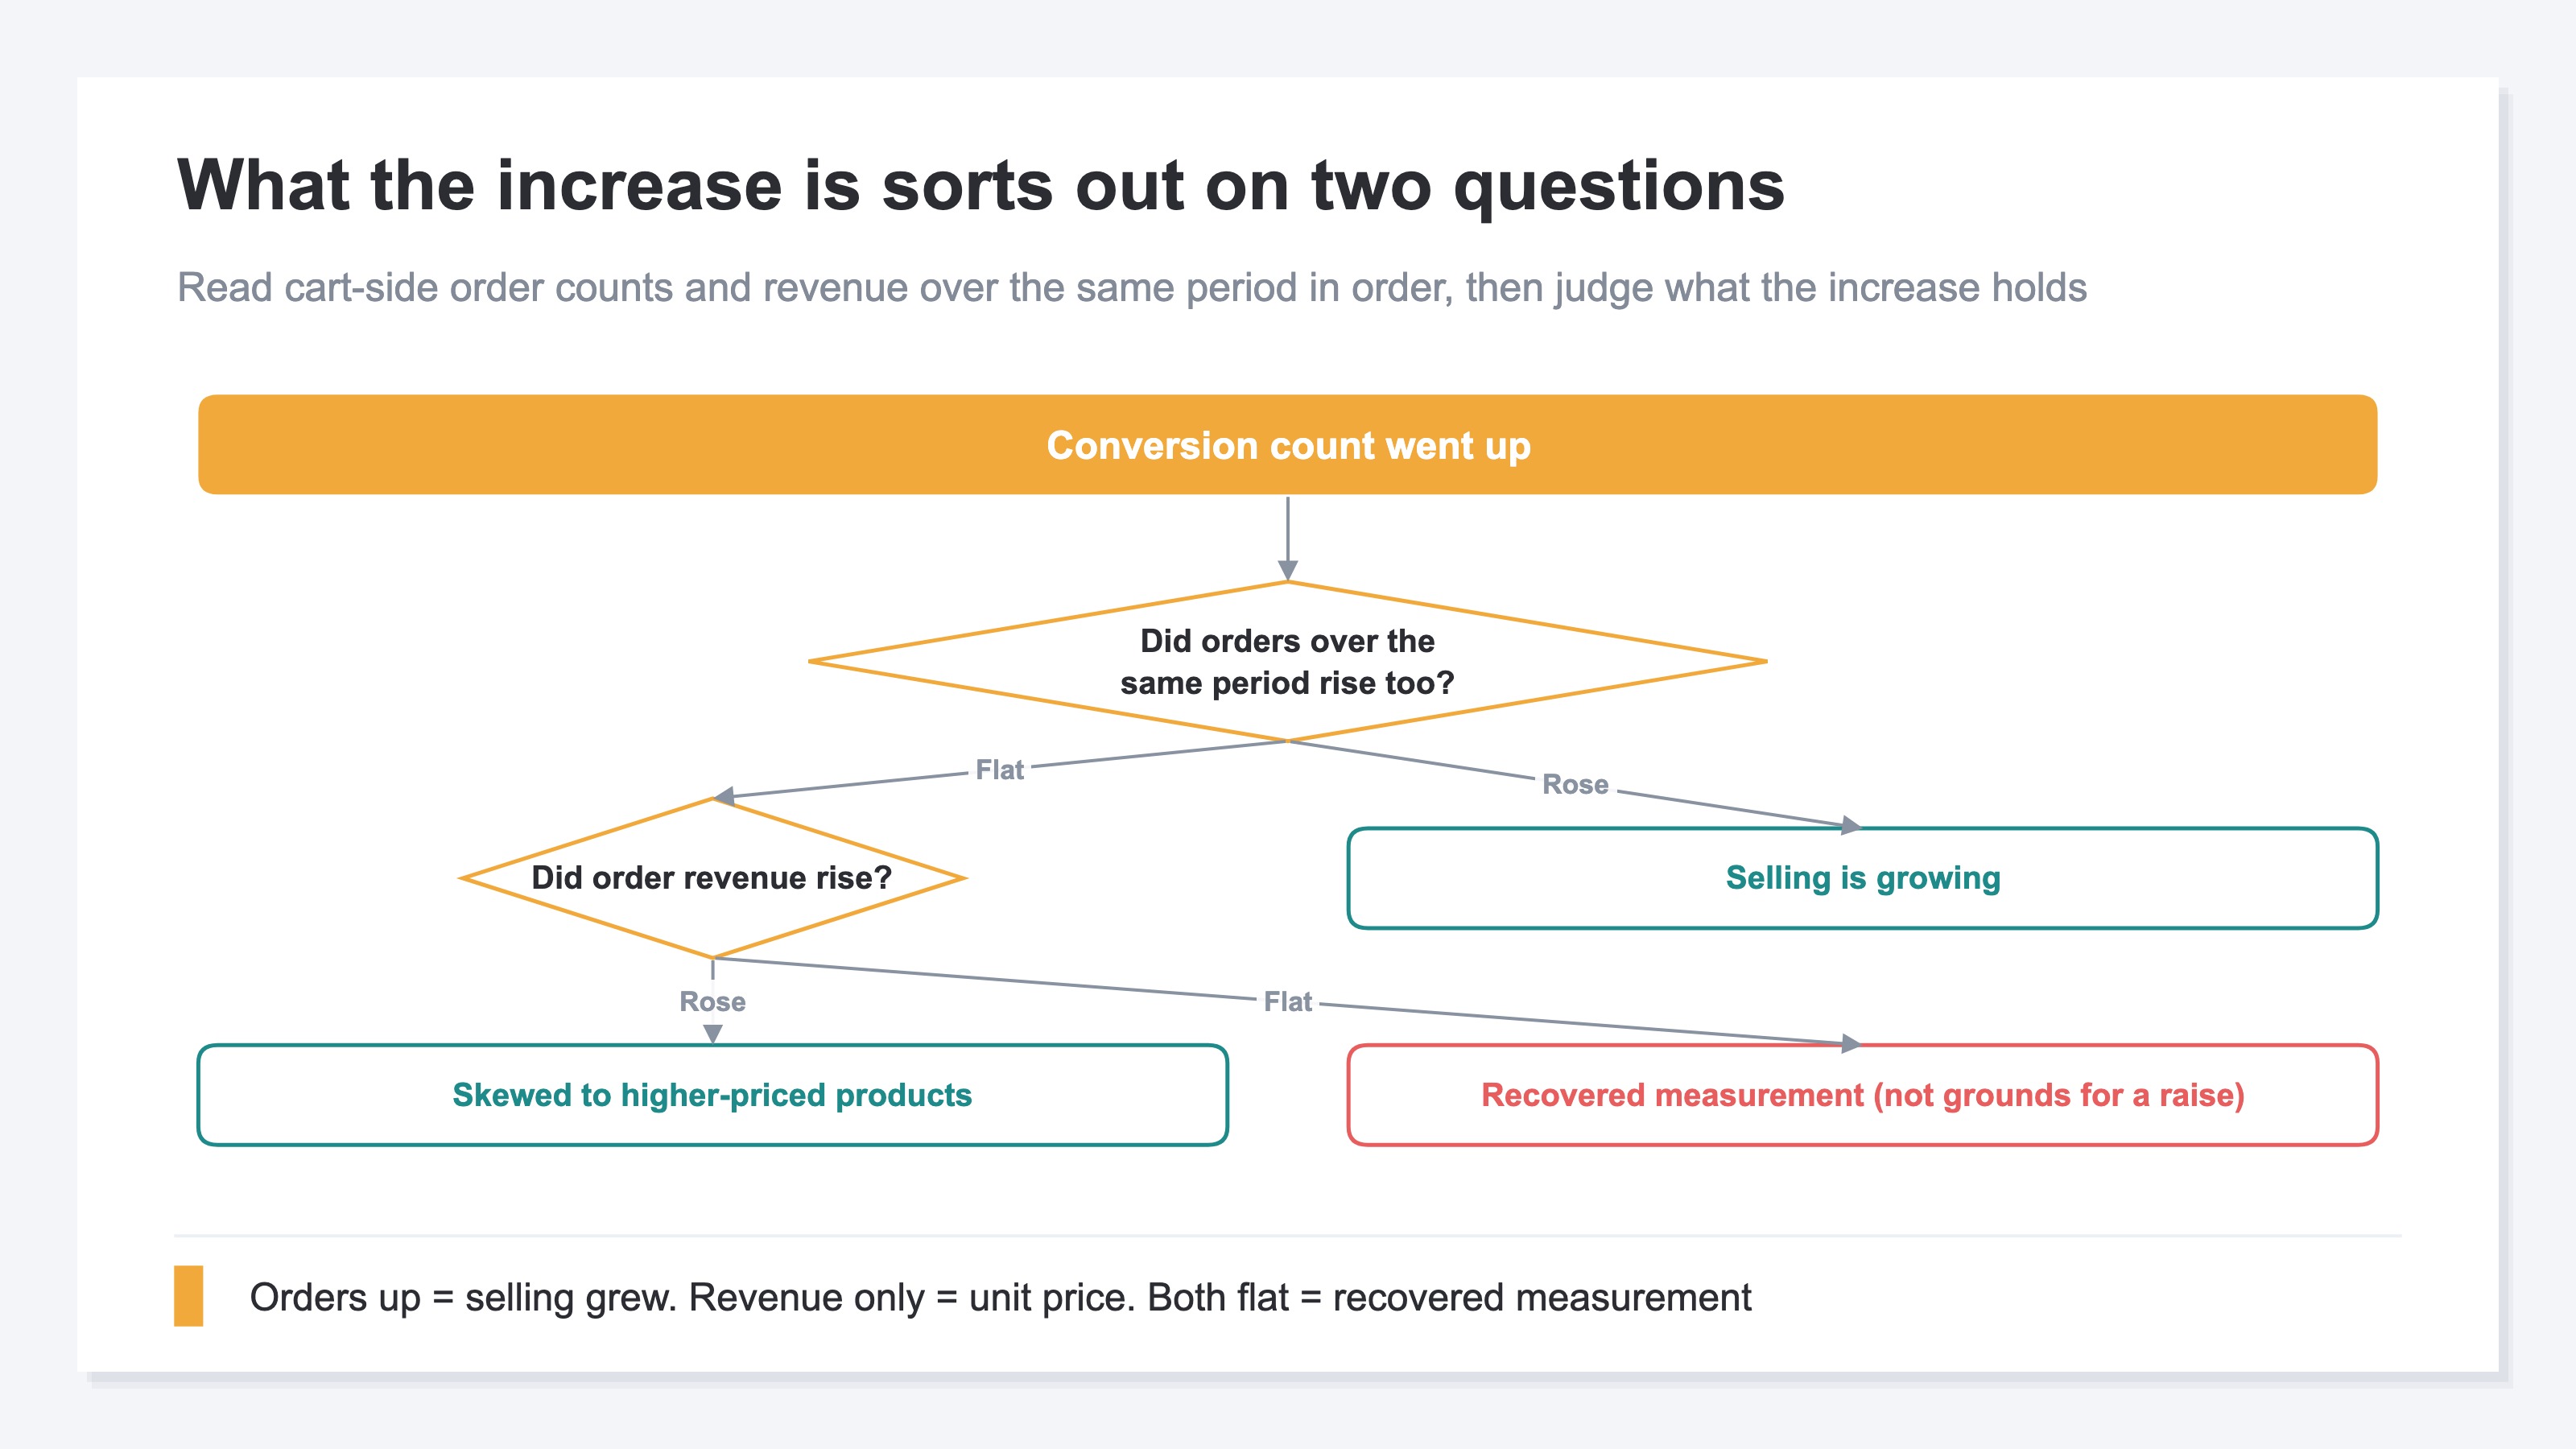
What you check is the cart-side order count and revenue across the week you turned it on. If those rose the same way, the rate of selling itself has grown. If the conversion count alone rose while orders and revenue stay at the same height, the increase reads as volume that came back into the count.
There are conditions on how you take the periods you compare. Take periods of the same length before and after the day of setup, and drop the most recent few days. The conversion window for conversions that happen after an ad click, called click-through conversions, is 30 days by default unless you customize it at creation[4]. The week right after setup is aggregated while it still holds ad interactions that have not finished being recorded, so concluding from that week alone misreads the size of the increase.
Look at amounts, not counts alone. If counts are flat and revenue alone rose, it may be no more than a skew toward higher-priced products. If you are judging return against ad spend, fixing the numerator on revenue you measured yourself leaves a value that means the same thing from month to month.
This isolation needs several weeks of order data spanning the week of setup. The deadline for deciding next month's allocation arrives before those weeks are in. The days to a decision are fewer than the days the isolation needs. That gap is why the case for raising spend is the only part that moves ahead.
RevenueScope solution
Fix the revenue you judge with to a single definition and this isolation finishes without spilling into the next month. What RevenueScope aggregates is measured revenue, received by the site's tag at the moment a purchase happens. Ask an AI and the answer comes back as a single table per channel holding that measured revenue, ad spend, and the conversion count the platform reported. Platform-reported CV lands only on the rows for channels whose platform-side data has been imported. Rows where only ad spend was imported have no data coming from the platform, so they sit at 0.
For example, ask an AI assistant such as ChatGPT over MCP "What is ad spend and ROAS by channel for the last 30 days?" and it comes back in the following form. ROAS (return on ad spend) is the multiple of revenue recovered per ¥1 of ad spend.
| Channel | Ad spend | Platform-reported CV | RS-measured revenue | ROAS |
|---|---|---|---|---|
| Google Ads | ¥600,000 | 220 | ¥1,800,000 | 3.0x |
| Meta | ¥400,000 | 150 | ¥800,000 | 2.0x |
| TikTok Ads | ¥50,000 | 8 | ¥250,000 | 5.0x |
Note: what to take away is the shape of the cross-check rather than the amounts themselves. The three rows above are a worked example rounded for fictional store K, and the demo screen the link opens aggregates the sample store's sample data (refreshed daily), so the lineup of channels and the amounts there are both different.
Platform-reported CV is a column that passes through the count the Google Ads or Meta interface reported, as it stands. It is not a result RevenueScope measured. Next to it, RS-measured revenue is revenue the site's tag received at the moment of purchase, and it comes from a separate source. The numerator of ROAS is fixed on that RS-measured revenue, so it does not agree with the ROAS shown in the platform's interface. It is because they do not agree that the two sources can be held side by side in one table.
TikTok Ads leads on ROAS. At this size, though, a few large orders are enough to make ¥250,000 of revenue on ¥50,000 of ad spend. The same multiple will not necessarily show up next month, so it comes off the list for a spend increase first. The remaining Google Ads and Meta sit at 3.0x and 2.0x, and both carry enough ad spend to hold up a decision. Next month's allocation is decided in the order of those multiples, not by the growth in conversion counts.
FAQ#
Frequently asked questions#
Q. How much does the conversion count go up when I turn on enhanced conversions?
A. There is no official figure for the size of the increase, and what the increase is made of differs store by store. What can be confirmed officially is that recovering conversions that otherwise wouldn't have been measured is stated as a benefit[2]. The feature itself is described as supplementing existing conversion data[1]. Measure the increase on your own site by taking periods of the same length across the week you turned it on and matching them against cart-side order counts.
Q. The conversion count went up but real revenue did not move. Does that mean enhanced conversions were configured incorrectly?
A. A conversion-only increase does not by itself point to a configuration error. If only the recovered volume went up, real revenue stays as it was while the measurement alone gets more accurate. That is the expected behavior. Note that changing the counting option to every conversion produces the same appearance right afterward[5]. Check whether any other change went into the settings history.
Q. Can I report the conversion count in the ad report as our internal order count?
A. Handle them as separate numbers. The ad side is recorded inside a conversion window that starts from an ad interaction[4], the way one unit is made changes with the counting option[5], and the total also holds estimated volume[3]. Note the source in one line — the cart-side real number when reporting order counts, the ad report when reporting how the ads are working — and whoever reads it later can match them up without confusion.
Q. If the size of the increase can't be read, is it better not to turn enhanced conversions on?
A. Turn it on. Google itself lists better data for bidding optimization as a benefit[2], and describes the feature as handling first-party customer data in a privacy-safe way through hashing[1]. Leave the setting as it is and change only how you read the numbers that went up.
Summary#
If the conversion count went up after you turned on enhanced conversions, that is the result of measurement getting more accurate. What Google lists first among the benefits was recovering conversions that otherwise wouldn't have been measured[2]. The decision to introduce it was right, and all that changes is how you read it.
When it comes time to decide, assigning each of the two data sources a role keeps you from hesitating. Conversions in the ad report are there to see how bidding and delivery are working. They are recorded inside a conversion window that starts from an ad interaction, and the default conversion window for click-through conversions is 30 days[4]. Cart-side orders and revenue are there to settle how much you earned. Tune the ad operation with the former, decide the total budget and its allocation with the latter. Once that line is drawn, the move to check one side when the other goes up comes out naturally.
The day you decide next month's allocation arrives before you know what the increase was made of. On the day you see the conversion count go up, can you also open the cart-side orders and revenue for the same period?
See which ads actually drive revenue, at a glance
Free up to 5,000 sessions/month, AI connection included. No credit card required. Up and running in 5 minutes.