Display ads alone are producing more conversions, yet your own revenue hasn't grown by anything like that much. The cause lies in how far the touchpoints counted inside that number reach. This article lays out what changes when you measure with clicks only.
Contents
TL;DR#
- Display conversions include purchases by people who only had the ad displayed to them and never clicked it (view-through)
- What gets included is decided by the platform and the settings, so it may not apply to the number you have open right now
1. Display Shows More Conversions Because the Touchpoints Counted Differ#
Display ads alone produce more conversions because the touchpoints counted inside that number differ from the ones counted for the other ad types.
In the ad platform's interface, display conversions run close to twice what search ads report.
Opinion splits in two here. Trust the result and raise the budget, or treat it as inflated and stop it. Both stall at the same place, where nobody can settle how much to change.
What is included is the view-through conversion. It is a count that records, as a result, a purchase by someone who only had the ad displayed to them and never clicked it[1].
Which number it lands in is decided by the platform and the settings. In Google Ads, view-through conversions are not inside the number labelled "Conversions" on screen. They land in only two: "View-through conversions" and "All conversions"[1]. So if you are looking at the "Conversions" number and display is the one swelling, view-through is not the cause. It applies when you are looking at "All conversions", or on a platform like Meta where the setting decides whether it counts.
Meta's standard attribution setting carries both click-through and view-through, and results are included according to the setting you chose[2]. Click-through is a purchase by someone who clicked.
The reason this ratio grows on display is that the click rate is low compared with search ads while impressions run orders of magnitude higher.
The platform is not recording more on purpose. Conversion measurement is a mechanism that records from the point of contact with that platform's ad onward[3].
Meta's Advantage+: how the results come to look bigger handles the same mechanism narrowed to Meta alone. This article stays platform-agnostic and carries through to deciding next month's allocation. A CV count in the ad interface that doesn't agree with GA4 is a separate factor (Ad vs GA4 CV count mismatch: don't match them, judge by real revenue).
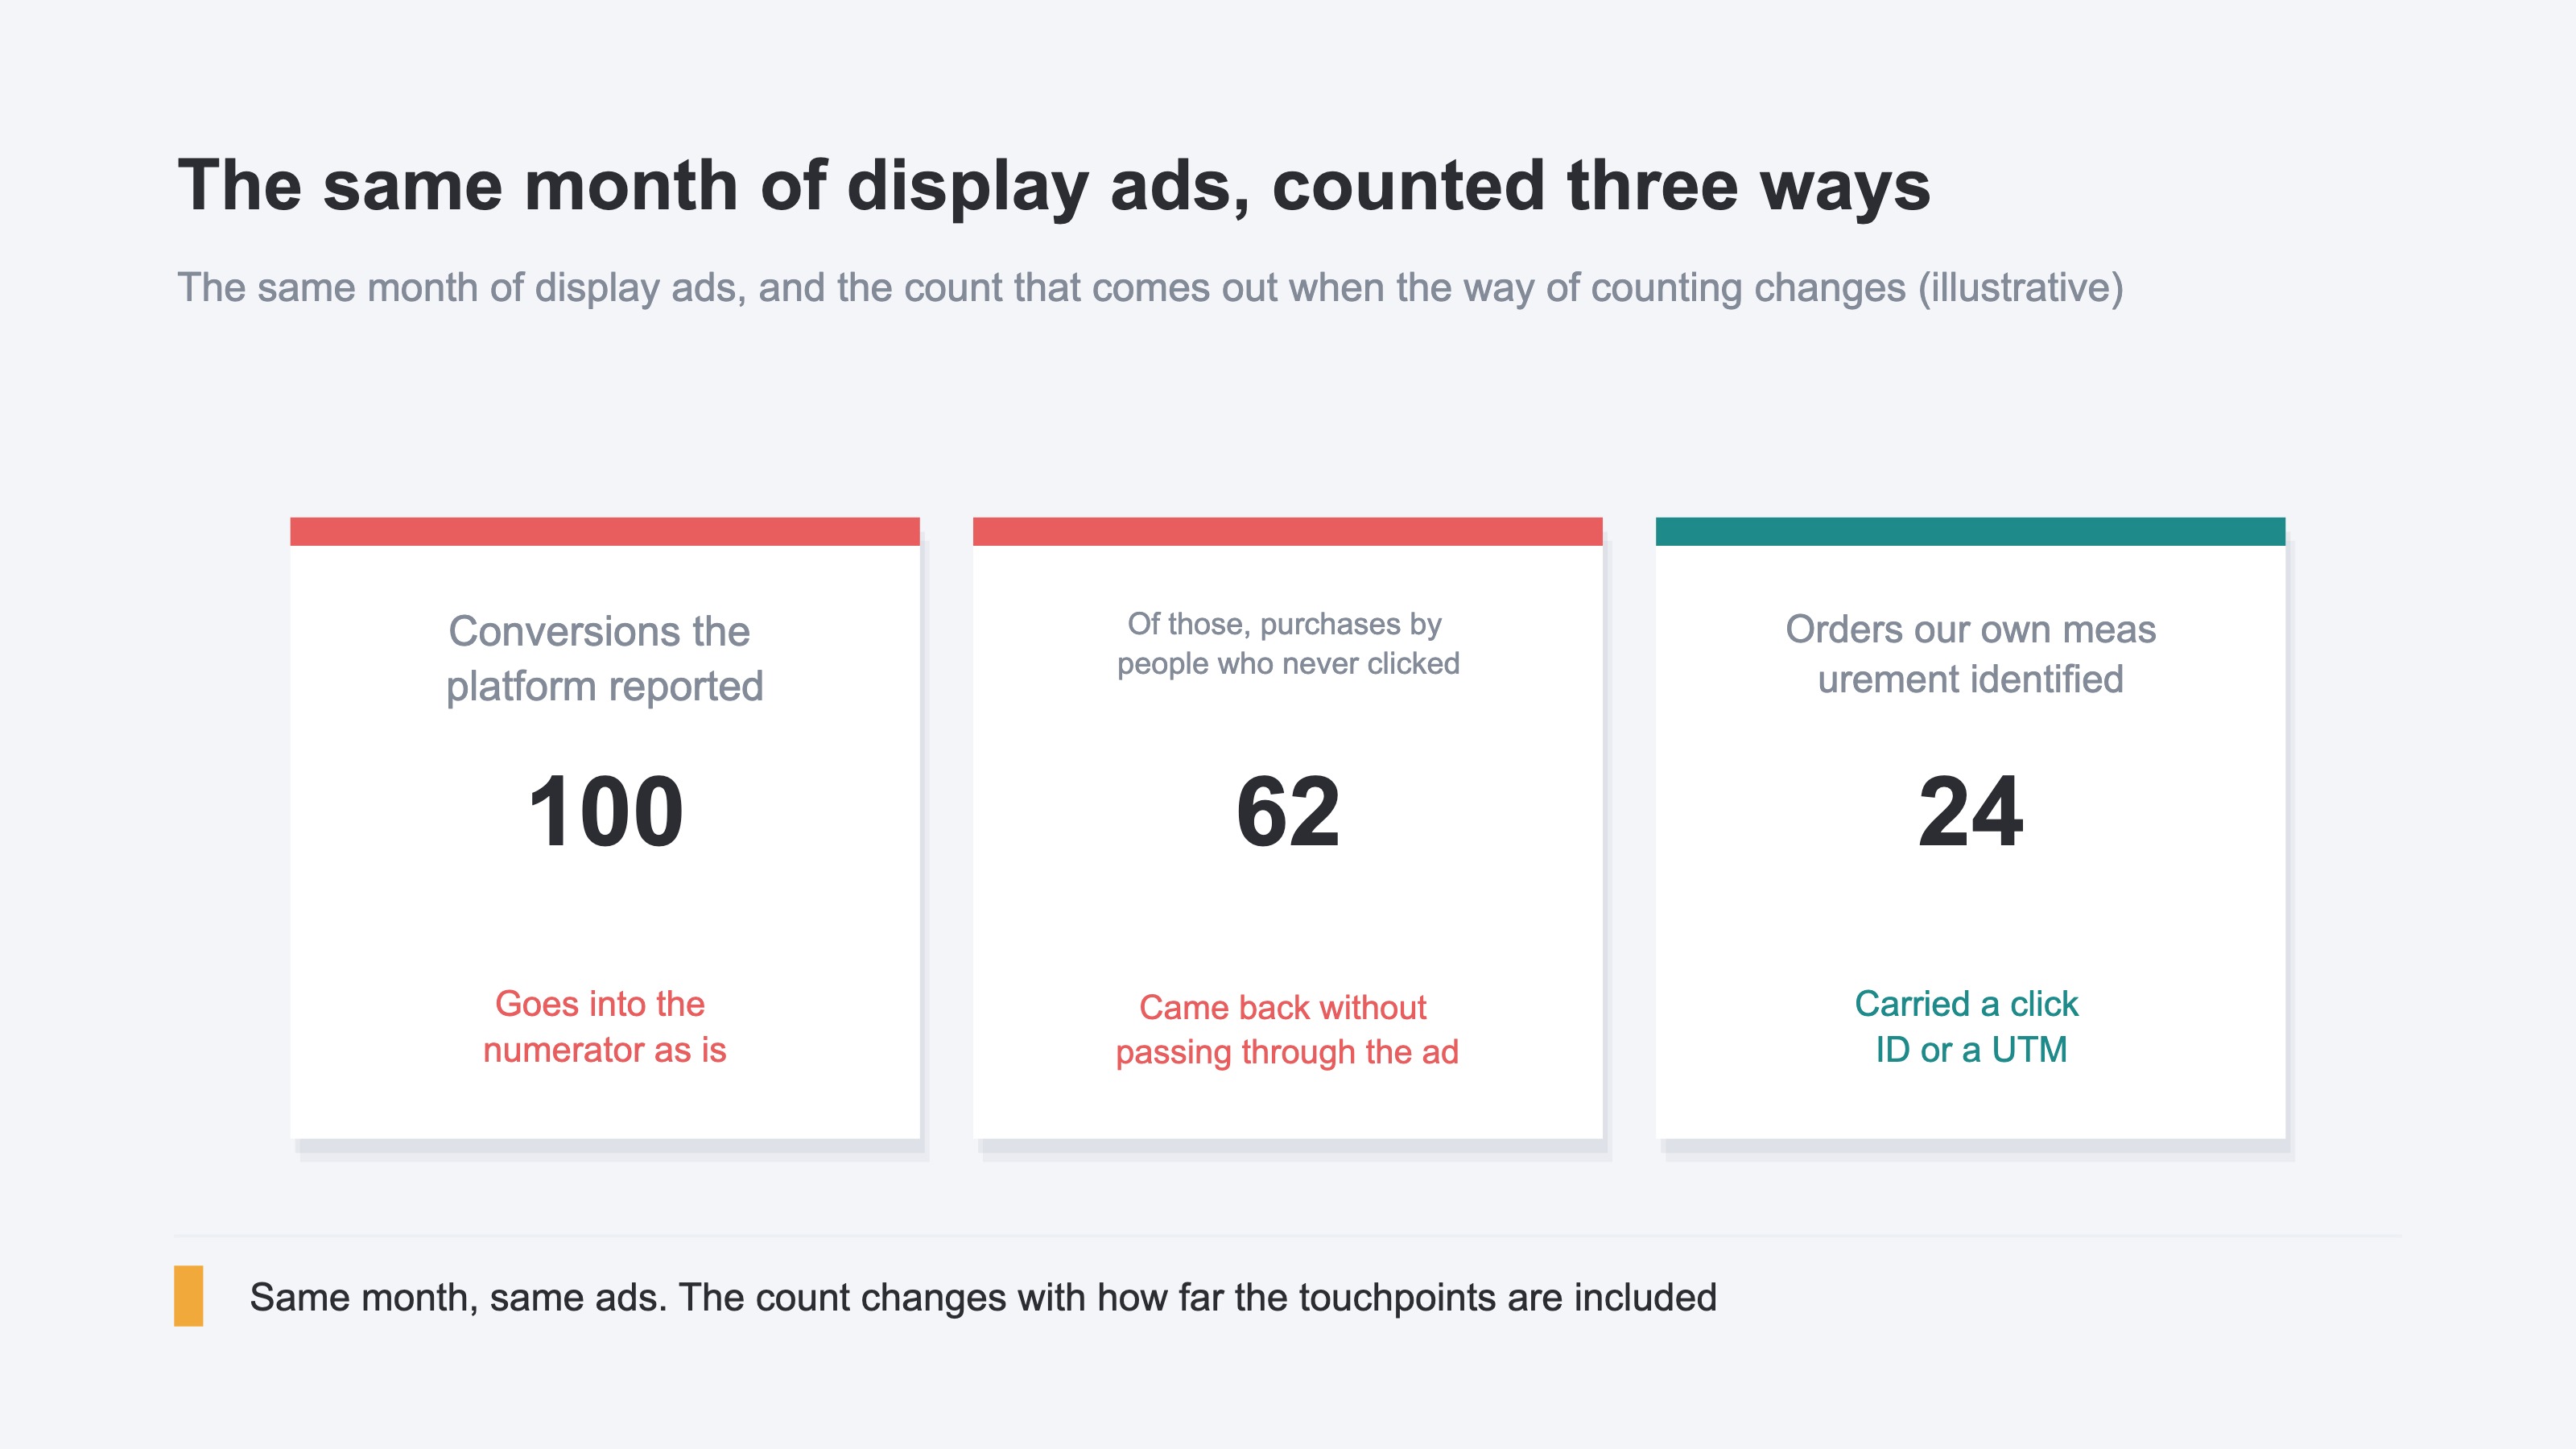
The third figure, 24 orders, is the set of orders that could be identified as display-originated from the UTM, the click ID and the referrer the measurement tag received.
2. How Far ROAS Drops When You Measure With Clicks Only#
Take the impression-originated portion out of the numerator and the same campaign's ROAS becomes a different value.
ROAS is the metric for how many times over the ad spend came back as revenue. The denominator is fixed at ad spend, so what sets the value is the numerator. In the calculation below, a view-through purchase and a click purchase are treated as carrying the same revenue per order.
Every conversion the platform reported    100 → ROAS 3.9x
Conversions from people who clicked        38 → 3.9 × 38 ÷ 100 = 1.5x
Orders our own measurement identified      24 → 3.9 × 24 ÷ 100 = 0.9x
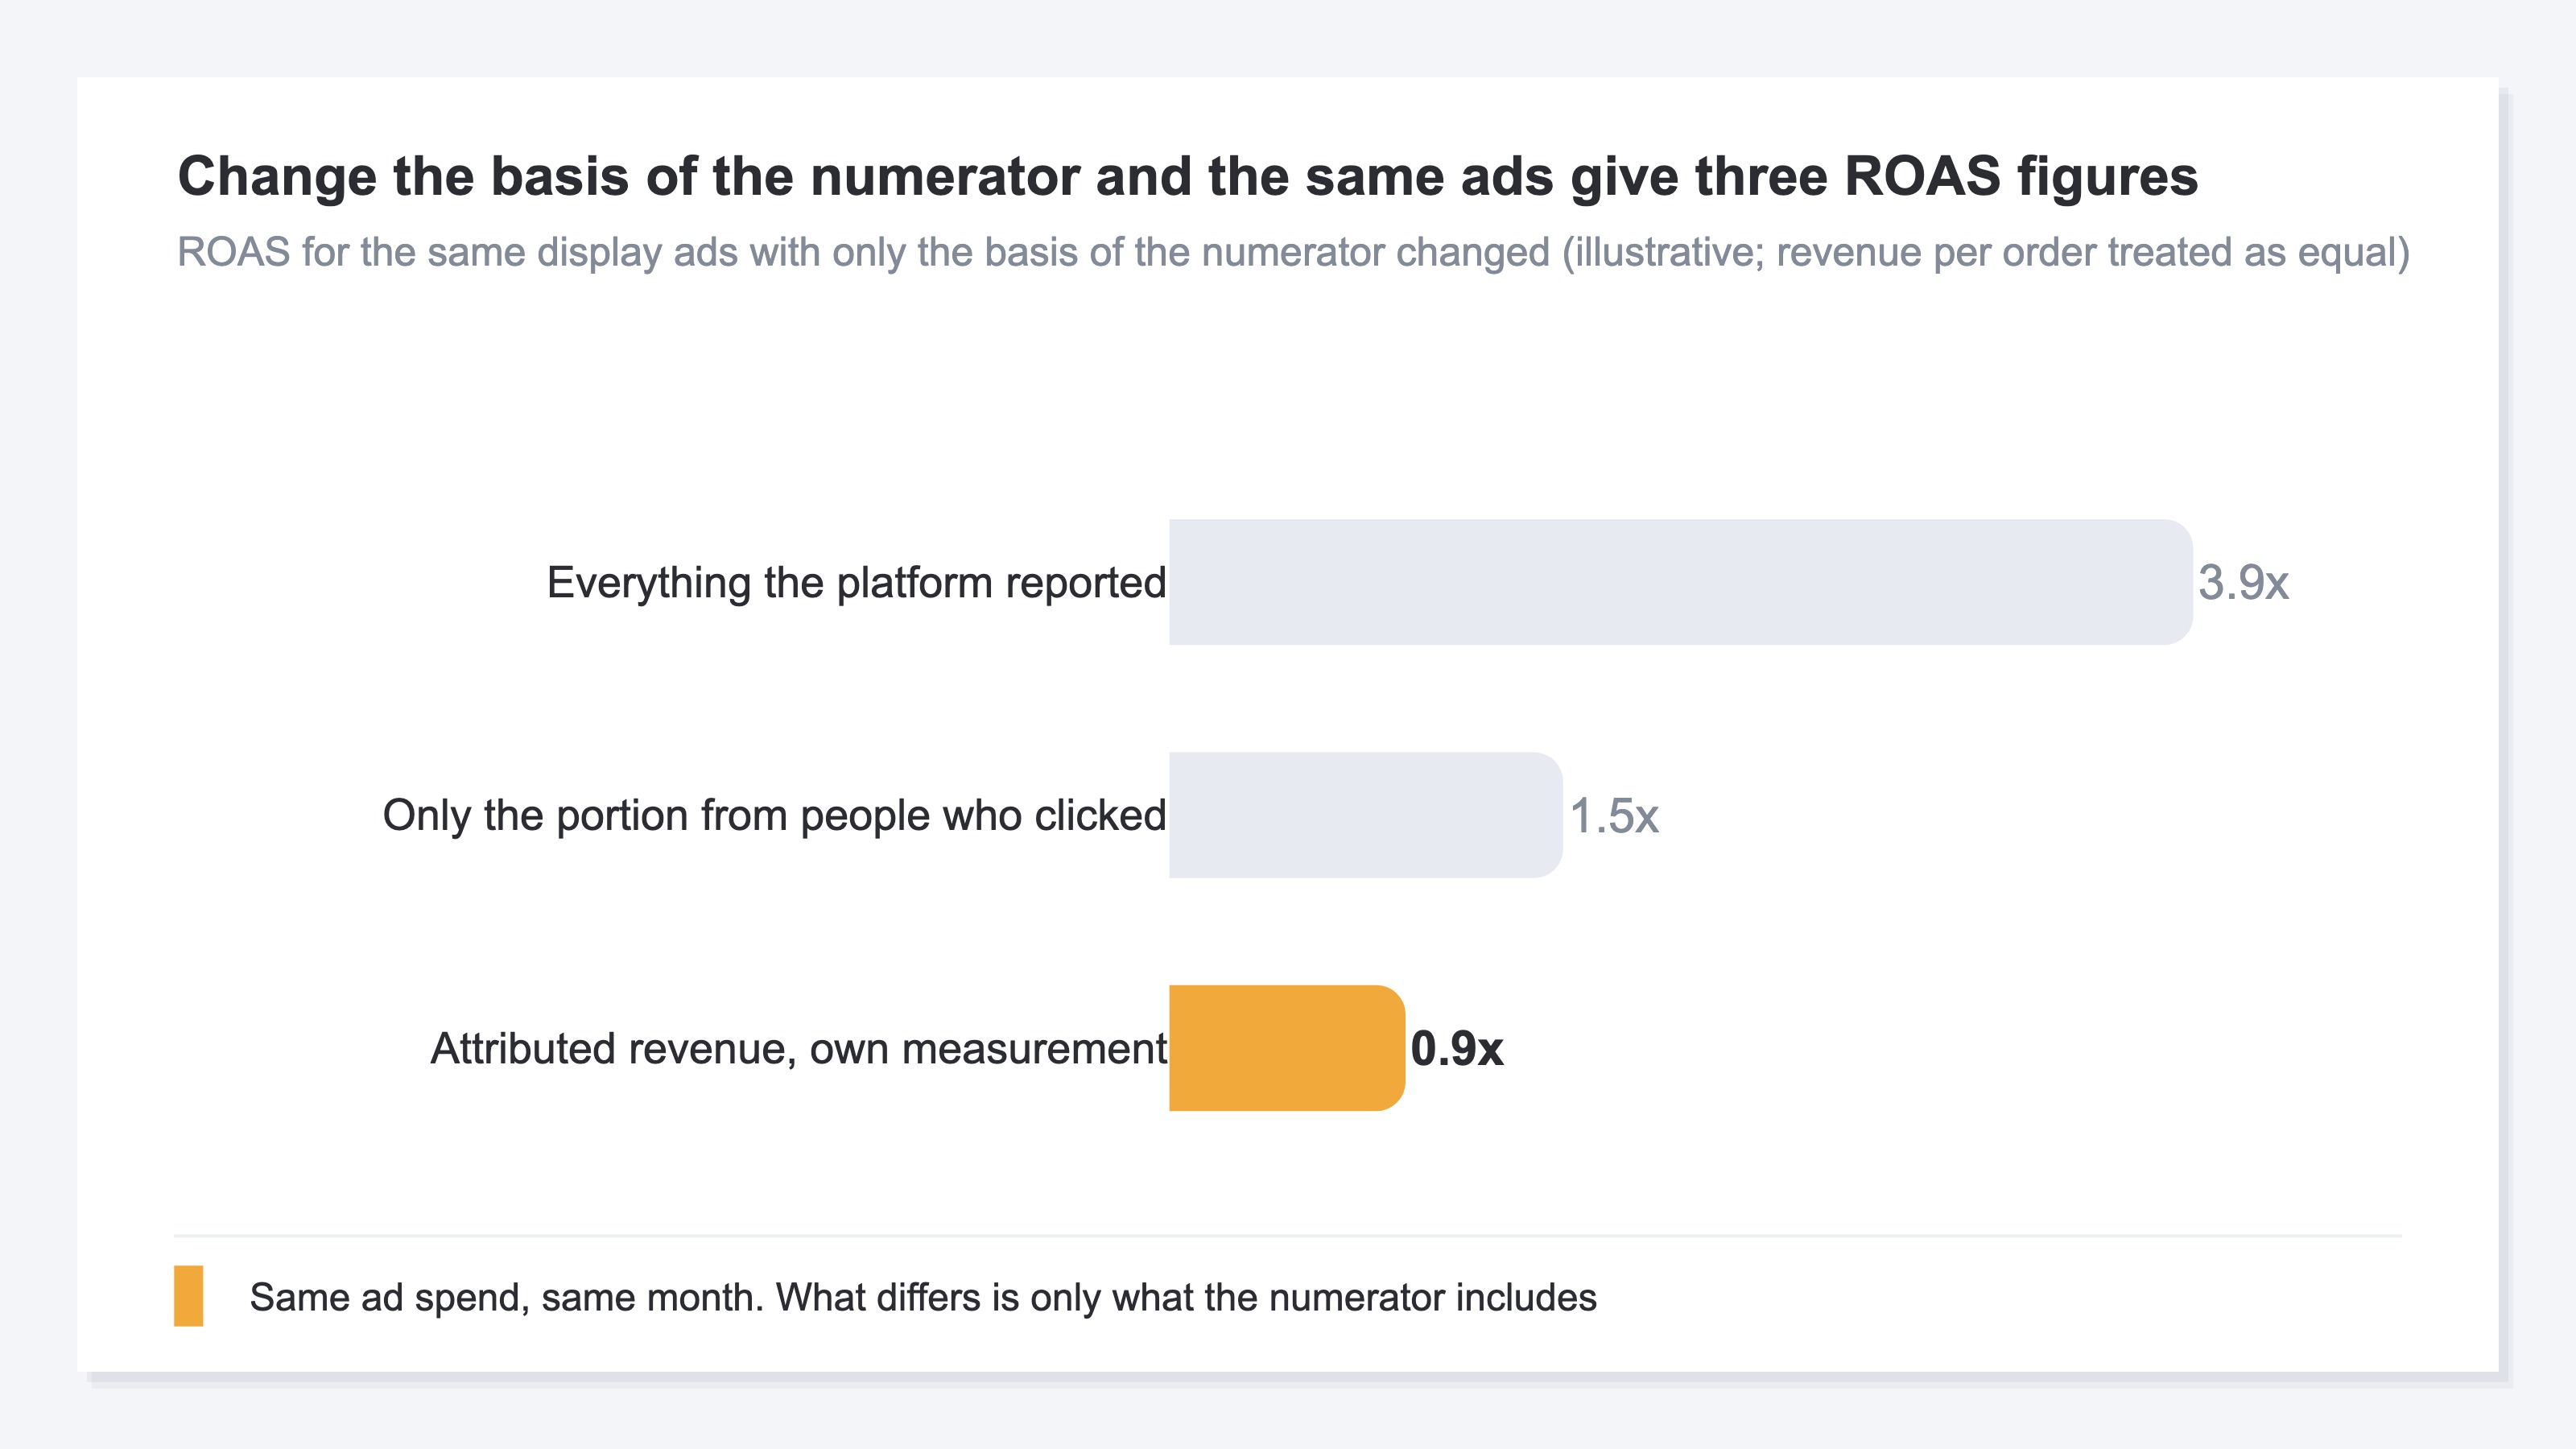
3.9x and 0.9x come from the same ad spend over the same month. The only difference is what goes into the numerator.
There is a path inside the ad platform's own interface to check the people who clicked separately from the people who only saw the ad. The names of the categories and the windows over which they are recorded differ by platform, though. In Google Ads, how many days a view-through looks back is set per conversion action[4]. Whether every conversion after a single ad contact is recorded, or only one of them, also changes with the setting[5]. Cross platforms and they stop being numbers that mean the same thing.
That three different things go by the name ROAS is laid out in Three kinds of ROAS: which one should drive your budget?. The overlap where several platforms each report the same order is a separate mechanism (Retargeting ROAS is the only high one: is it repeat purchases added in?).
3. The Same ROAS Doesn't Mean the Same Place to Add Budget#
Looked at by delivery type, the platform-reported ROAS puts the top two at almost the same value.
Take fictional Store D's display ads and open them by delivery type.
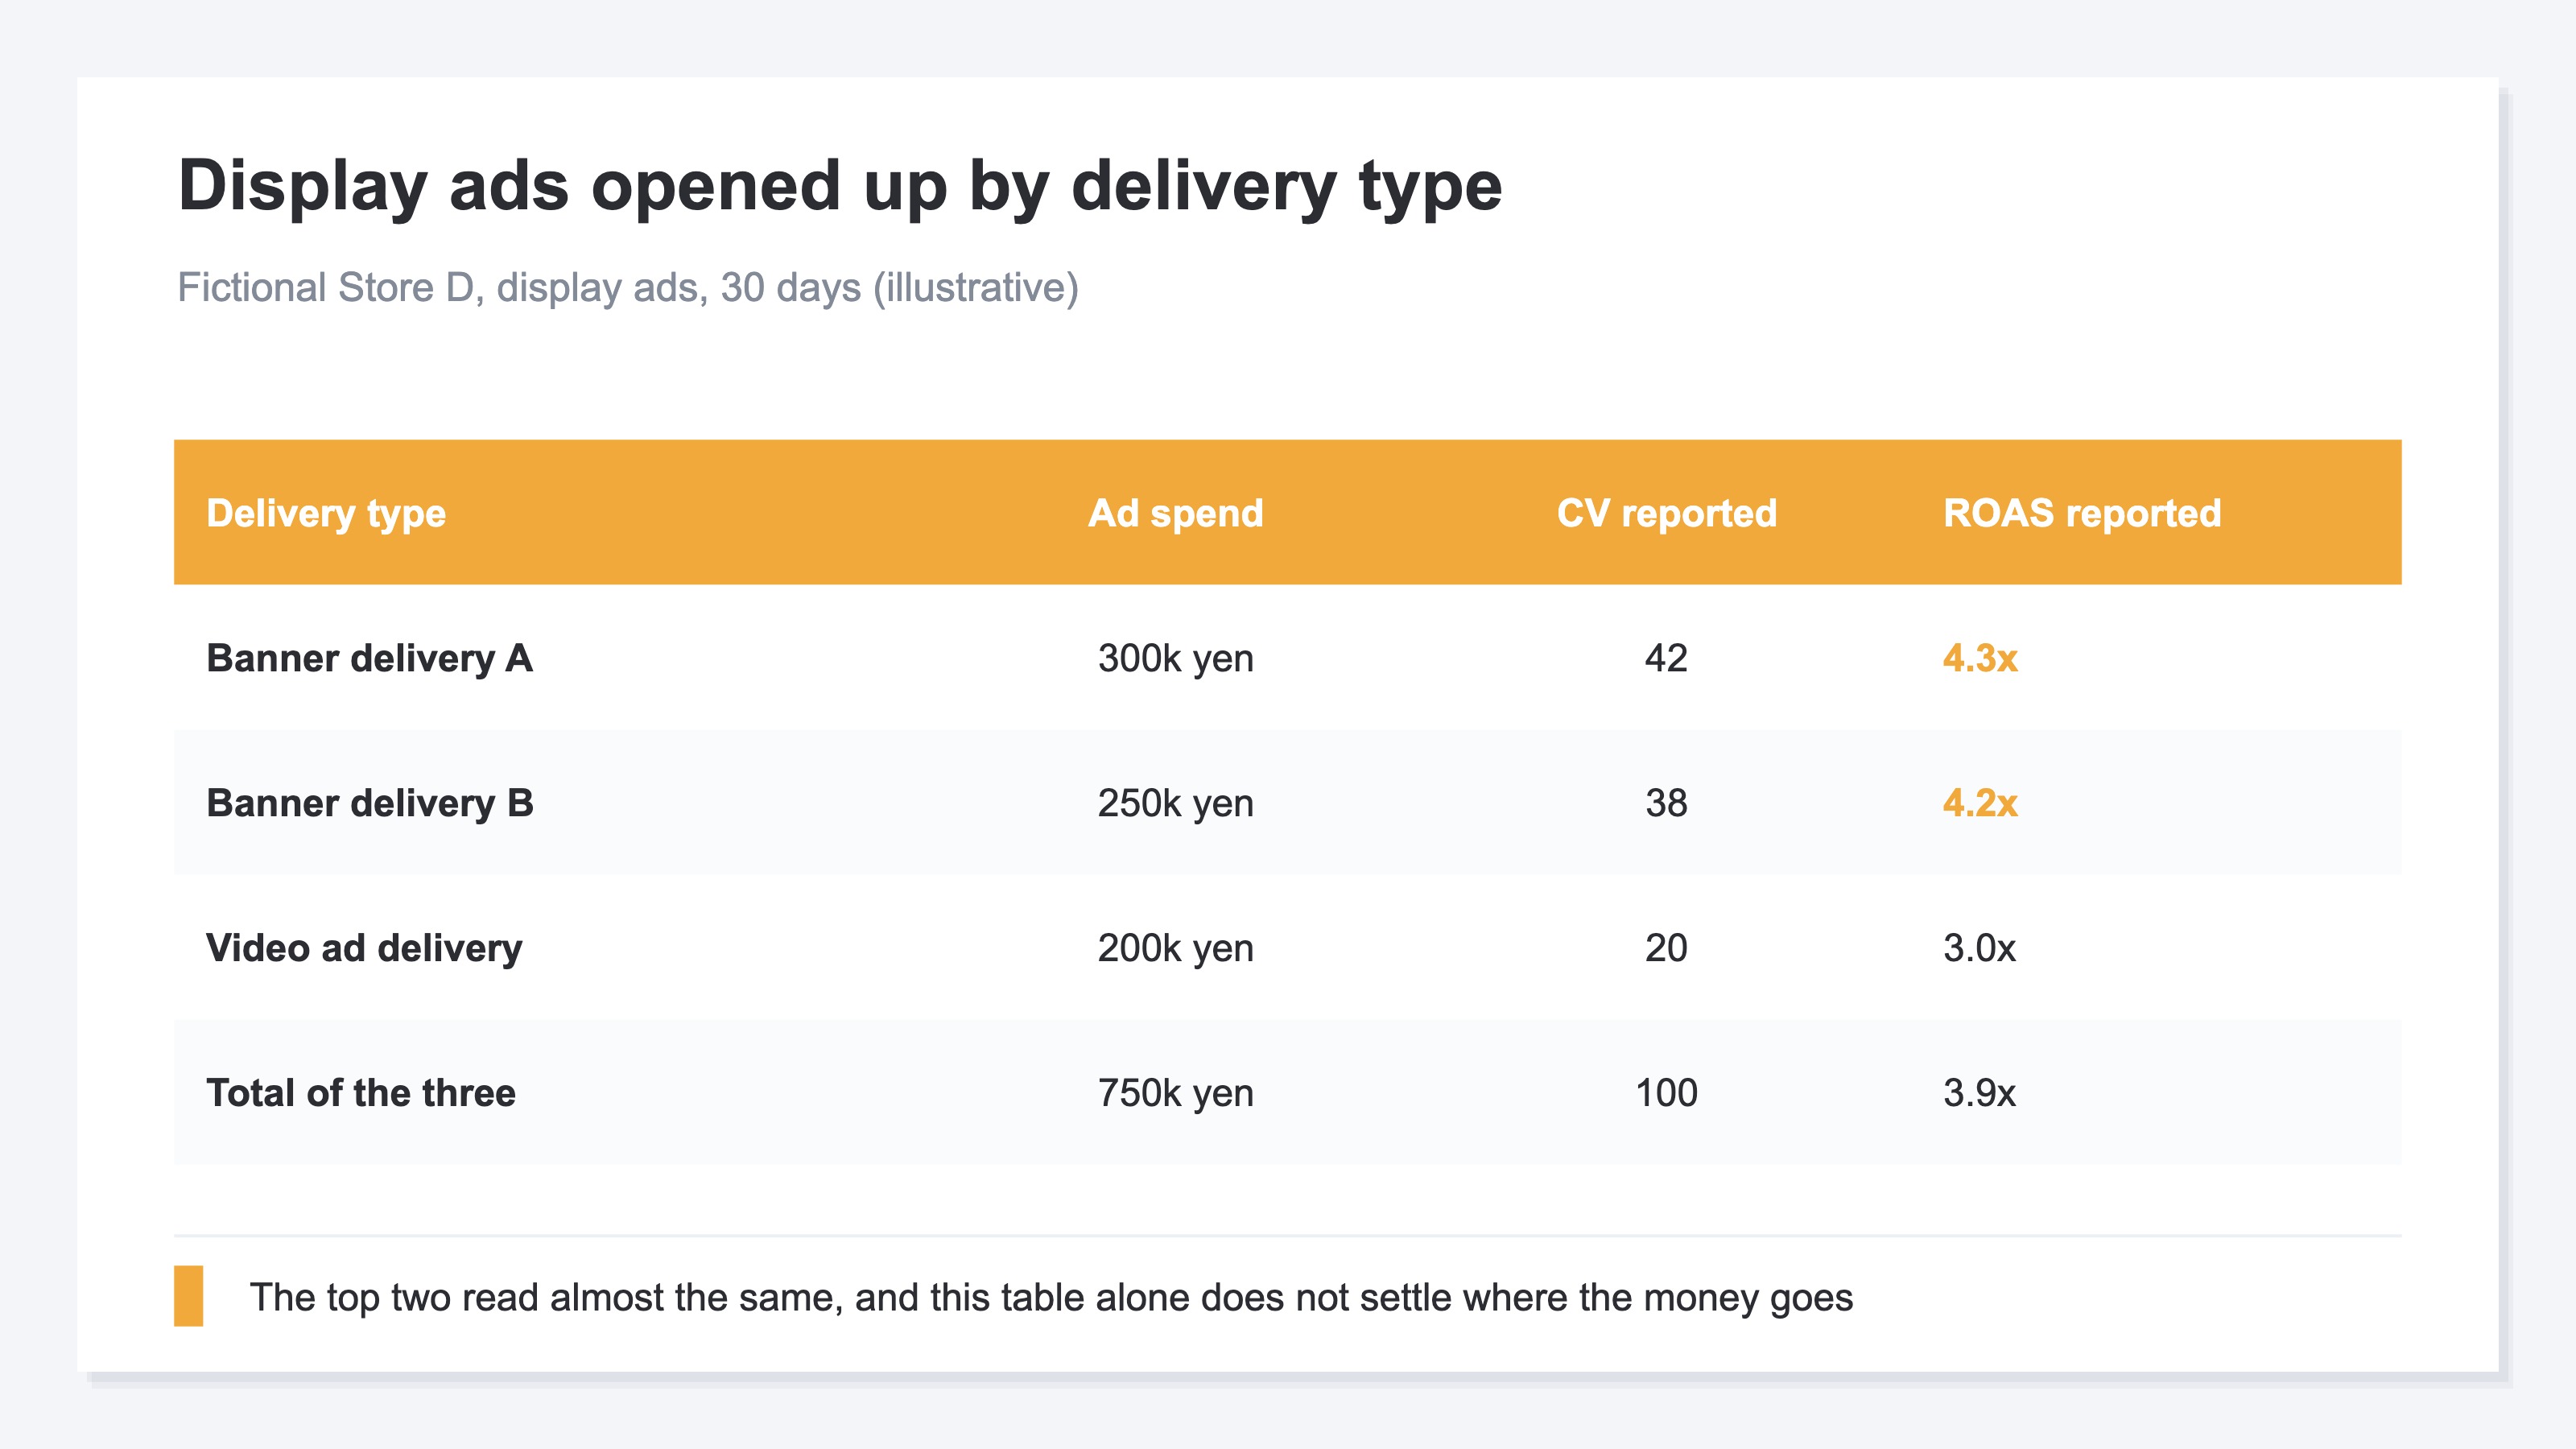
4.3x and 4.2x. Comparing those two doesn't let you choose which one gets next month's money. The gap is only 0.1x.
The material for choosing isn't in that table. Pull out only the purchases from people who clicked, and banner delivery A is 25 of its 42, banner delivery B is 8 of its 38. As proportions that is 60% and 20%, and reflecting it stops the two from being equivalent.
Banner delivery A   4.3x × 25 ÷ 42 = 2.6x
Banner delivery B   4.2x ×  8 ÷ 38 = 0.9x
Video ad delivery   3.0x ×  5 ÷ 20 = 0.8x
The two that had been equivalent split into 2.6x and 0.9x. The three together, 38, is the whole of the purchases from people who clicked.
Inside the same display inventory, the judgment reverses by delivery. The one to raise is banner delivery A, and for the remaining two a reduction or a creative swap comes first.
4. Which Data to Decide Next Month's Allocation With#
What can be compared across platforms is only a number whose numerator is aligned to a single basis.
Platform-reported ROAS follows recording rules that differ by platform. Compare 3.9x with another platform's 2.4x and it still doesn't settle which one sold more.
There is one basis you can align on: the revenue from purchases that actually occurred on your own site, attributed to the source they came from. Attribution is the mechanism that assigns revenue to the touchpoints along the path to a purchase[6]. That the evaluation changes with how many days you look back is covered in What is a lookback window? Window length shifts ad credit.
There is a range this attribution doesn't reach. Someone who purchased after a view-through comes back carrying neither a click ID nor a UTM, so that order is attributed to Direct or Referral. The display line reads smaller than it really is, and Direct reads large with no visible reason.
RevenueScope solution
What appears on your own side is only the 24 orders that could be attributed. Matching that against the portion that never appeared requires the platform's reported figures to sit in the same table. RevenueScope provides that table.
From the platform side, four items are taken in as they are: impressions, clicks, the CV count the platform recorded, and CV revenue. The reported figures, view-through still included, line up in the same table as the numbers from your own measurement. On your own side, the revenue from purchases attributed to their source is calculated, along with the ROAS from dividing it by ad spend. For this display-ad comparison, ad spend is registered through a form by year, month and channel, or imported in bulk from CSV.
The same content can also be pulled from ChatGPT or Claude over MCP.
One example (illustrative) / Fictional Store D, 30 days
| Channel | Ad spend | CV recorded by the platform | Attributed revenue, own measurement | ROAS |
|---|---|---|---|---|
| Display ad platform | ¥750,000 | 100 | ¥680,000 | 0.9 |
| Search ad platform | ¥400,000 | 52 | ¥760,000 | 1.9 |
| Direct | — | — | ¥960,000 | — |
Note: one example, put here to show how it is read. The display-ad store and its rounded figures are fictional. What opens from the CTA is sample data, refreshed daily, so the figures on that screen will not agree with these.
The 100 CVs recorded by the platform is a value that still has the view-through portion inside it. The attributed revenue, ¥680,000, is fixed as the numerator. Direct carries no ad spend. Purchases that came back through a view-through mix in here, and revenue that could not be attributed is displayed separately as unattributed.
At this point the unit of the decision splits into two levels. How much goes to each channel is decided on ROAS with attributed revenue from your own measurement as the numerator. Which delivery to lean toward inside that channel is decided in the ad platform's interface. How clicks land by delivery is displayed only there.
FAQ#
Frequently asked questions#
Q. Where can I tell whether view-through is inside the number I have open?
A. Google Ads has numbers dedicated to view-through[1]. If you are looking at the main conversions number, view-through is not inside it. On Meta, check the attribution setting chosen on the ad set[2].
Q. If ROAS measured with clicks only comes out under 1.0x, should we stop the campaign?
A. Don't decide on that number alone. Two things go into the judgment: ROAS aligned to a single basis, and how clicks land by delivery.
Q. Can RevenueScope exclude the view-through portion?
A. It can't be excluded. The side that separates click-through from view-through is the platform, and what RevenueScope receives is the platform's reported figures taken in as they are. What RevenueScope measures is the purchases that land on your own site.
Summary#
Display ads alone produce more conversions because the number you are looking at carries the view-through portion inside it too. If you are looking at the "Conversions" number in Google Ads, view-through is not inside it, so the cause is somewhere else. On Google Ads display, a view-through is associated with the last impression where at least 50% of the ad was on screen for at least one second[1]. That standard differs by platform, so the size of a ROAS figure compared across platforms carries no meaning.
A comparison only holds when the numerator is aligned. Revenue from purchases that occurred on your own site, attributed to the source they came from, can be used the same way for every platform.
Before you decide where next month's increase goes, check whether you can say in one line what the numerator of the ROAS in front of you is.
See which ads actually drive revenue, at a glance
Free up to 2,000 sessions/month, AI connection included. No credit card required. Up and running in 5 minutes.
References#
- [1] Google Ads Help "Understand your conversion tracking data" (2026)
- [2] Meta Business Help Center "About attribution models and attribution settings" (2026)
- [3] Google Ads Help "About conversion measurement" (2026)
- [4] Google Ads Help "View-through conversion window: Definition" (2026)
- [5] Google Ads Help "About conversion counting options" (2026)
- [6] Google Analytics Help "Get started with attribution" (2026)