
Retargeting, and only retargeting, reads several times higher on ROAS. That gap comes from who the ads reach. This article lays out how to tell whether the revenue was newly created, by watching how attributed revenue moves in first-party measurement.
Contents
TL;DR#
-
ROAS reads several times higher because the ads only reach site visitors
The audience is built from a list that gathers the people who have visited the site
-
Add up what each platform reports and the total can exceed actual revenue
Each platform counts purchases that passed through its own ads as conversions
-
Whether the revenue was newly created shows in how it moves when the attribution basis is switched
The larger a channel reads under last-touch and the smaller under first-touch, the more it is riding on upstream acquisition
1. Retargeting ROAS Is High Because It Only Reaches Site Visitors#
Retargeting reads several times higher on ROAS than the rest because of who it reaches: site visitors, meaning people who have already been to the site.
Open the dashboard and retargeting alone can stand out. Search ads sit around 1.0, social ads about the same. Next to them, retargeting shows 5.0. Deciding to shift next month toward retargeting is the natural move.
Start by confirming who the ads reach. Retargeting delivers against a list that gathers people who visited the site or viewed a product. Google Ads Help calls that list a data segment[1]. It is described as built from activity on a site or an app[1]. What it delivers to is people who have been to the site at least once.
That property of the audience shows up directly in ROAS. People who already viewed the product page, put it in the cart, or dropped out partway through checkout. Among them are people who would have come back and bought without the ad ever being shown once. Retargeting still enters their purchase path as a touchpoint.
Ads that acquire new customers reach a different audience. How to position a vendor that specializes in re-contact is laid out in Criteo in the ad report: 22% of EC sites running ads use it.
There is a second property: delivery optimization itself leans toward people more likely to buy. That split along the customer axis is covered in Why high-ROAS channels can be risky. This article steps away from that and looks instead at whose result the same order gets recorded as.
There is nothing here to go and fix. Review the tag setup, re-apply UTM parameters, and the gap arises in the same shape. What creates it is not the measurement side but who the ads reach. What has to be decided is how the number is treated. When next month's allocation is set, can retargeting's 5.0 be lined up on the same axis as search ads' 1.0? That is where this article starts.
2. Each Platform Counts Orders That Passed Through Its Own Ads#
The results listed in a platform dashboard are numbers that platform counted from its own touchpoints. Several platforms can each count the same order as a conversion.
Google Ads conversion measurement is a mechanism that records actions occurring after an interaction with an ad[2]. The starting point of the record is contact with that platform's ad. What was happening on other platforms is not inside the scope of that record.
The room for one order to become several platforms' results comes from there. Say a buyer clicks a search ad and comes back days later through a retargeting ad. Both platforms count it as a purchase that passed through their own ad. One order, two results. Google Ads Help even provides a way to handle the same conversion being recorded more than once[3].
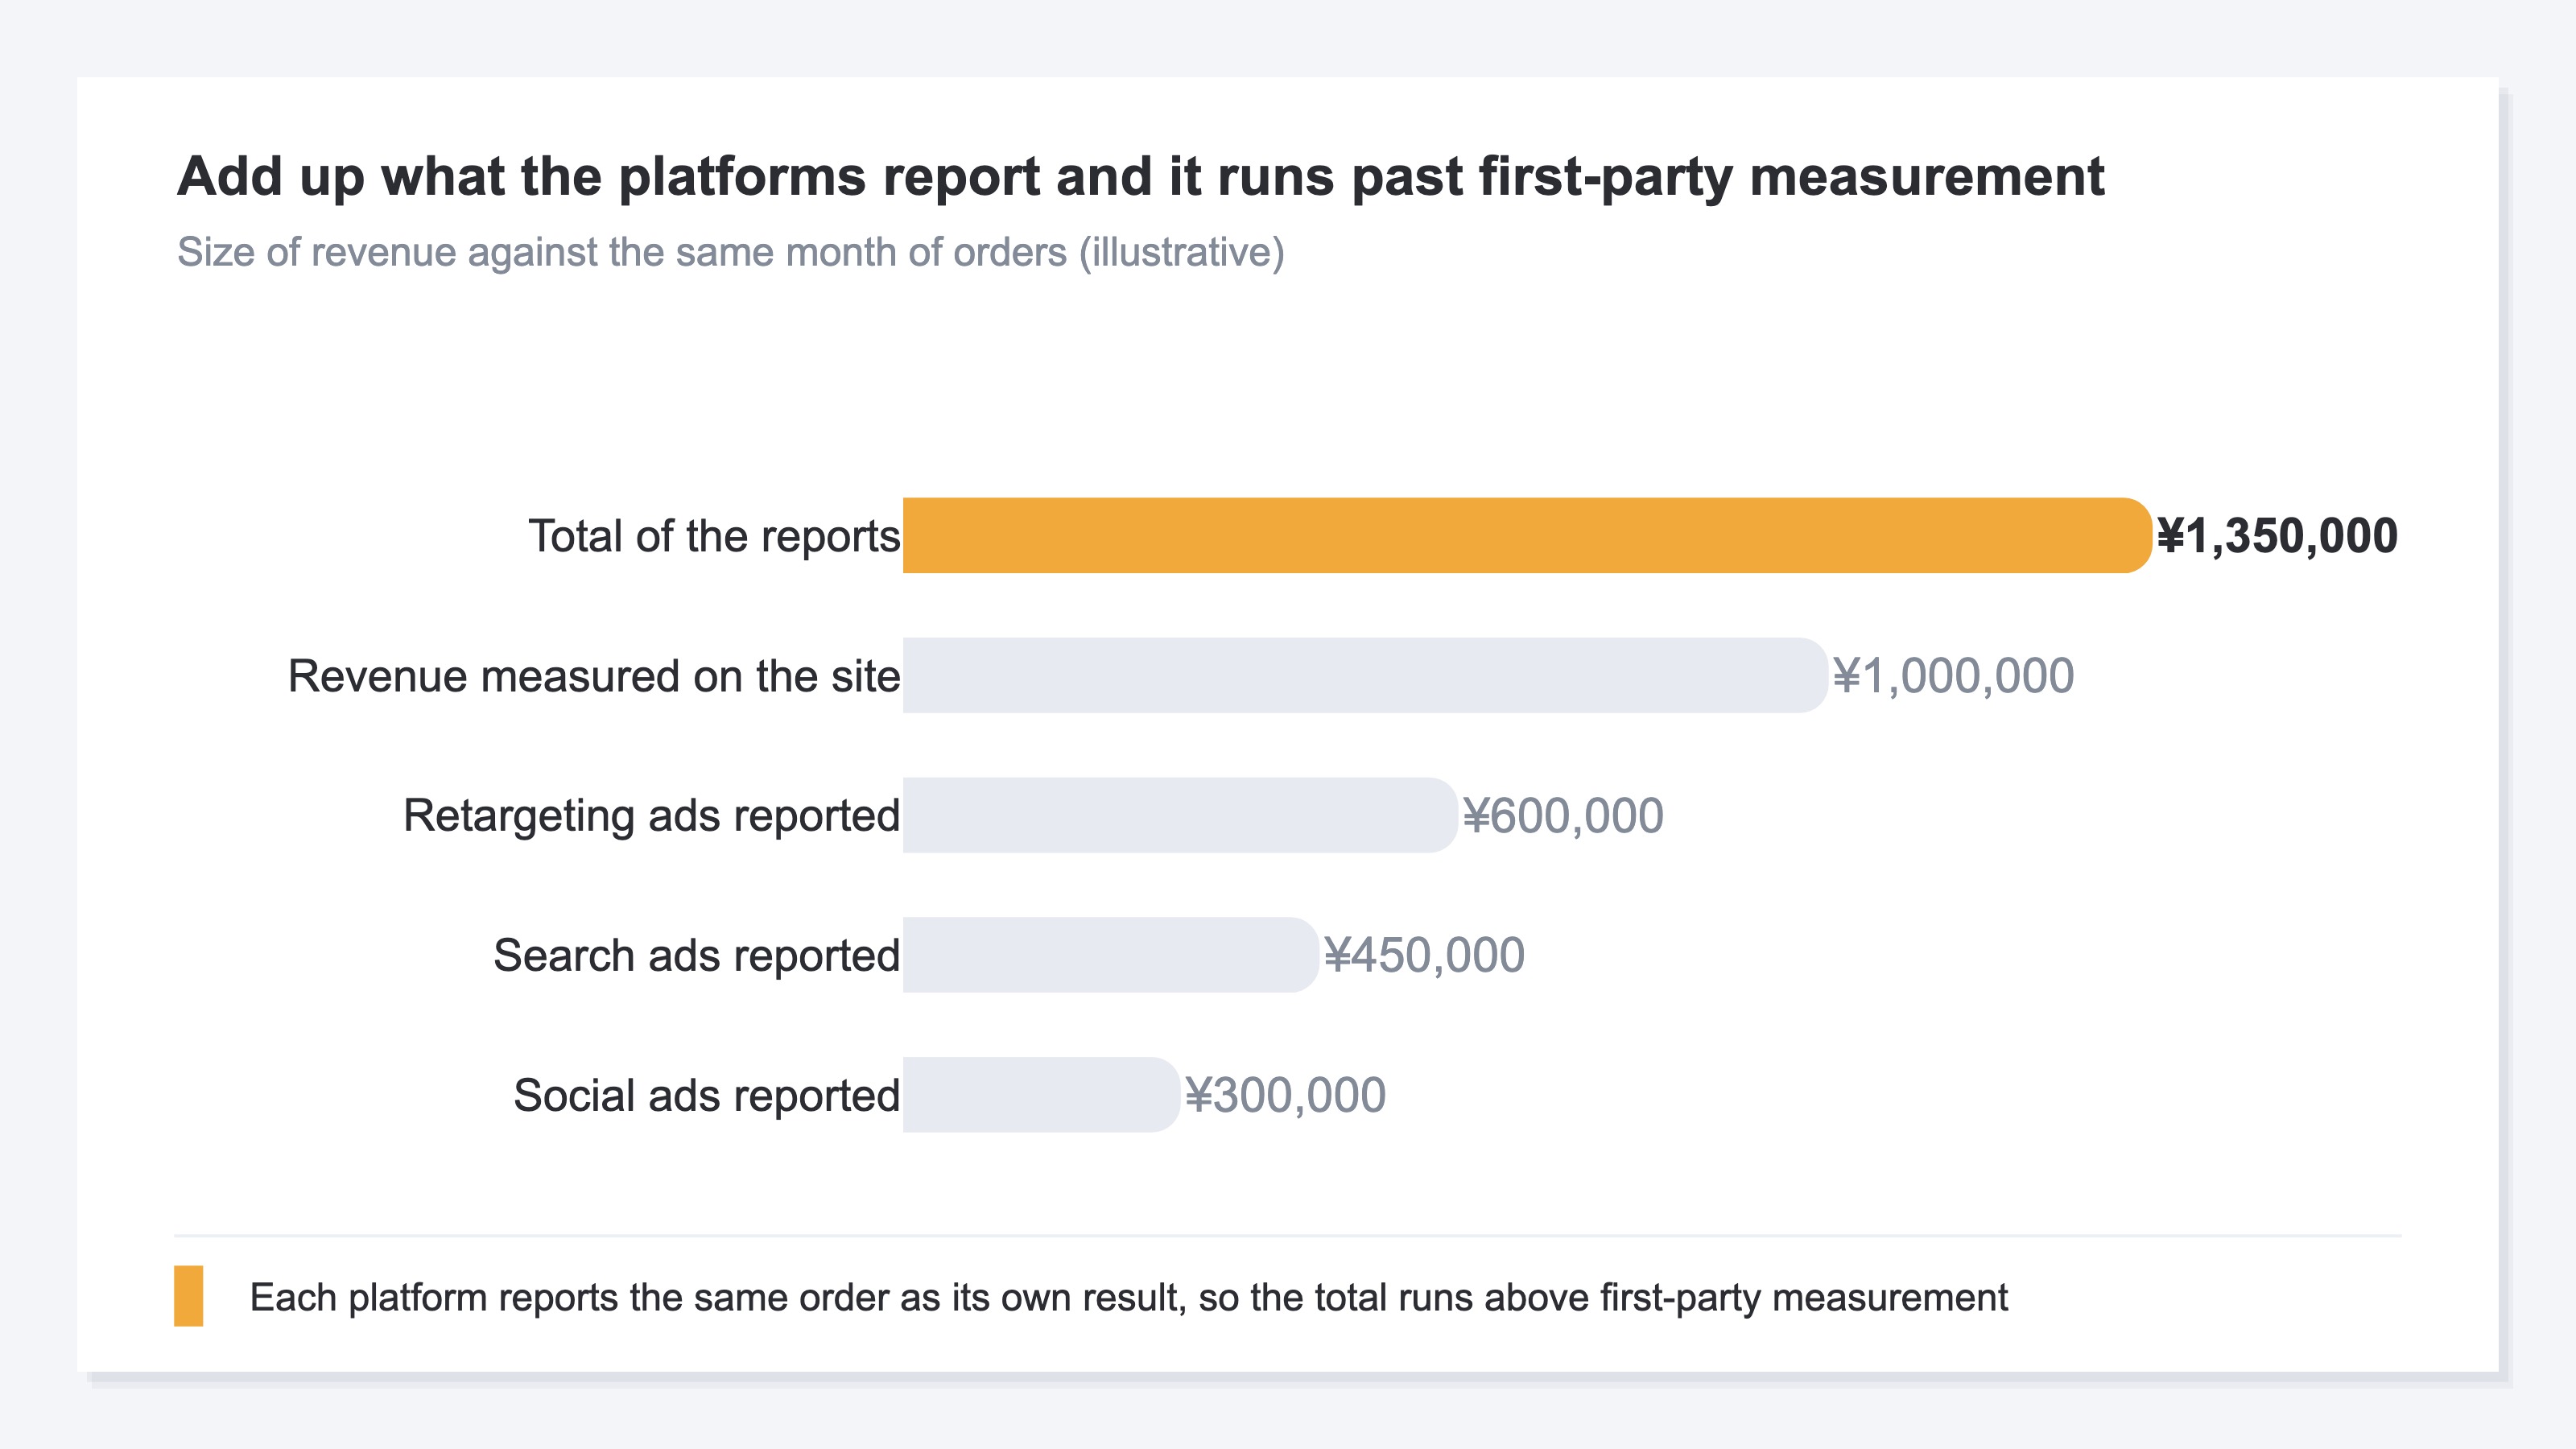
Across platforms, the overlap does not surface. Write out the conversion revenue from each dashboard and add them together, and the total can exceed actual revenue.
How they overlap differs by platform as well. Meta's help explains that the attribution setting changes which conversions get counted as results[4]. Some settings include impressions that were never clicked, and that treatment is laid out in Meta's Advantage+: how results come to look bigger. Some platforms carry a mechanism that estimates the range measurement cannot reach and includes it in the results.
Handling the overstated total at the unit of overall ad efficiency is covered in Summing platform ROAS overstates it: read true ad efficiency with MER. What this article follows is why retargeting alone stands out.
Here the edge of the dashboard comes into view. That screen counts every order with a touchpoint of its own, without omission. What it does not carry is how much the other platforms assigned to the same order. How much of it overlaps cannot be judged from inside that screen alone.
3. Two Ways to Line the Numbers Up and Tell If the Revenue Is New#
There are two ways to tell. Line the platform-reported figures up against the revenue measured on the site over the same period, and re-sort the attributed revenue from first-party measurement under last-touch and first-touch.
The first is to line up two revenues of different origin over the same period. The platform-reported figure is a value that platform aggregated on its own basis. The revenue measured on the site is a record of purchases that happened on the site. Line them up for the same month and the size of the difference between the totals comes out. The larger the difference, the more some platform is folding other platforms' results into its own.
The second is to switch where the revenue measured on the site is attributed. Last-touch assigns revenue to the touchpoint immediately before the purchase. First-touch assigns it to the first touchpoint. Google Analytics Help likewise explains attribution as a mechanism that assigns revenue to the touchpoints along the path[5].
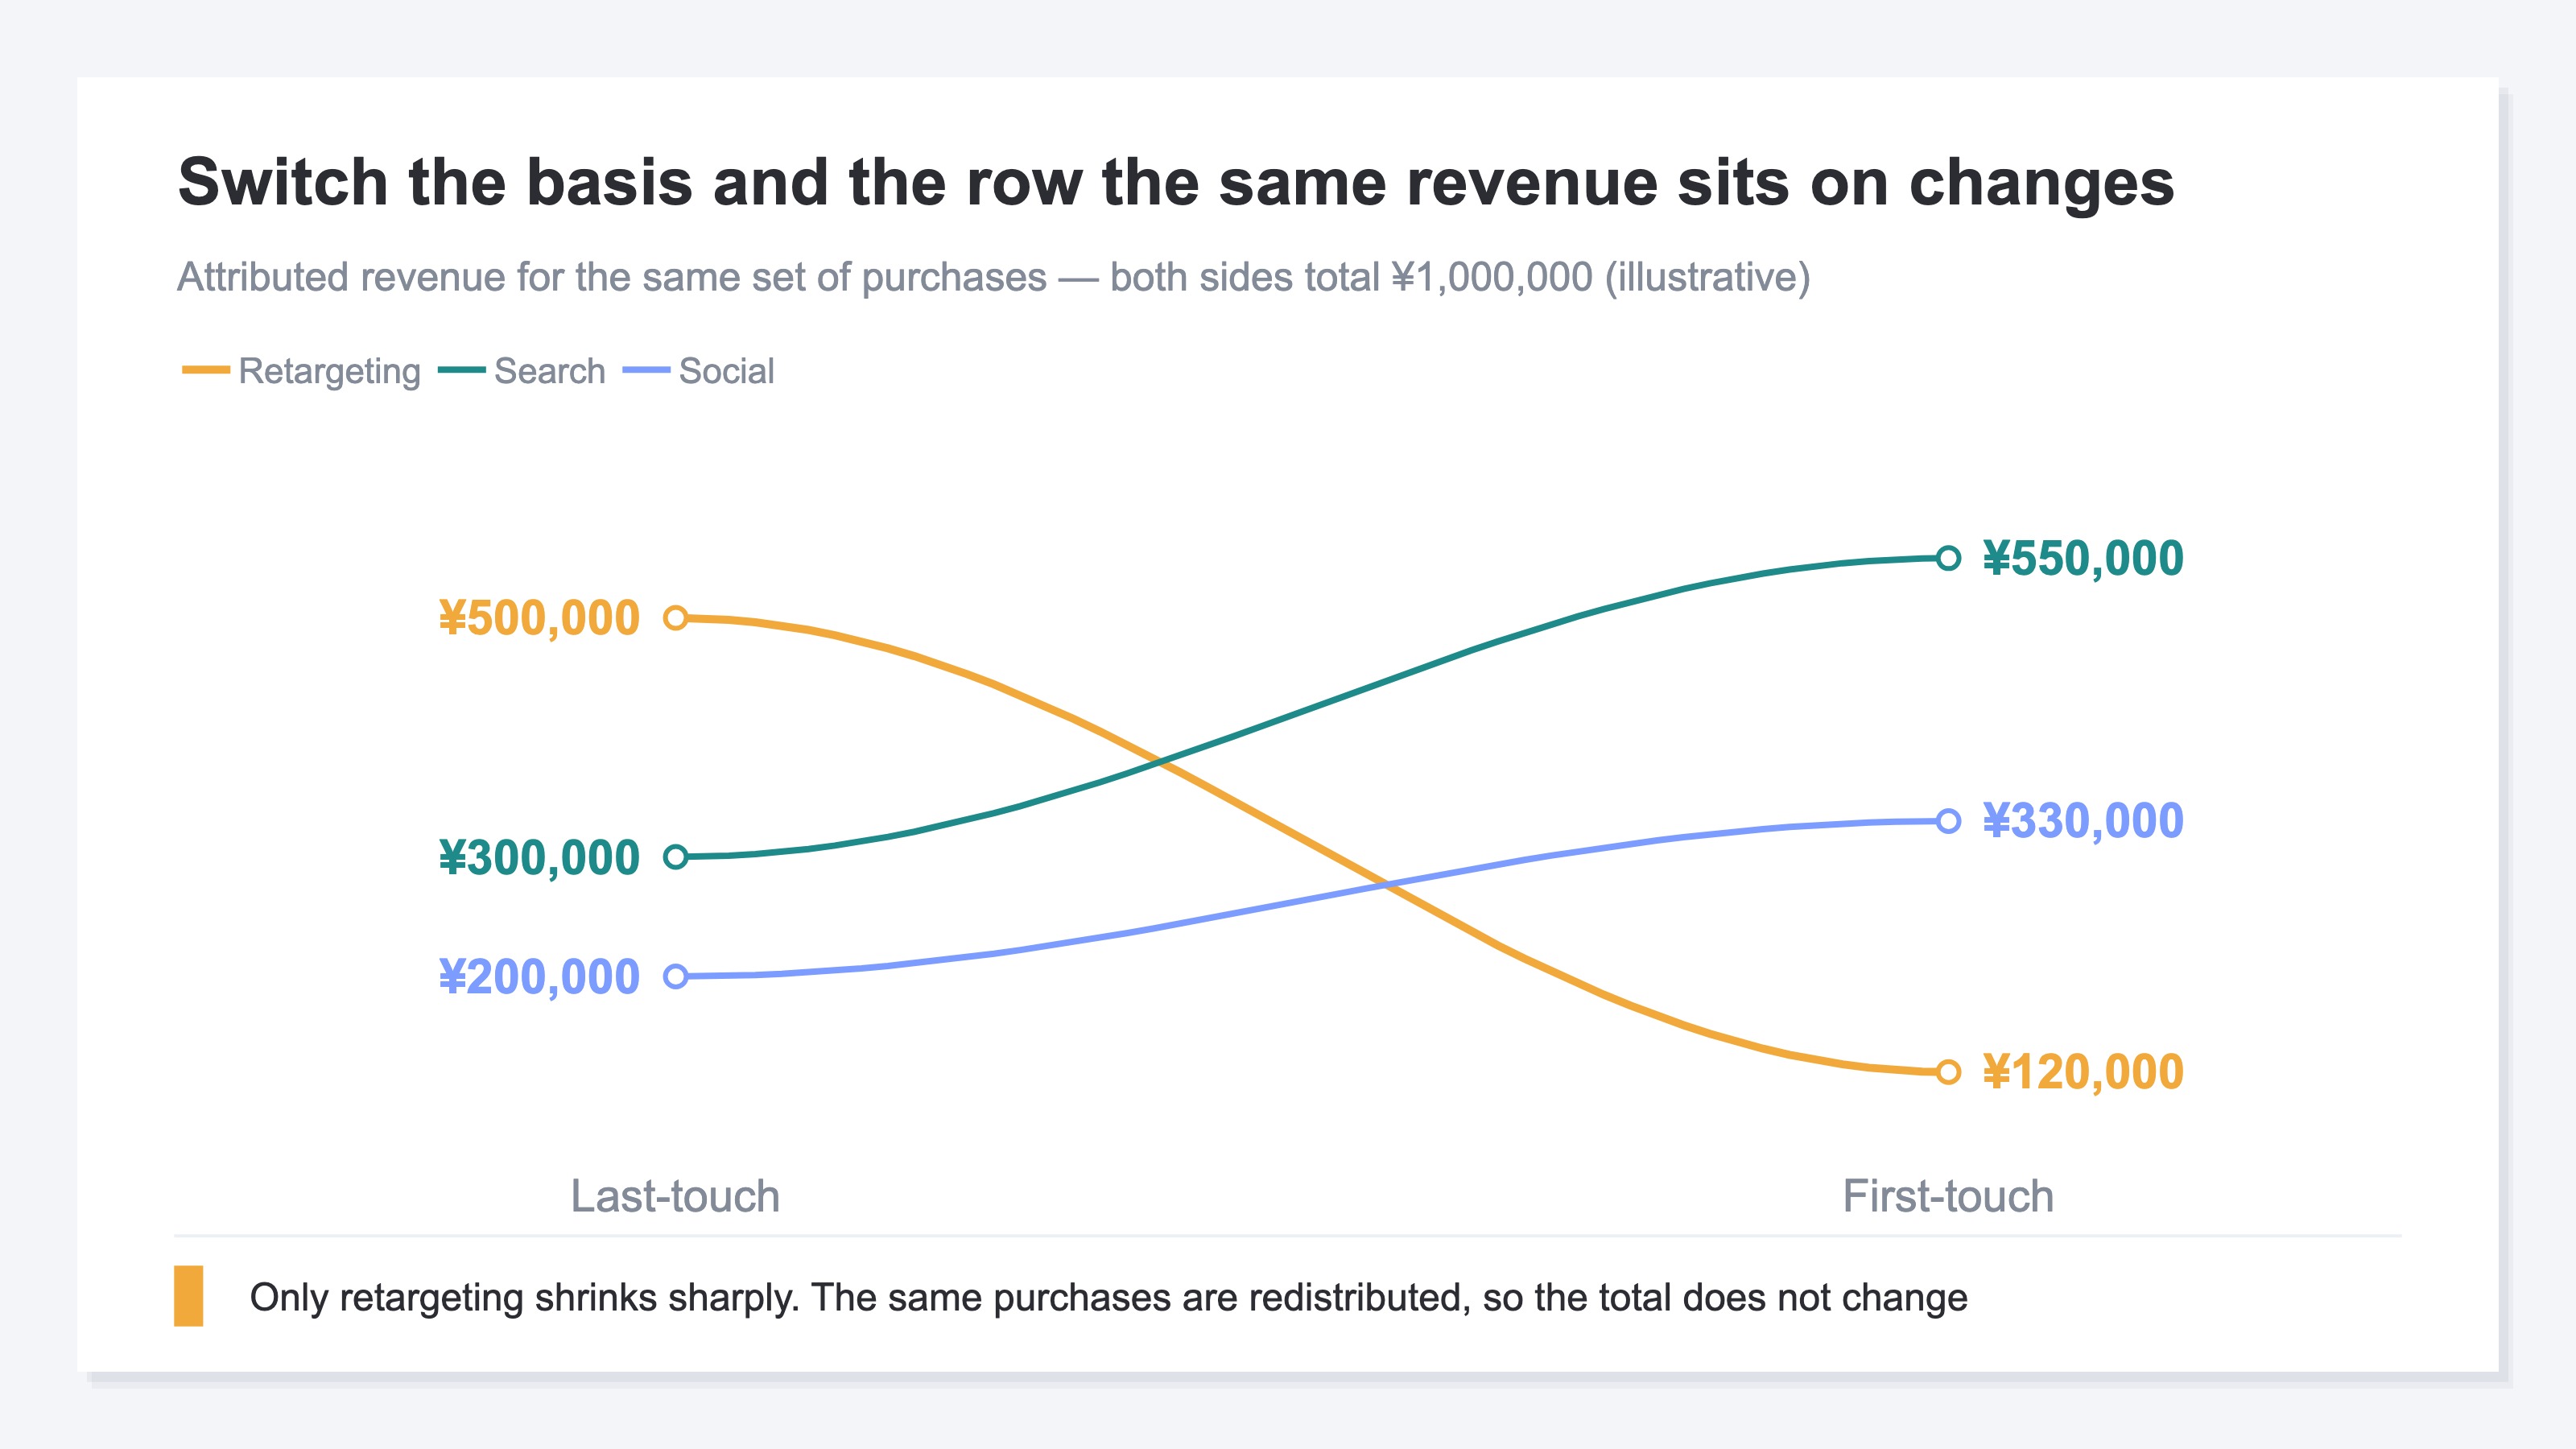
Because the same set of purchases is only being re-sorted, the total does not change. What changes is which channel the result gets counted under. Revenue attributed to retargeting is large under last-touch and small under first-touch. It is a touchpoint that enters just before the purchase and rarely becomes the first one.
How much it shrinks is the guide for the judgement. A channel whose size does not change when the basis is switched is a starting point of the purchase path. A channel that shrinks sharply is riding to a high degree on visits that other channels brought in. Lining up four bases to evaluate the awareness-side channels is covered in Comparing four attribution models: underrating awareness channels.
Seen from the acquisition side, there is one more implication. The retargeting audience is built out of the visits that search, social and email brought in. Cut upstream acquisition and the audience shrinks with it. Is the decision to shift toward the efficient channel cutting into the acquisition path that holds that efficiency up? This is the place to check before the allocation is set.
Drop one more level and the picture changes again. Retargeting as a single block is the sum of deliveries with different characters.
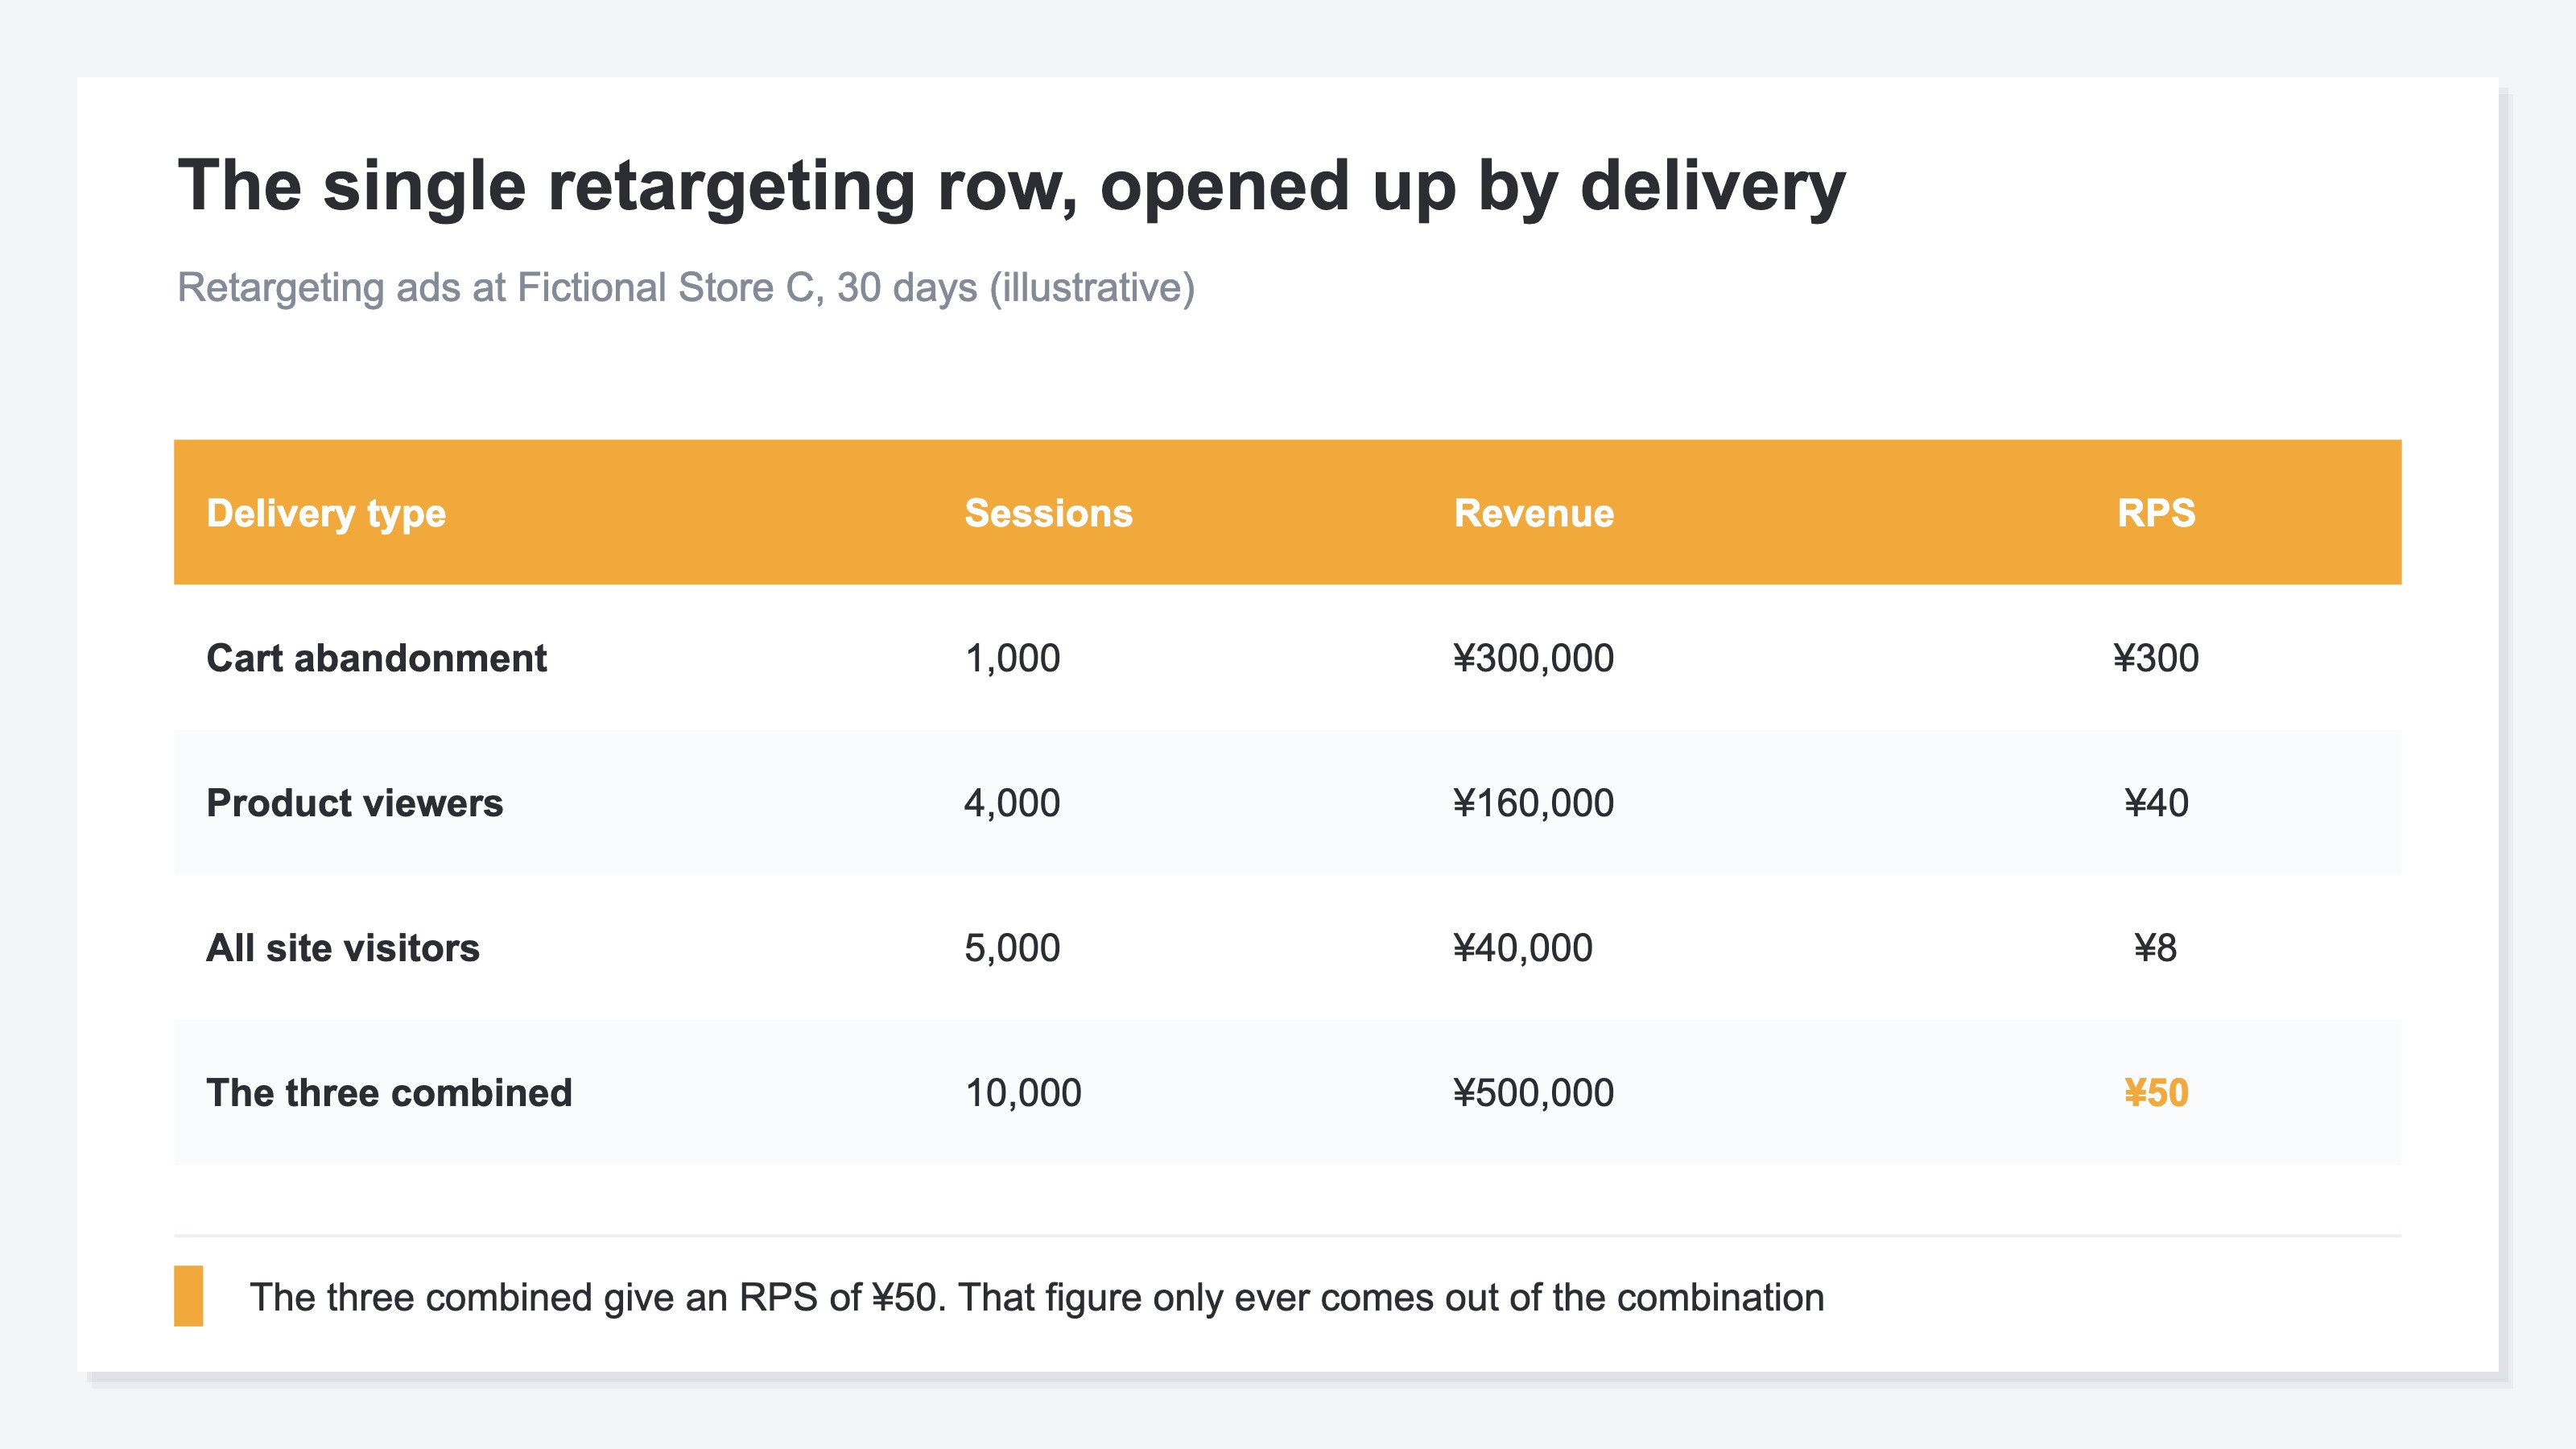
The three combined give an RPS of ¥50. That is what is left after ¥300 for cart abandonment and ¥8 for all visitors are folded into one. The figure ¥50 only ever comes out of that combination. The unit for deciding to raise or cut is not retargeting as one block, but these three deliveries.
RevenueScope solution
The ad dashboard open in front of you records results that the platform aggregated on its own basis. Go one step further and try to check how much another platform assigned to the same order, and there is nowhere to put it.
RevenueScope displays the platform-side results and the revenue measured on the site itself in the same table. What lines up on the platform side is four items: impressions, clicks, platform-measured conversions and platform-measured conversion revenue. The revenue measured on the site is the value attributed to purchases that happened on the site. For this retargeting comparison, ad spend is registered through a form by year, month and channel, or imported in bulk from CSV.
Ask ChatGPT or Claude over MCP "for the last 30 days, what is the ad spend and revenue by channel?" and the answer comes back in this form.
One example (illustrative) / Fictional Store C, 30 days
| Channel | Ad spend | Platform-reported revenue | Revenue measured on the site | ROAS |
|---|---|---|---|---|
| RTB House | ¥100,000 | ¥600,000 | ¥500,000 | 5.0 |
| Google Ads | ¥300,000 | ¥450,000 | ¥300,000 | 1.0 |
| Meta | ¥200,000 | ¥300,000 | ¥200,000 | 1.0 |
Note: the table above is one example built to explain how it is read. Both the store name and the rounded figures in this retargeting example are fictional. The demo screen behind the CTA loads sample data from the sample store (refreshed daily), so opening it will not produce the figures shown here.
Add the platform-reported revenue together and it comes to ¥1,350,000, while the revenue measured on the site is ¥1,000,000. The numerator of ROAS is fixed on the revenue measured on the site, so it does not agree with the ROAS shown in the platform dashboard. Two revenues with different definitions are sitting in the same table.
Switch the attribution basis and the channel the revenue lands on changes.
Two attribution bases side by side, one example (illustrative) / Fictional Store C, 30 days
| Channel | Last-touch | First-touch | Sessions |
|---|---|---|---|
| RTB House | ¥500,000 | ¥120,000 | 10,000 |
| Google Ads | ¥300,000 | ¥550,000 | 30,000 |
| Meta | ¥200,000 | ¥330,000 | 20,000 |
| Total | ¥1,000,000 | ¥1,000,000 | 60,000 |
Sessions do not change when the basis is switched. What changes is revenue, and revenue per session (RPS). RTB House, which carries the re-contact delivery, has an RPS of ¥50 under last-touch and ¥12 under first-touch.
Open a channel's breakdown and revenue, RPS, average order value and purchase rate split by utm_campaign appear inside it. Where campaign names are separated by delivery, the per-delivery breakdown seen in section 3 is visible here. What appears is a cross-section of that period only; a comparison against the previous period is not attached.
For the site as a whole, sessions, revenue, RPS, average order value and purchase rate are also shown split between new visitors and people who came back on a different day (repeat visitors). A visitor counts as a repeat visitor when that same visitor has a session on an earlier day.
That settles the next move. Take retargeting ads out of the judgement about raising or cutting new-customer acquisition, and set a separate ceiling for them. The guide for that ceiling is the volume of visits that upstream acquisition brought in. Search ads and social ads are the side whose attributed revenue grows under first-touch, so the new-customer allocation gets rebuilt out of those two.
FAQ#
Frequently asked questions#
Q. Is a high retargeting ROAS a good sign?
A. Reading high is neither good nor bad in itself. The ads are shown only to people who have already visited the site. Care is needed where the increase or decrease is decided on the same axis as ads that acquire new customers.
Q. Adding up the conversion revenue from each platform dashboard exceeds actual revenue. Is that a setup error?
A. Retargeting credit does not by itself show that the ad created an additional purchase. Each platform counts purchases that passed through its own ads as conversions[2]. The same order can enter several platforms' results[3]. Rather than trying to make them agree, put the revenue measured on the site alongside them and cross-check.
Q. Does ROAS change when the attribution basis is switched?
A. ROAS does not change with that switch. Its numerator is fixed on the revenue measured on the site under last-touch. What the switch is for is reading the direction the revenue moves in.
Q. What should the ceiling on the retargeting budget be?
A. The volume of visits that upstream acquisition brought in is the effective ceiling. The audience is built out of those visits. Cut the upstream and the results thin out later.
Summary#
Retargeting ROAS reads several times higher because the ads are shown only to people who have already visited the site. It is not the kind of gap that comes down when a setting is fixed.
The results listed in a platform dashboard are values that platform counted from its own touchpoints[2]. The same order can enter several platforms' results[3]. Add up the conversion revenue from each platform and the total can exceed actual revenue.
Whether the revenue was newly created can be told from how it moves when the attribution basis is switched. Re-sort under last-touch and first-touch, and separate the channels that shrink sharply from the channels whose size stays put.
Check one last thing. The retargeting revenue now under consideration for an increase: does it stay the same size when the basis changes?
See which ads actually drive revenue, at a glance
Free up to 2,000 sessions/month, AI connection included. No credit card required. Up and running in 5 minutes.
References#
- [1] Google Ads Help "About your data segments" (2026)
- [2] Google Ads Help "About conversion measurement" (2026)
- [3] Google Ads Help "Use a transaction ID to minimize duplicate conversions" (2026)
- [4] Meta Business Help Center "About attribution models and attribution settings" (2026)
- [5] Google Analytics Help "Get started with attribution" (2026)