
"Look at last-click and revenue is concentrated in direct and search — social and AI channels barely register." So you started thinking about cutting awareness campaigns. What's actually driving that call is which attribution model split the revenue in the first place. Last, first, linear, and time-decay assign the same revenue in different ways, so the moment you switch models, channels change ranks. This article lays four models side by side on the same 90-day data from a sample store to show how to read the picture without over-cutting awareness. The trap of last-click alone is covered in The last-click attribution trap; here we focus on comparing all four in parallel.
Table of contents
TL;DR#
- On the same revenue, switching attribution model shifts how awareness channels — X, Copilot, referral — rate
- On our sample store's 90-day data, X sits at 0.0% by last-click — completely invisible — yet surfaces at 1.7% by first-click, and Copilot moves from 1.0% to 2.8%, roughly 2.8x
- Judge by last-click alone and you end up cutting the awareness gateways. New sessions thin out with a lag and revenue drops later
- RevenueScope switches between last, first, linear, and time-decay on the same screen with a single click — moving per-channel revenue and RPS (sessions and engagement stay fixed, so the comparison base never moves). It does not implement GA4's data-driven attribution as a matter of design (favoring honest disclosure over a black box tied to prior data volume)
1. What each of the four attribution models actually measures#
Bottom line: an attribution model is a way of assigning the same revenue across channels. The data is identical, so totals don't change; what changes is the assignment rule, and channels look different because of it.
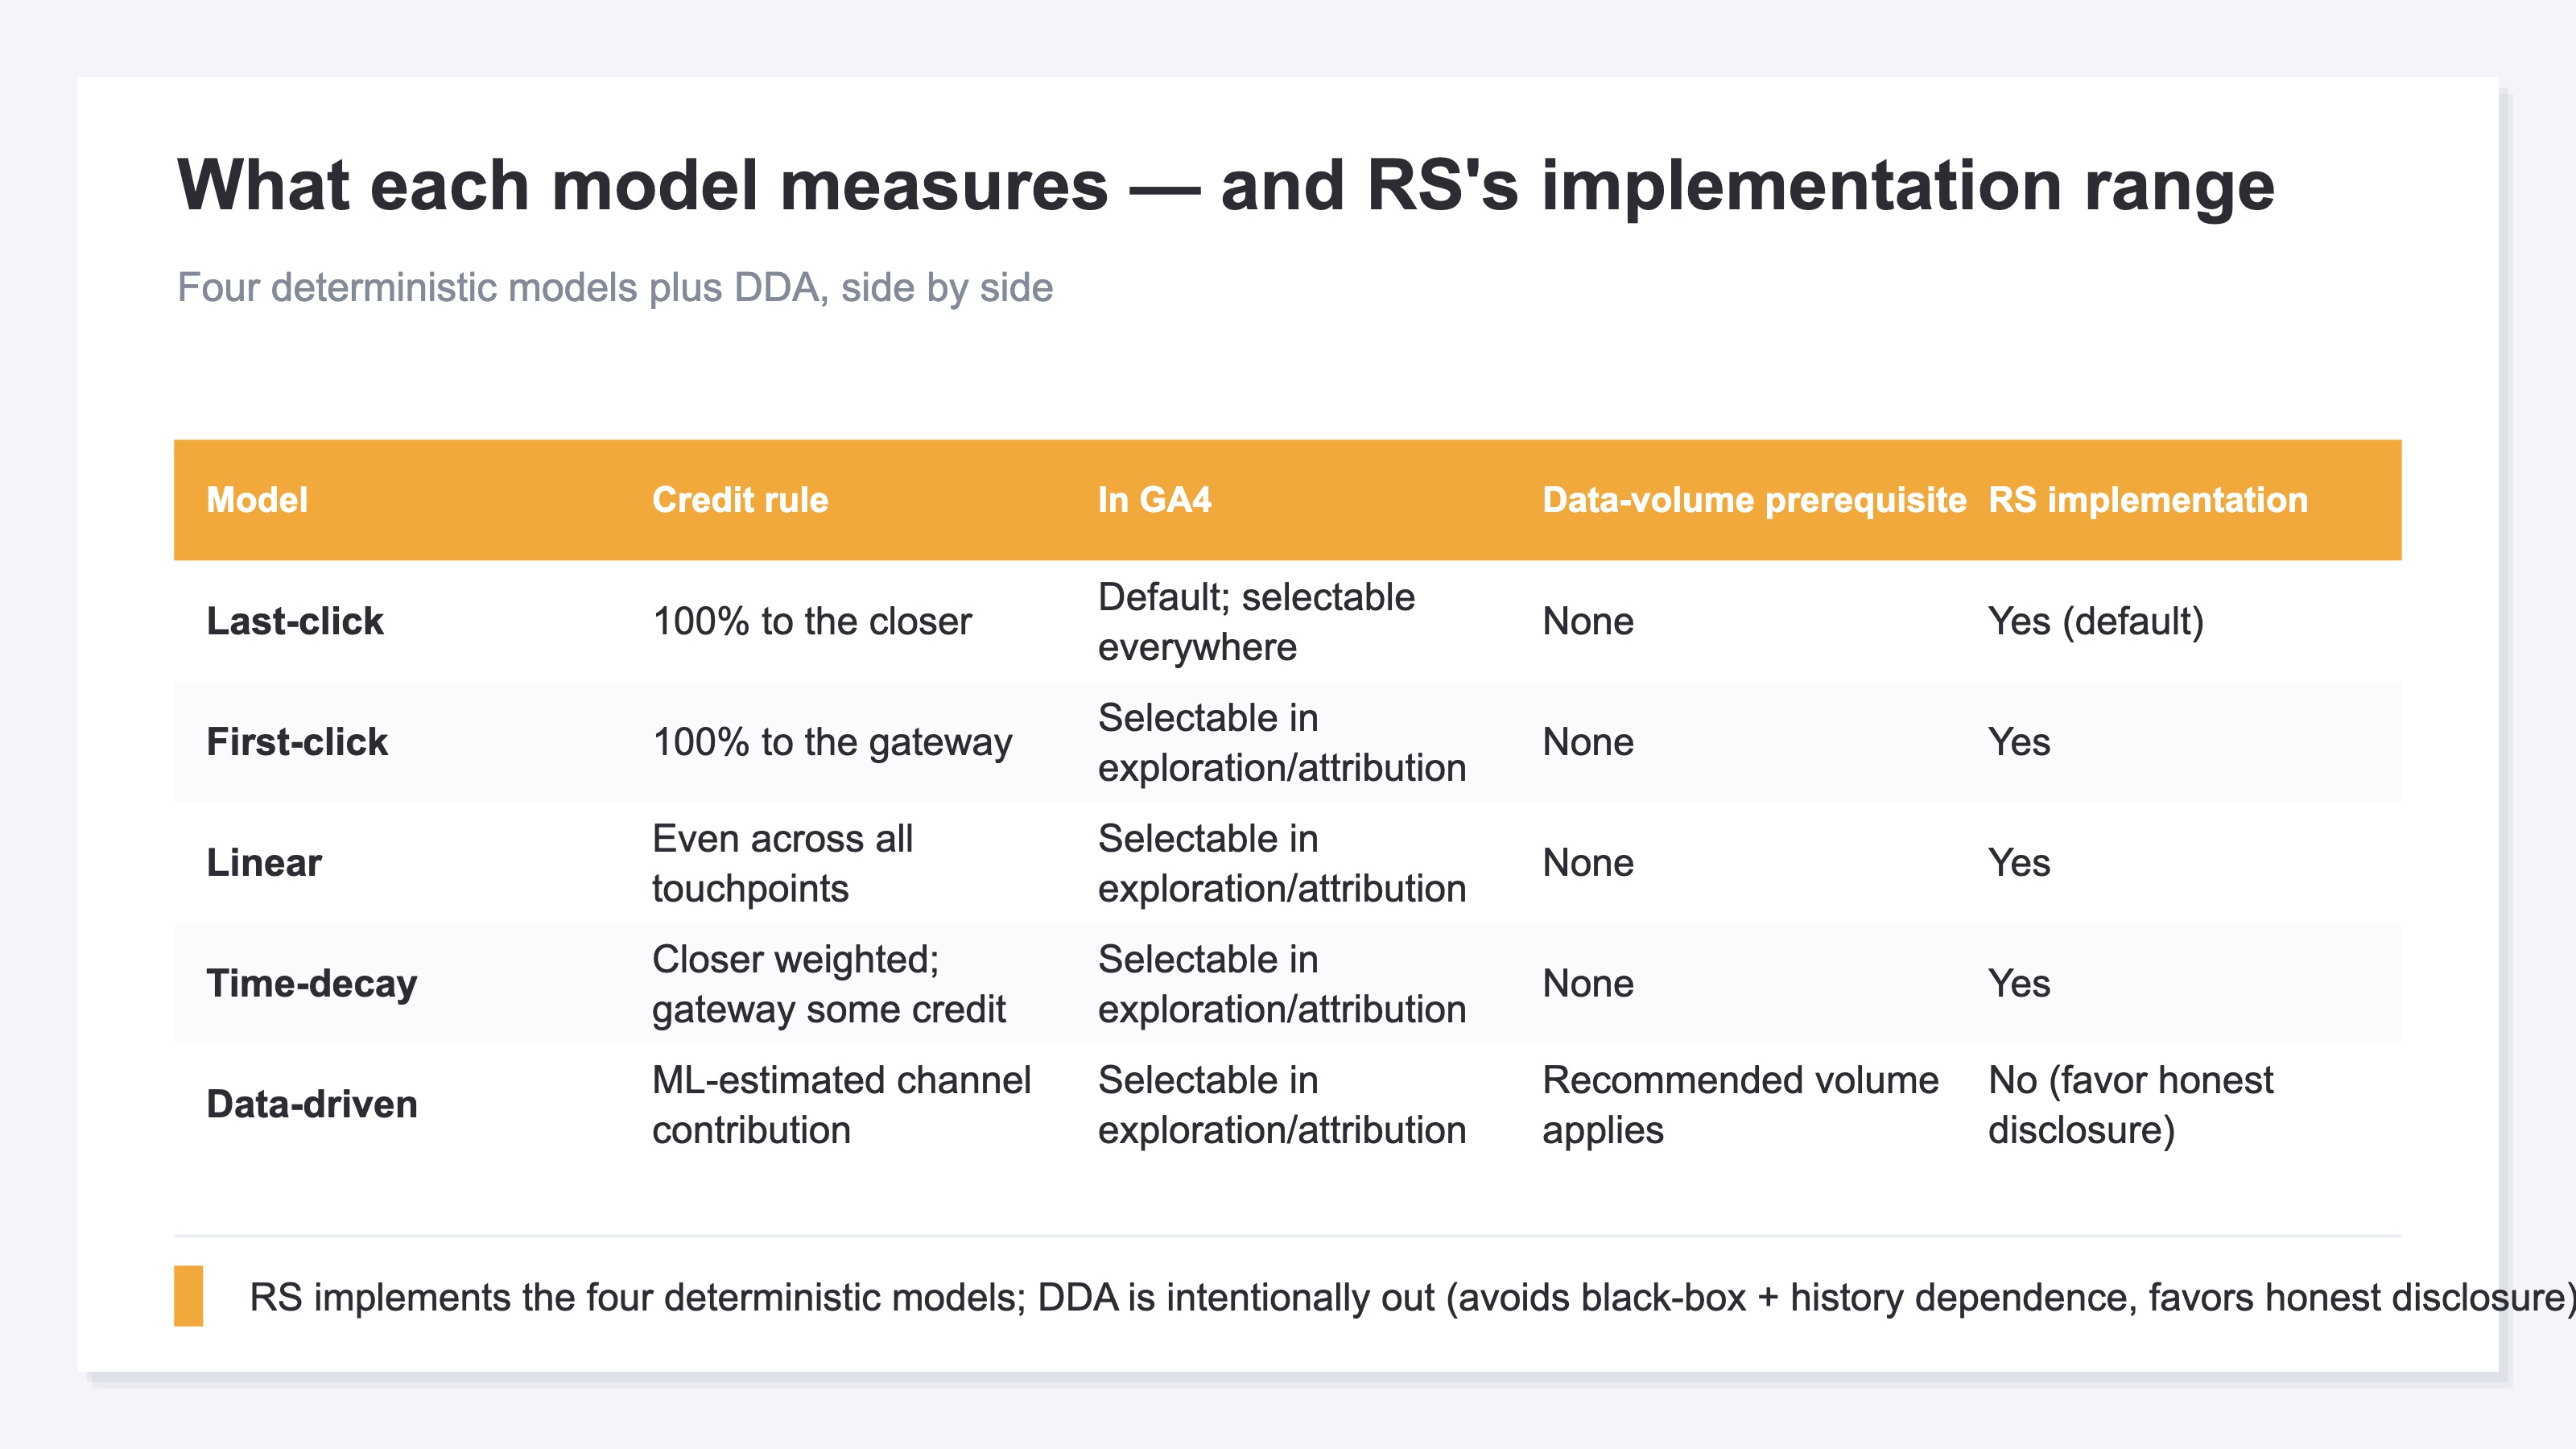
Quick refresher on the four. Last-click credits 100% of the revenue to the channel touched right before purchase — it rewards the "closer." First-click credits 100% to the very first channel a visitor came in on — it rewards the "gateway." Linear splits the revenue evenly across every channel touched along the path — it treats every channel as equally involved. Time-decay weights recent touchpoints more than older ones — it rewards the closer while giving the gateway some credit — a middle ground.
GA4 adds a fifth model on top of these four: data-driven attribution (DDA). DDA uses machine learning to estimate "how much would this channel not being there have hurt revenue" and assigns credit accordingly. The idea is attractive, but what happens inside is opaque, and it comes with a data-volume prerequisite. RevenueScope intentionally does not implement DDA. The reason is a design choice. If a black-box model splits the numbers, you can't later explain why the split looks the way it does. Channels that don't meet the volume threshold end up effectively collapsed into last-click even under DDA. RevenueScope lines up the four deterministic models (last, first, linear, time-decay) and surfaces Unattributed (revenue that couldn't be tied to any channel) on the same screen — favoring honest disclosure.
2. What happens to channel rankings when you switch models on the same data#
Bottom line: line up the same 90-day data across four models and the awareness channels move the most. What looked like a "winner" and a "loser" under last-click can swap with a single model switch.
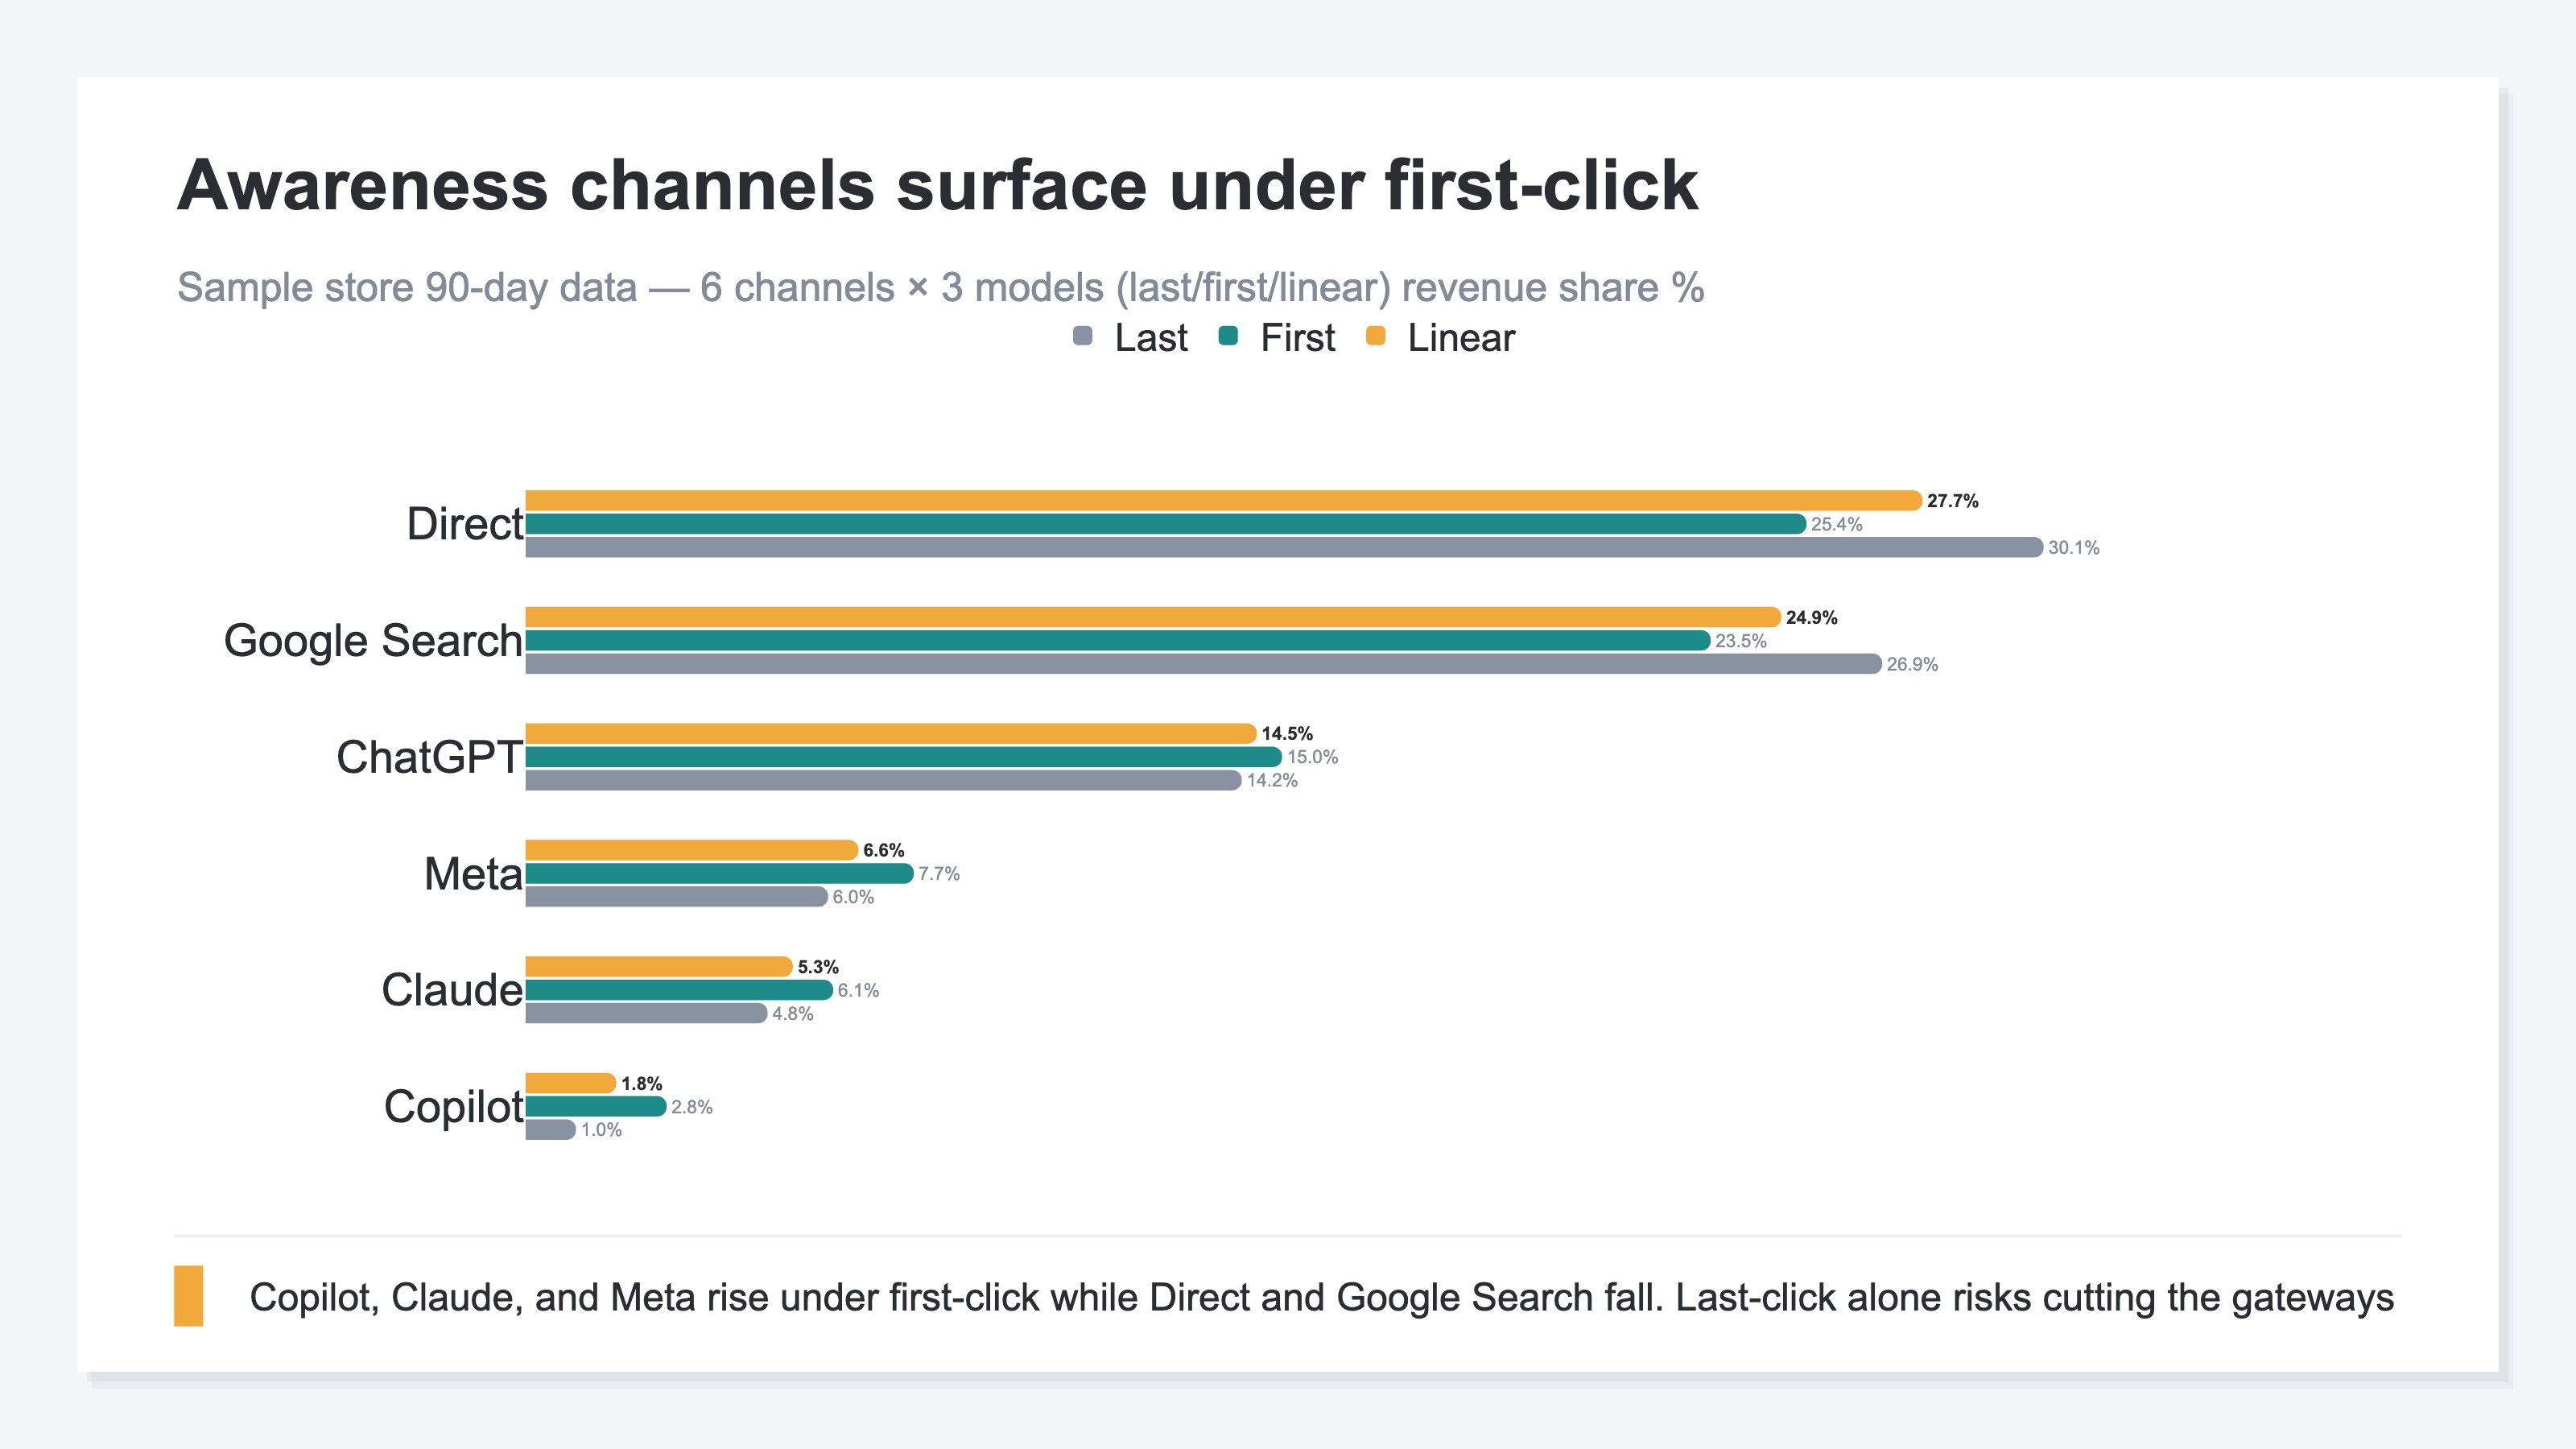
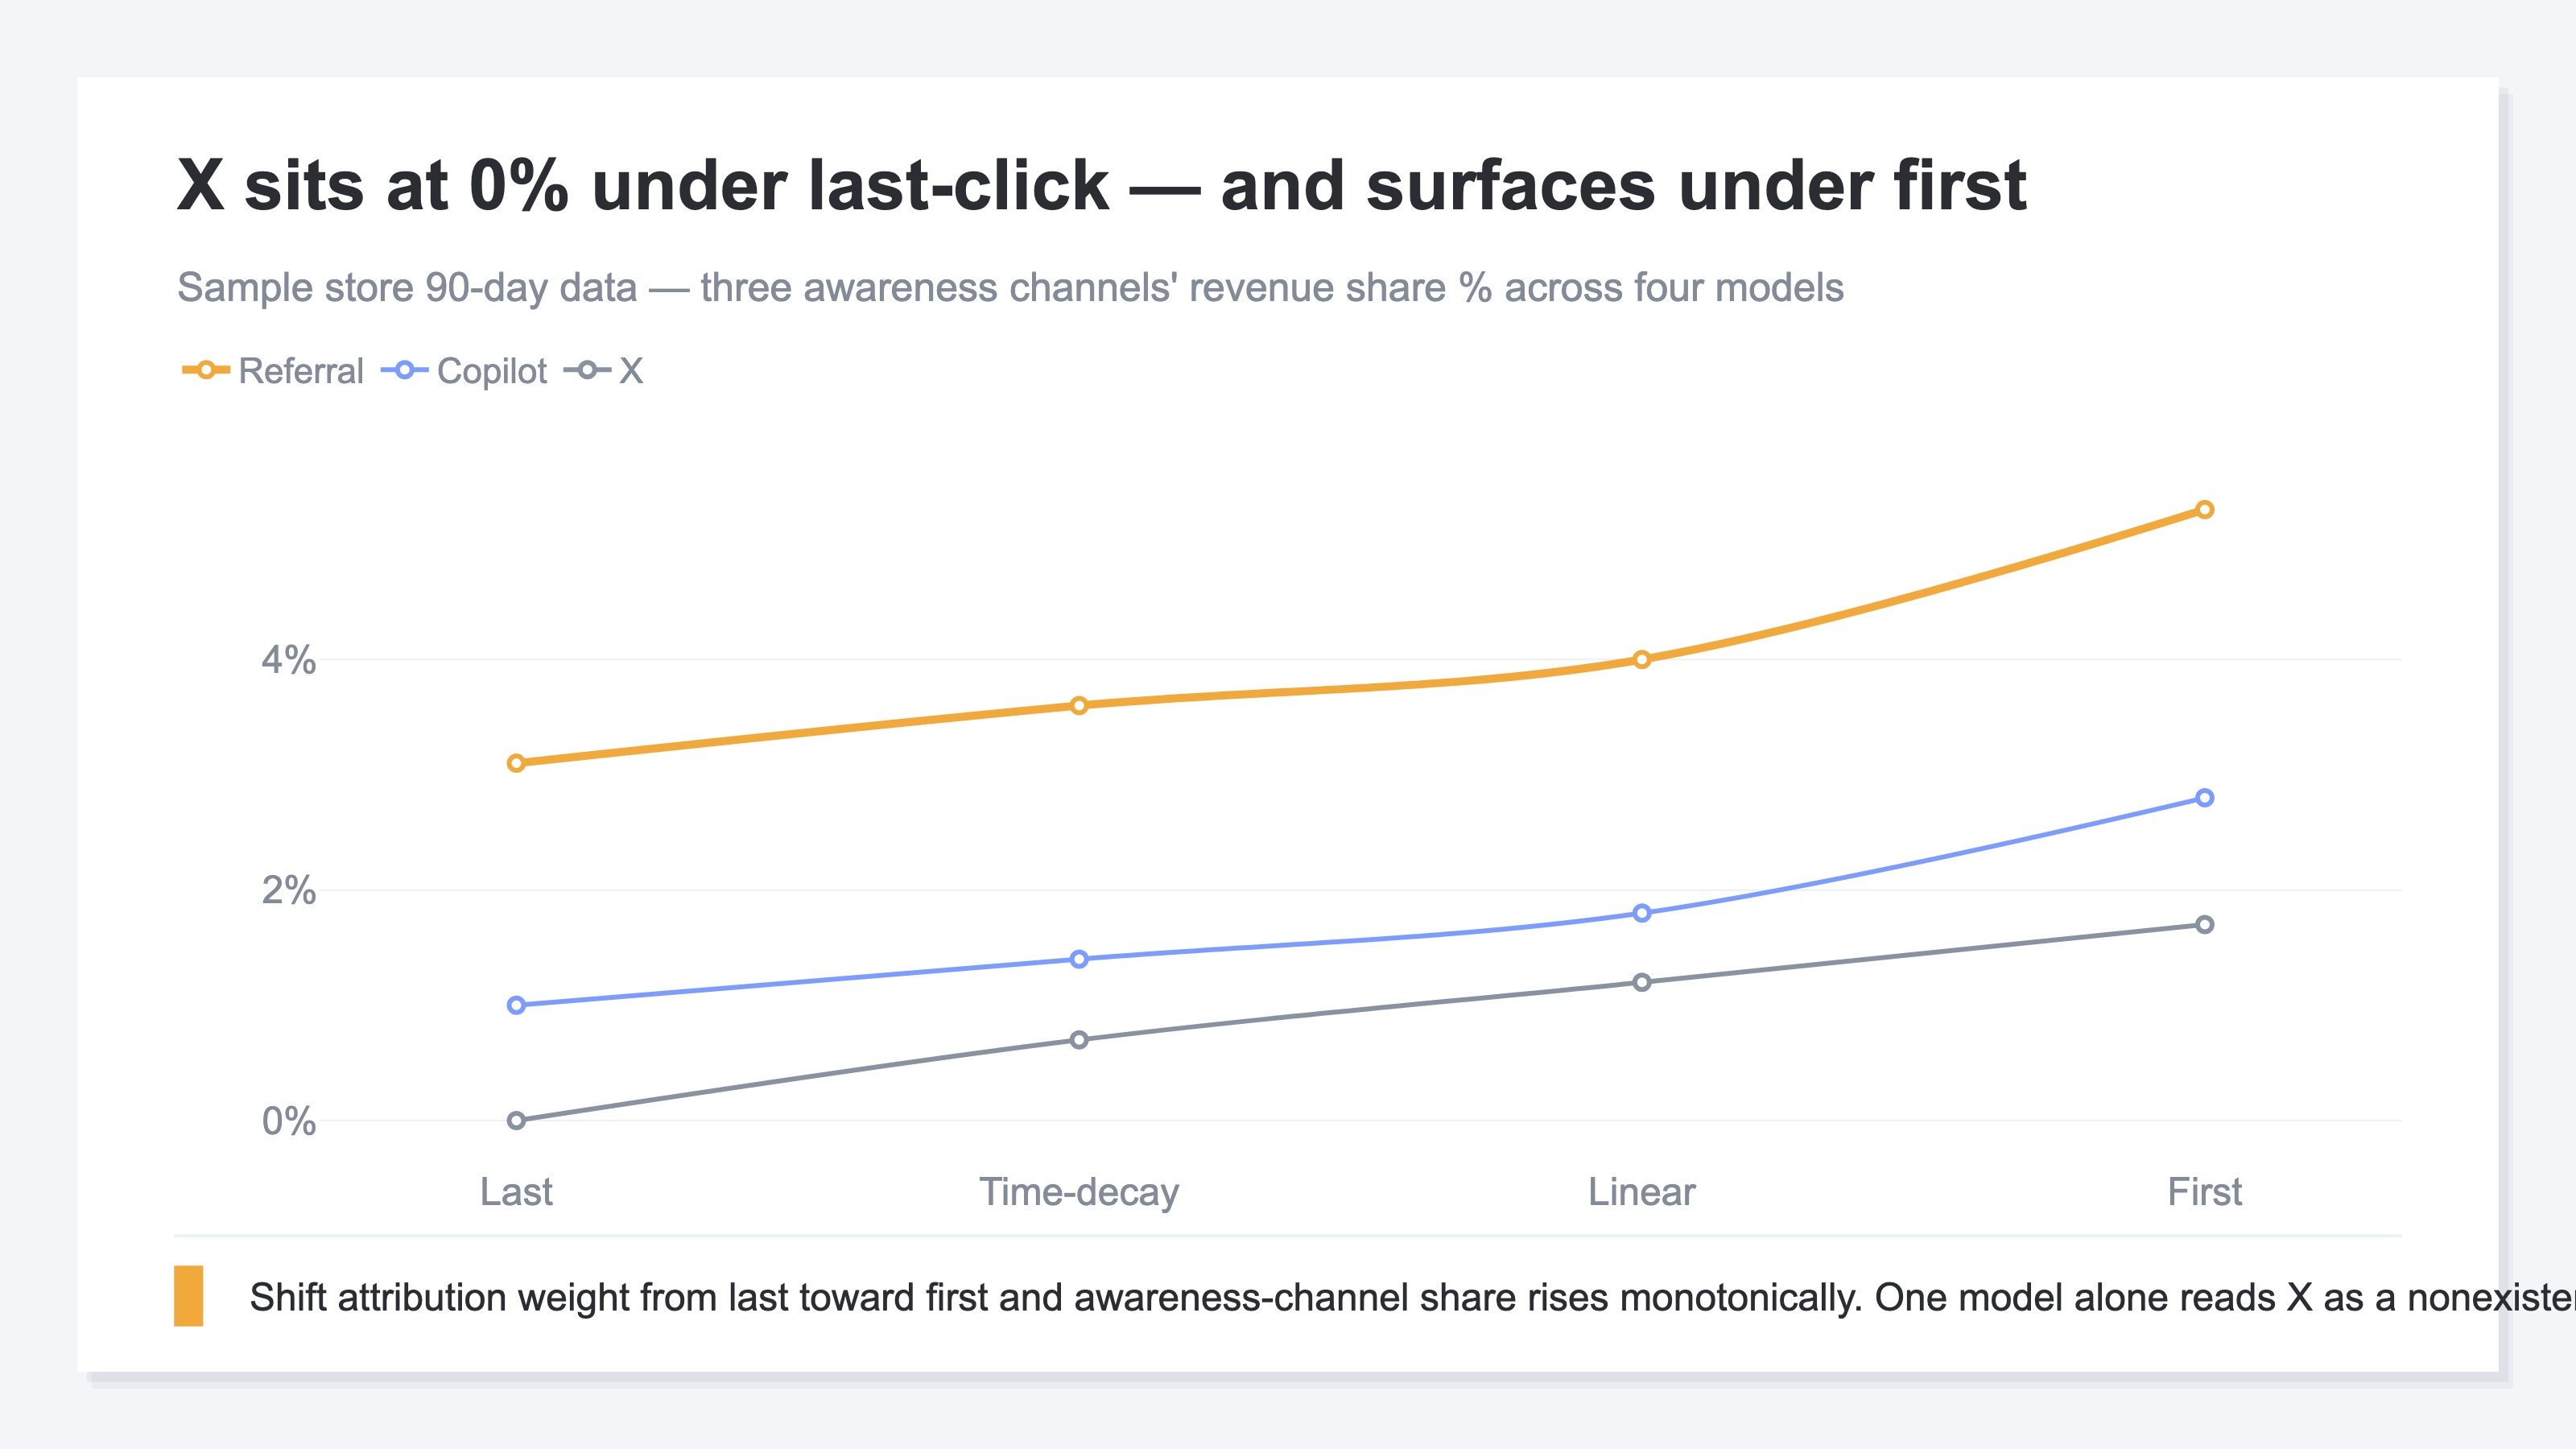
Line up the sample store's 90-day data across four models. Under last-click, Direct (30.1%) and Google Search (26.9%) hold over half the revenue share between them. X is 0.0% — on screen, it may as well not exist. Copilot is 1.0%, referral 3.1%. Read this view alone and "the awareness channels can be cut" seems reasonable. Switch to first-click on the same data and X surfaces at 1.7%, Copilot rises to 2.8% (roughly 2.8x), and referral to 5.3%. Claude moves from 4.8% to 6.1% and Meta from 6.0% to 7.7%, while Direct falls to 25.4% and Google Search to 23.5%. Linear and time-decay land in the middle — X at 1.2% and 0.7%, Copilot at 1.8% and 1.4%.
A channel at 0.0% under last-touch — completely invisible — surfaces the moment you switch to first-click. Two ways to read this. One: "cut the awareness channels and everything but last-click drops for you too." Two: line up "which channel is opening the door" against "which one closes the deal" and read the roles separately. Under last-click alone, gateway and closer blur together. First-click underrates the closer. Line both up, smooth them with linear and time-decay, and you can separate real losers you can trim from gateways you have to keep. For breakdowns at source/medium granularity, see GA4 Source Groups and revenue breakdown.
3. The limits of data-driven attribution, and how to reason with the four deterministic models#
Bottom line: DDA is more attractive on paper than in daily practice. Holding four deterministic models in parallel — and folding "model switch" into the weekly review — fits a mid-market store better.
DDA has three practical headaches. First, opacity. As an ML model, you can't reconstruct after the fact why one channel got the share it did — and if you can't explain the numbers in a budget-allocation meeting, trust in the model falls. Second, the volume prerequisite. GA's DDA has a recommended data volume, and channels below the threshold collapse into effective last-click. Many mid-market stores get caught by this. Third, history dependence. It learns from past patterns, so a newly tested channel gets rated low until it accumulates history. That's the worst pairing for testing new awareness channels.
Four deterministic models sidestep all three. The assignment rule is explicit, so you can always explain the numbers. There's no data-volume floor — the models run even with sparse data. There's no history dependence — the same logic applies to the last 90 days. The trade-off: each model is a rough approximation. That's precisely why "not settling on any one model, but laying out four in parallel" pays off. A channel that looks cuttable under last-click may have been a gateway under first-click or time-decay — that gap can be folded into the weekly decision. The way the lookback period itself shifts the picture is covered in The attribution lookback window.
RevenueScope helps
By now the value of running four models in parallel — and the reason not to lean solely on DDA — is clear. What's left is folding four-model comparison into daily operations. Switching models is possible in GA4, but you have to rebuild the exploration report four times and cross-reference revenue against sessions from a separate view. Doing this weekly is too heavy.
RevenueScope is built so last, first, linear, and time-decay switch with a single click — moving per-channel revenue and RPS, with sessions and engagement on the same screen. Pass an attribution_model parameter to get_breakdown (dimension=channel) and the moment you switch, per-channel revenue and RPS move. Sessions and engagement don't move when you switch — attribution only reassigns revenue, so the comparison base stays fixed while you compare how the revenue picture changes. No rebuilding a screen the way GA4 asks you to. Instead of DDA, RevenueScope honestly surfaces Unattributed (revenue that couldn't be tied to any channel) on the same view. Not hiding the numbers that look thin is the foundation for folding model comparison into a business decision (figures shown are demo data).
| Channel | Last | First | Linear | Time-decay |
|---|---|---|---|---|
| Direct | 30.1% | 25.4% | 27.7% | 28.6% |
| Google Search | 26.9% | 23.5% | 24.9% | 25.4% |
| ChatGPT | 14.2% | 15.0% | 14.5% | 14.5% |
| Meta | 6.0% | 7.7% | 6.6% | 6.6% |
| Claude | 4.8% | 6.1% | 5.3% | 5.0% |
| Google Ads | 3.8% | 3.5% | 3.6% | 3.6% |
| Perplexity | 3.8% | 3.1% | 3.8% | 4.1% |
| Gemini | 3.6% | 3.6% | 3.8% | 3.7% |
| Referral | 3.1% | 5.3% | 4.0% | 3.6% |
| Yahoo! Search | 2.6% | 2.3% | 2.6% | 2.4% |
| Copilot | 1.0% | 2.8% | 1.8% | 1.4% |
| X | 0.0% | 1.7% | 1.2% | 0.7% |
| Bing | 0.0% | 0.0% | 0.3% | 0.3% |
Actual output from the sample store (a fictional site with sample data). Shares of attributed revenue, totaling 100%. Unattributed — revenue that couldn't be tied to any channel — is 7.8% of all revenue, constant across the four models and kept as a separate line.
RevenueScope specializes in the four-model split with last-touch as default, plus per-channel revenue and RPS you can switch models against on the same screen (sessions and engagement sit alongside but don't move with the switch). Per-channel AOV and CVR live in campaign drilldowns and the site-wide summary. LTV, gross margin, and inventory sit outside RevenueScope's focus — pair it with dedicated tools there. What RevenueScope does is line up the four deterministic models on one screen and put the model switch one click away, so you can fold it straight into the weekly budget review and read awareness channels by role.
FAQ#
Frequently asked questions#
Q. If we adopt data-driven attribution, don't we not need the other four?
A. DDA looks attractive in theory, but opacity, volume prerequisites, and history dependence all get in the way of daily decisions. A model where you can't explain the split in a budget meeting, where channels below the threshold collapse into effective last-click, and where newly tested channels are rated low until they build history — that's a poor fit for testing awareness channels in particular. Running the four deterministic models in parallel keeps the reasoning behind each decision intact. RevenueScope doesn't implement DDA; it prefers deterministic four-model plus honest disclosure of Unattributed (revenue that couldn't be tied to any channel).
Q. Switching models weekly sounds time-consuming.
A. In GA4, switching between four models means rebuilding the exploration report four times. Revenue and session metrics live in separate views, so cross-referencing takes another step. That's a heavy weekly load. If a dashboard puts the four models one click apart on the same screen, the comparison itself takes minutes. Whether you fold it into the weekly decision depends on whether the weight of comparing drops.
Q. Wouldn't the numbers look cleaner if we hid Unattributed?
A. Cleaner, yes — but you're giving up honest disclosure. Consent withdrawals, ad blockers — revenue that can't be tied to any channel always exists. Redistributing that share across other channels reports revenue those channels didn't actually earn, and drains the meaning out of model comparison. RevenueScope keeps Unattributed as its own row on the same screen, and also shows how (or whether) that value moves when you switch models. On the sample store it stays at 7.8% of all revenue, identical across the four models.
Summary#
On the same revenue, switching attribution model shifts how awareness channels — X, Copilot, referral — rate. On the sample store, X sat at 0.0% by last-click — completely invisible — and surfaced at 1.7% by first-click, while Copilot moved from 1.0% to 2.8%, roughly 2.8x.
Judging by last-click alone tilts you toward cutting the awareness gateways. With a lag, new sessions thin out and revenue drops later. To avoid that, line up last, first, linear, and time-decay in parallel and read gateway and closer roles separately. DDA is attractive on paper, but opacity, volume prerequisites, and history dependence all make it awkward as a daily tool.
RevenueScope switches four deterministic models on one screen (what moves is per-channel revenue and RPS — sessions and engagement stay fixed) and honestly discloses Unattributed alongside. DDA is off by design. Whether you can fold model comparison into the weekly budget decision is what determines whether you can keep your awareness channels from being over-cut.
See which ads actually drive revenue, at a glance
Free up to 2,000 sessions/month, AI connection included. No credit card required. Up and running in 5 minutes.