GA4 has added Source Group, a new dimension that groups referrers together (June 2026). Referrers that used to be recorded separately — instagram, ig, and the like — now collapse cleanly into a single "Instagram." The cleaner view is, plainly, a step forward. But judge your budget on that rolled-up grain and you'll misread which campaigns are working. "Looking clean" and "being able to make the investment call per campaign" are two different things. This article covers what changed with Source Group, then works through — with sample-store data — why you misjudge unless you divide all the way down to revenue efficiency per campaign.
Contents
TL;DR#
-
GA4 added Source Group, and scattered referrers now group cleanly
Variants like "%instagram%" and "ig" line up under a single "Instagram." The granular referrer data stays right where it was.
-
Judge on the rolled-up grain and you'll misread campaigns
The RPS on a rolled-up line is an average. The differences among the campaigns inside it get flattened into that average.
-
Campaign quality is decided by revenue efficiency — Revenue Per Session (RPS) — not by session count
Even at similar session counts, revenue per session ranges from ¥0 to ¥446 across campaigns (sample store).
-
A rolled-up line only becomes decisionable once you split it by campaign and sort by revenue efficiency
Rolled-up grasp from GA4, budget calls down to per-campaign RPS — that division of labor is what makes you less likely to miss.
1. How Source Group Changes the Way Referrers Look#
Source Group is a new GA4 dimension that rolls scattered referrer values up into a higher-level category [1]. It was added in June 2026. Referrers whose spelling varied — "%instagram%," "ig" — now line up under a single name, "Instagram."
The first thing to pin down: Source Group is one added way of looking — a rolled-up view laid on top. The granular source/medium data stays exactly as it was before. Source Group simply adds one rolled-up layer above it. The detailed values are still in your hands; you've just gained a summarized view. That's the accurate way to read it.
A similar thing happened a little earlier over in Google Search Console (GSC). But this is a different animal. GSC's new feature is about "exposure in search" (impressions, clicks); Source Group here is about "traffic that arrived at your site" — the GA4 side. The data's origin (GSC vs. GA4) and what it looks at (search exposure vs. site traffic) are both different. The GSC side is gathered in GSC's platform property — exposure is visible, revenue is another matter.
The cleaner, more grouped view is a step forward. But a rolled-up grain, handy as it is for "grasping traffic in broad strokes," isn't enough on its own for deciding "which campaign to add budget to." The next section shows why.
2. Why the Rolled-Up Grain Makes You Misjudge Campaigns#
A rolled-up grain (Source Group, or the default channel grouping [2]) flattens the differences among the campaigns inside it into one average. So judging on a rolled-up line's number alone, you can't tell the winning campaigns from the losing ones.
Concretely: look at the sample store's "Meta Ads" as a single line, and its RPS — Revenue Per Session, the average revenue per incoming session — is ¥109. Hear "¥109" and it looks like a middling campaign, neither good nor bad.
But split that Meta Ads line by campaign and the picture changes entirely. The retargeting campaign runs an RPS of ¥201 — nearly double the rolled-up average. Meanwhile one prospecting campaign sits at ¥132, and a certain lookalike-audience campaign posts an RPS of ¥0. Inside that one "Meta Ads" line, a campaign that's selling well and a campaign still at zero revenue live side by side.
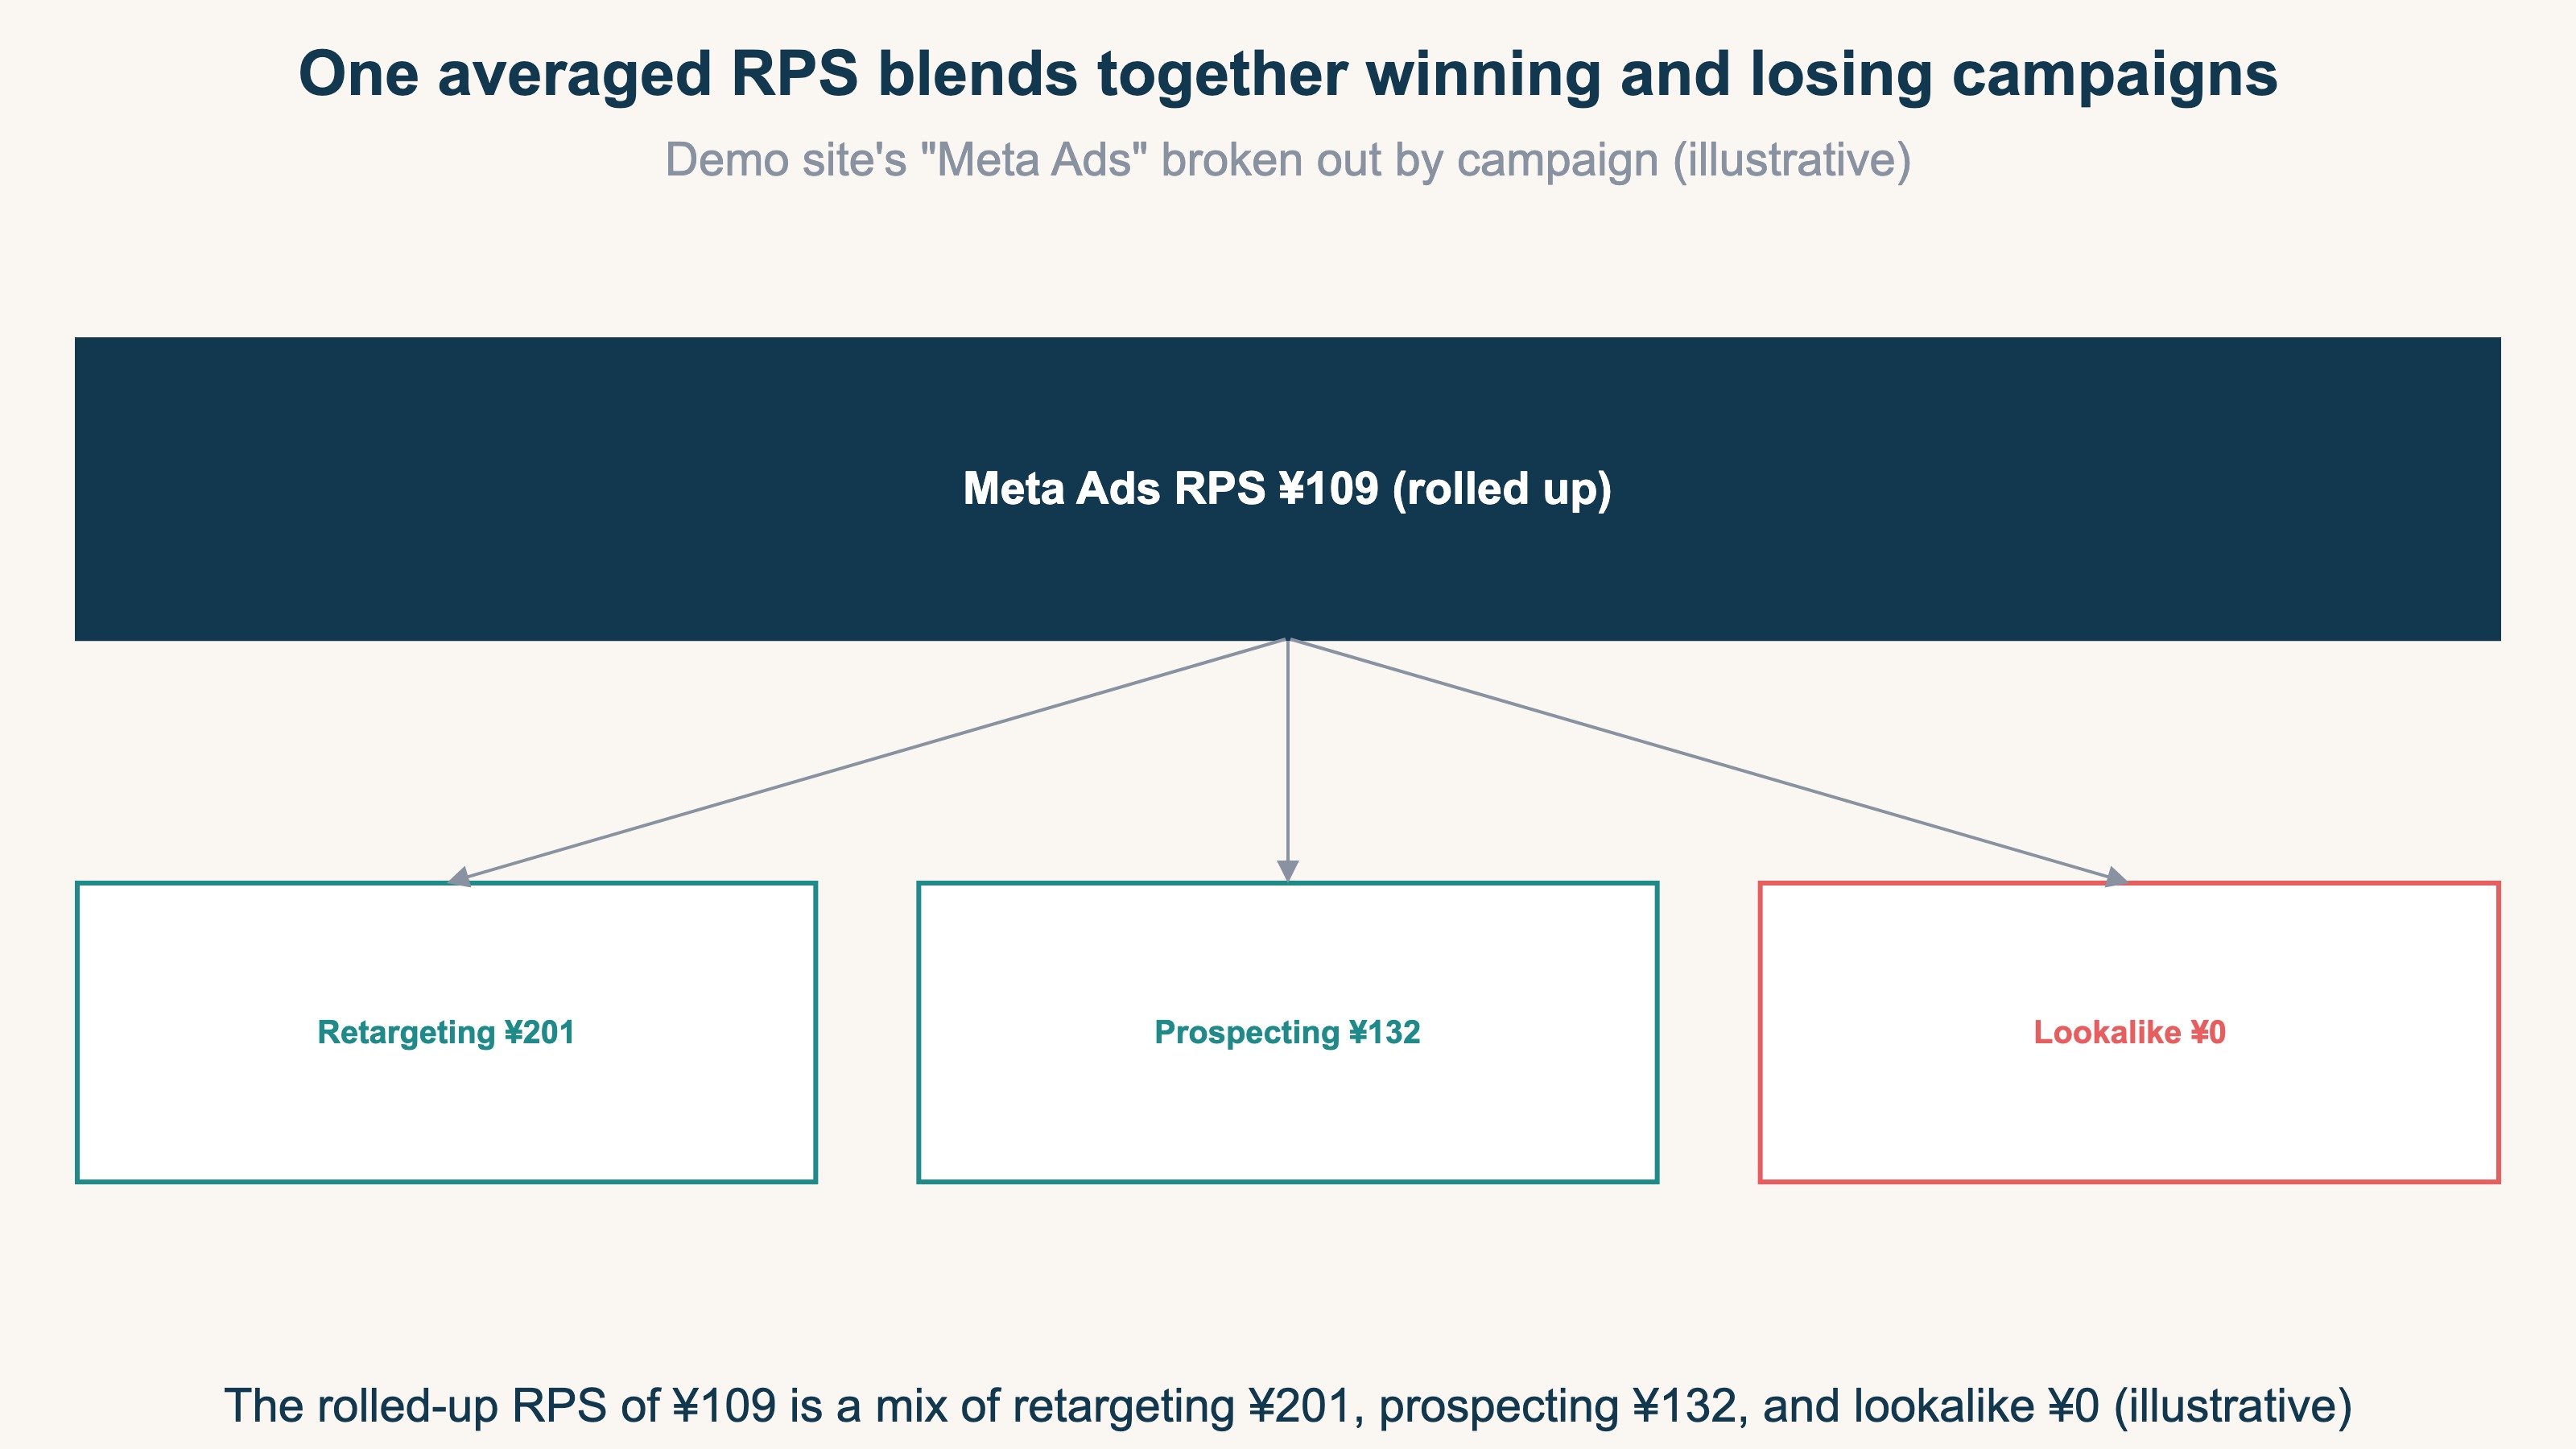
Look only at the ¥109 average and you'll never see this gap. Judgment stops at "Meta Ads is about average." Which means you can't add budget to the retargeting you should actually be scaling, and you can't stop the zero-revenue campaign — a misread in both directions. The cleaner the rolled-up grain, the easier it is to read "one line = one level of performance," and that's the tricky part.
3. Campaign Quality Only Shows When You Divide by Revenue Efficiency#
A campaign's quality is decided by revenue efficiency (RPS), not by how many sessions it pulls. Even when campaigns gather roughly the same sessions, revenue per session spreads widely across them.
Take that same sample store and line the campaigns up by both session count and RPS. What's striking is that the session counts barely differ — every campaign sits around 37 to 50. Look only at the volume of traffic each pulls, and they all look much the same.
RPS, though, spreads from ¥0 to ¥446. One branded campaign, for instance, gathers 43 sessions but sells ¥0. A Google Ads P-MAX campaign pulls 37 sessions — nearly the same count — yet its RPS is ¥446. Similar volume gathered, opposite outcomes in how they sell.
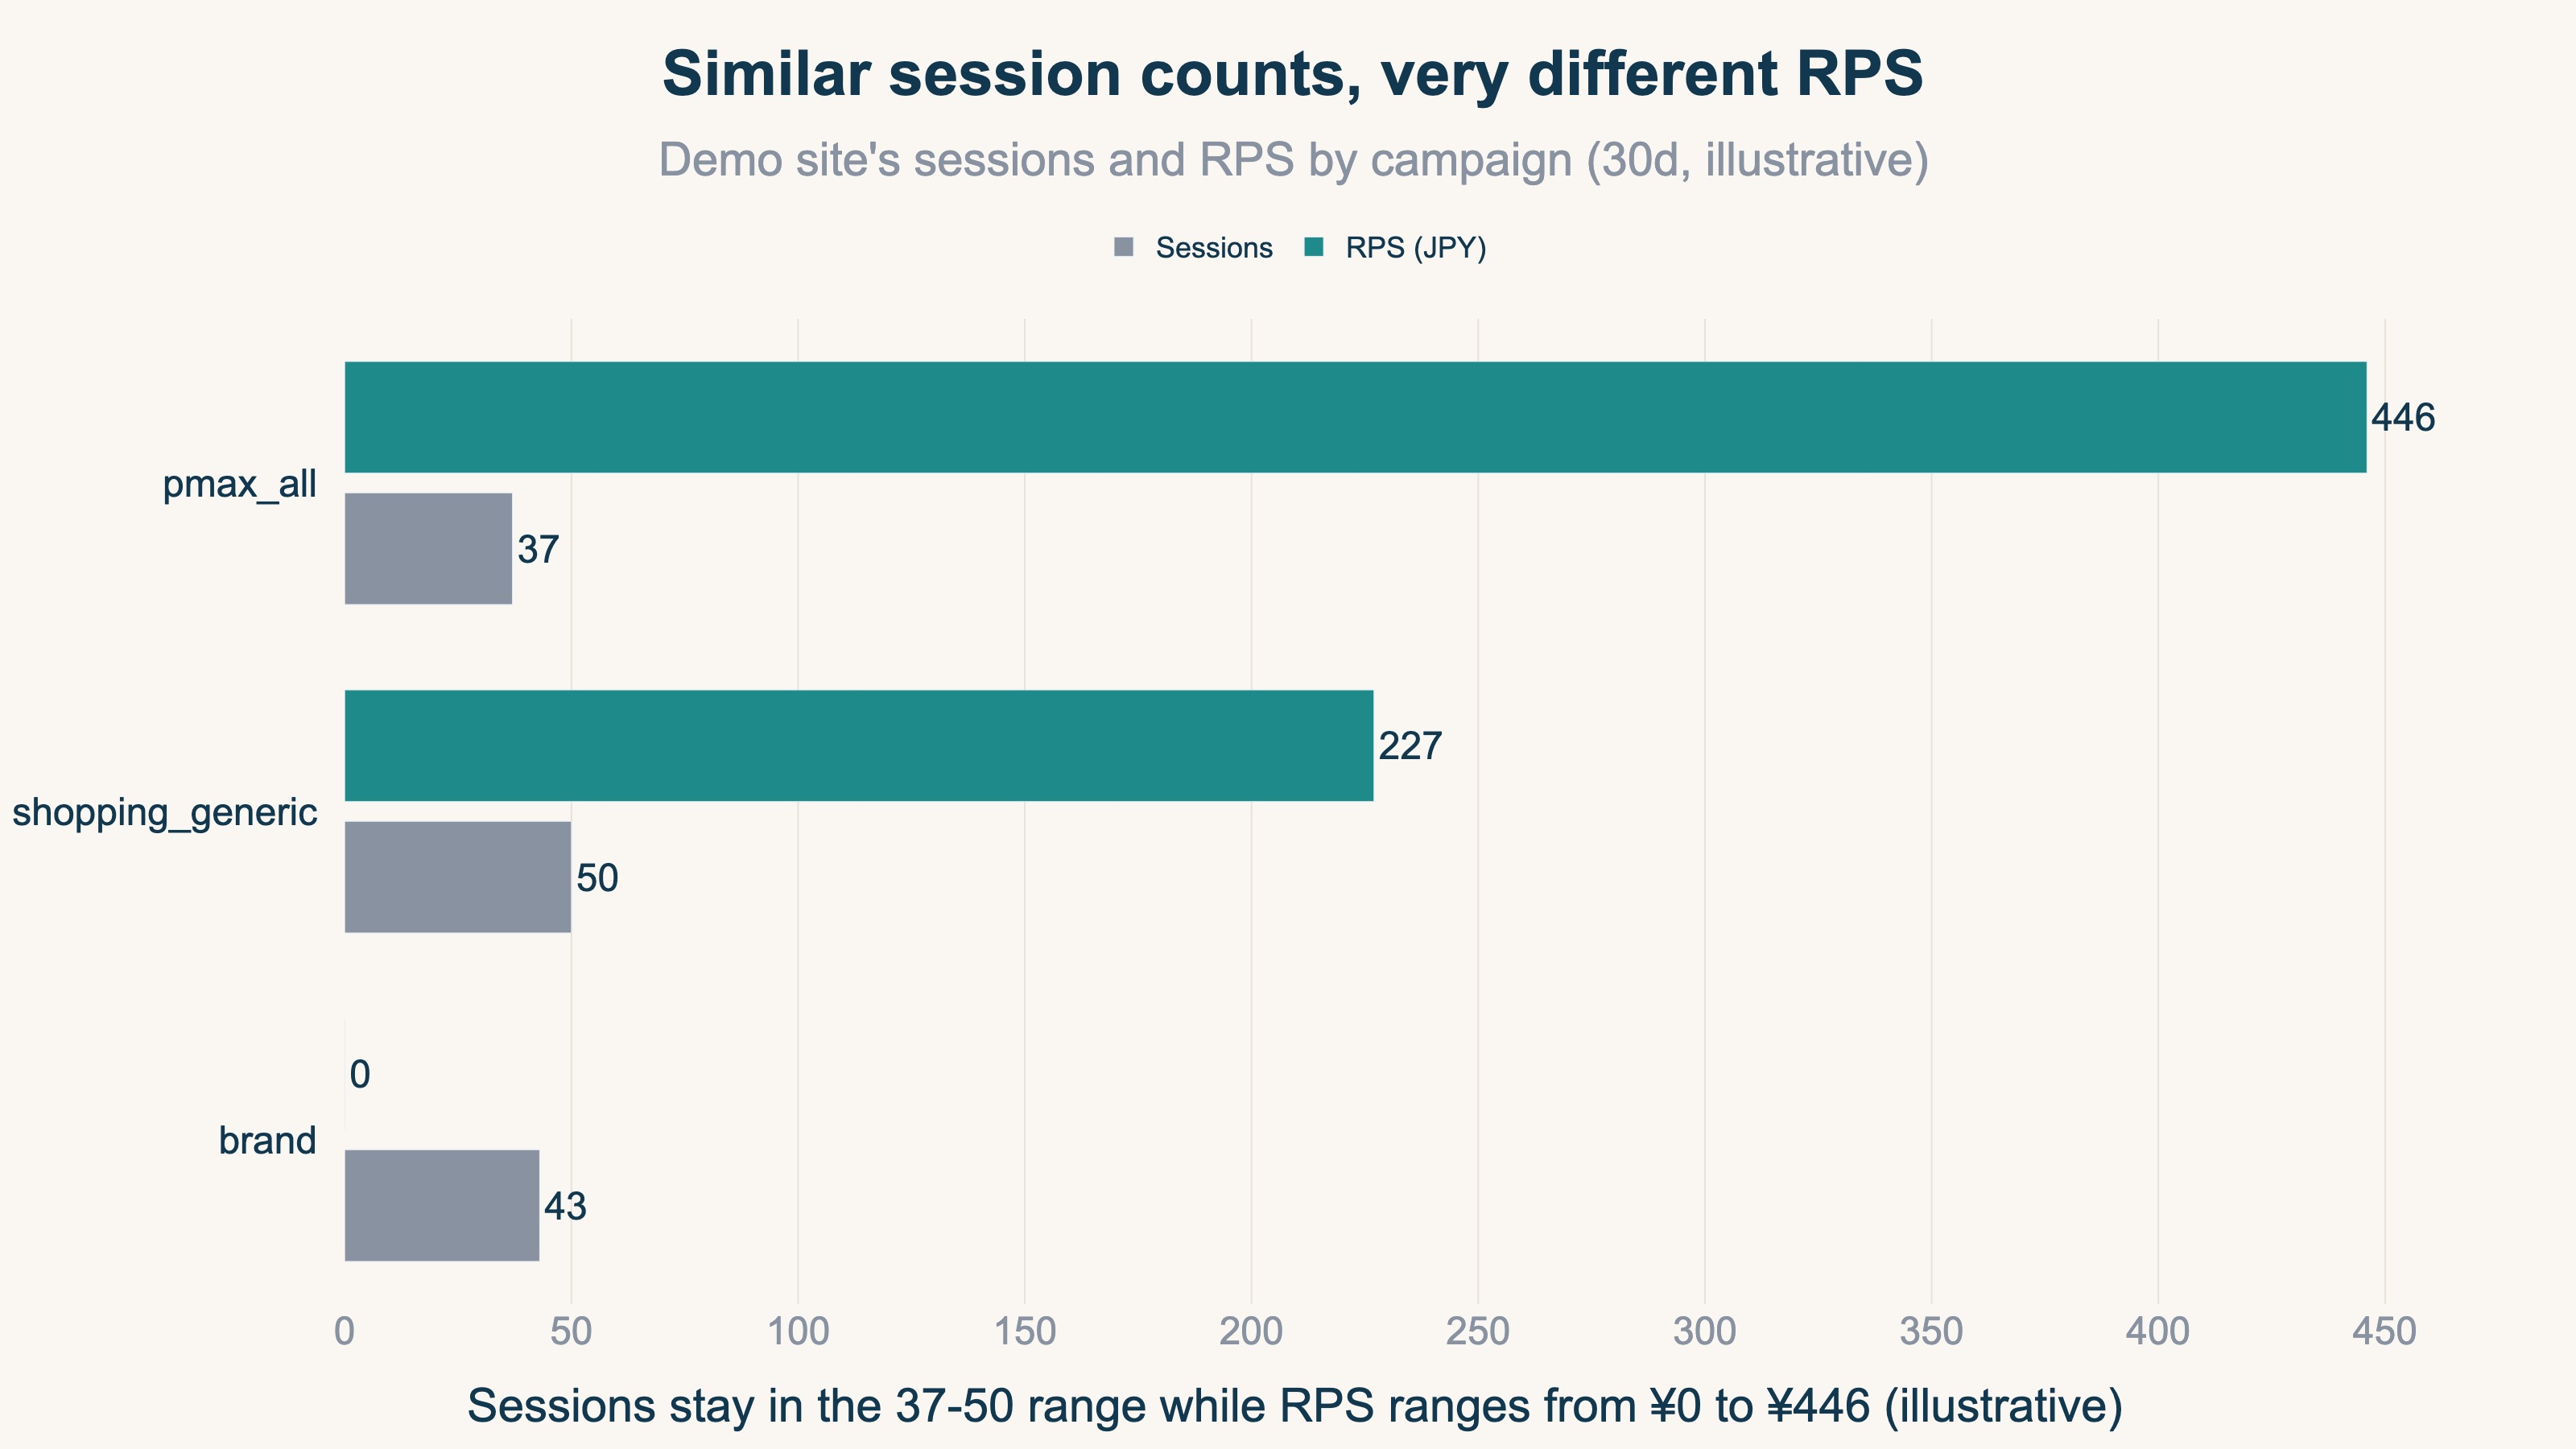
So evaluating a campaign by "how many sessions it gathered" isn't enough. Only once you divide down to "how much those sessions sold" can you make a call to move budget. Gazing at a rolled-up line's session count or total revenue will never get you to this gap. Tag your links with UTM parameters (the markers that record where traffic came from — you attach utm_campaign and the like to a link [3]) per campaign, and you've built the foundation for this division. Traffic you forget to tag can't be traced back to its referrer and falls into (direct)/(none), so that one piece is worth sorting out up front.
You can see the per-campaign breakdown in GA4 too. Add "Campaign" as a secondary dimension in a report and you can follow sessions and purchase counts by campaign. That much gives you the direction. But working out "how much each campaign sold per session (RPS)" or "average order value (AOV)" per campaign takes an extra step. And re-ranking that across every channel each time gets heavy fast by hand. The idea is simple; the repetitive labor is the bottleneck.
RevenueScope helps
RevenueScope splits a channel by campaign and returns sessions, revenue, RPS, and average order value (AOV) on one screen. The "channel worth a look" you spotted on the rolled-up grain, you can open right there by campaign and confirm which campaign is doing the selling.
What RevenueScope takes on is what comes after the broad-strokes grasp GA4 does well — splitting a rolled-up line by campaign and lining it up by revenue efficiency. It connects grasp (GA4) and the revenue efficiency you need for budget calls (RevenueScope) as separate layers.
Here's how it actually looks, with sample-store data. Open the single "Google Ads" line — average RPS ¥214 — by campaign, and you get this.
Sample store: "Google Ads" split by campaign (30 days)
| Campaign | Revenue (JPY) | RPS (JPY) |
|---|---|---|
| Google Ads total | 27,839 | 214 |
| pmax_all | 16,492 | 446 |
| shopping_generic | 11,347 | 227 |
| brand | 0 | 0 |
Figures from a fictional store with sample data (RevenueScope demo). RPS is revenue per session, and revenue is a snapshot of the current 30 days (no prior-period comparison shown). Gross margin and LTV aren't covered.
Open up the rolled-up "Google Ads" ¥214 and it was a blend of ¥446, ¥227, and ¥0. The P-MAX campaign sells more than double the rolled-up average; the branded (brand) campaign gathers 43 sessions and sells ¥0. When those two sit inside a single ¥214, the campaign to scale and the campaign to stop both blend into the same number. Split by campaign, and the next move — lean into P-MAX, rethink the branded campaign — becomes something you can actually decide.
RevenueScope also takes revenue that tied to no channel and shows it as a separate line, "Unattributed." You can switch the attribution model (last click, first click, and so on) and compare where revenue lands. How to handle unattributed revenue is gathered in revenue that ties to nothing (Unattributed).
The same thing happens with AI-driven traffic. Traffic from AI answers also tends to get grouped by referrer, so AI-driven revenue is easily rounded into broad strokes. Split it here by channel and by campaign too, and the AI traffic that's selling separates from the AI traffic that isn't.
RevenueScope specializes in returning revenue-based metrics — revenue, RPS, AOV, and CVR (the purchase rate per session) — broken down by channel and by campaign. Splitting a rolled-up line by campaign and deciding where to add budget by revenue efficiency — that much, you can move on today.
FAQ#
Q. If I set up Source Group, will I see revenue by campaign?
A. No. Source Group is a dimension for viewing scattered referrers cleanly grouped; its role is "grasp." To see revenue efficiency per campaign, you have to split by campaign and get down to revenue per session (RPS). That sits outside Source Group's range.
Q. If a rolled-up channel's RPS is good, can I assume all the campaigns inside it are good too?
A. No. A rolled-up RPS is an average. Sometimes a zero-revenue campaign is mixed in. Even in the sample store, Google Ads' ¥214 average held both a ¥446 campaign and a ¥0 one. The safe move is to split by the campaigns inside and check.
Q. Can I see the per-campaign breakdown in GA4 alone?
A. Yes, as far as the direction. Add "Campaign" as a secondary dimension in a report and you can follow sessions and purchase counts by campaign. But splitting down to RPS and AOV per campaign, and re-ranking across all channels each time, gets heavy by hand. Returning that re-ranking on one screen is what RevenueScope takes on.
Summary#
GA4 added Source Group, and scattered referrers now group cleanly. Plainly, a step forward. But a rolled-up grain, handy for "grasp," isn't enough on its own for the call of "which campaign to add budget to." The RPS on a rolled-up line is an average, and inside it sit both selling campaigns and zero-revenue ones. Even in the sample store, Google Ads' ¥214 average opened up into a blend of ¥446, ¥227, and ¥0. Decide campaign quality by revenue efficiency (RPS) per campaign, not by session count. Grasp your grouped referrers in GA4, then make the budget call only after splitting down to per-campaign revenue efficiency. That order is the hardest view to get wrong.
See which ads actually drive revenue, at a glance
Free up to 2,000 sessions/month, AI connection included. No credit card required. Up and running in 5 minutes.