When you run several campaigns in the same ad channel at once, "which campaign sold most efficiently?" turns out to be surprisingly hard to see. Clicks and spend show up in the dashboard right away, but how much each visit actually sold takes a calculation of your own. This guide walks through how to use UTM tags to compare revenue efficiency by campaign, and decide the next campaign to fund by the numbers.
Have you ever raised the budget on a high-click campaign, only to watch revenue fail to follow? If so, the number you were watching may have stopped at "clicks." How a campaign actually sells only becomes clear one level down, at the campaign unit.
Table of Contents
TL;DR#
-
Campaign-level revenue efficiency means reading "revenue per visit" for each campaign
utm_campaign is the UTM tag field that records which campaign a visit came from within one channel
-
The campaign with the most clicks or spend isn't always the one that sold efficiently
Clicks are the volume of traffic; how much each visit sold (RPS) is a separate number
-
Lining up RPS, order value, and purchase rate per campaign reveals the gap in efficiency
Side by side, the three show which campaign just gathered numbers through cheapness
-
Once efficiency by campaign is lined up, you can choose the next campaign to fund by the numbers
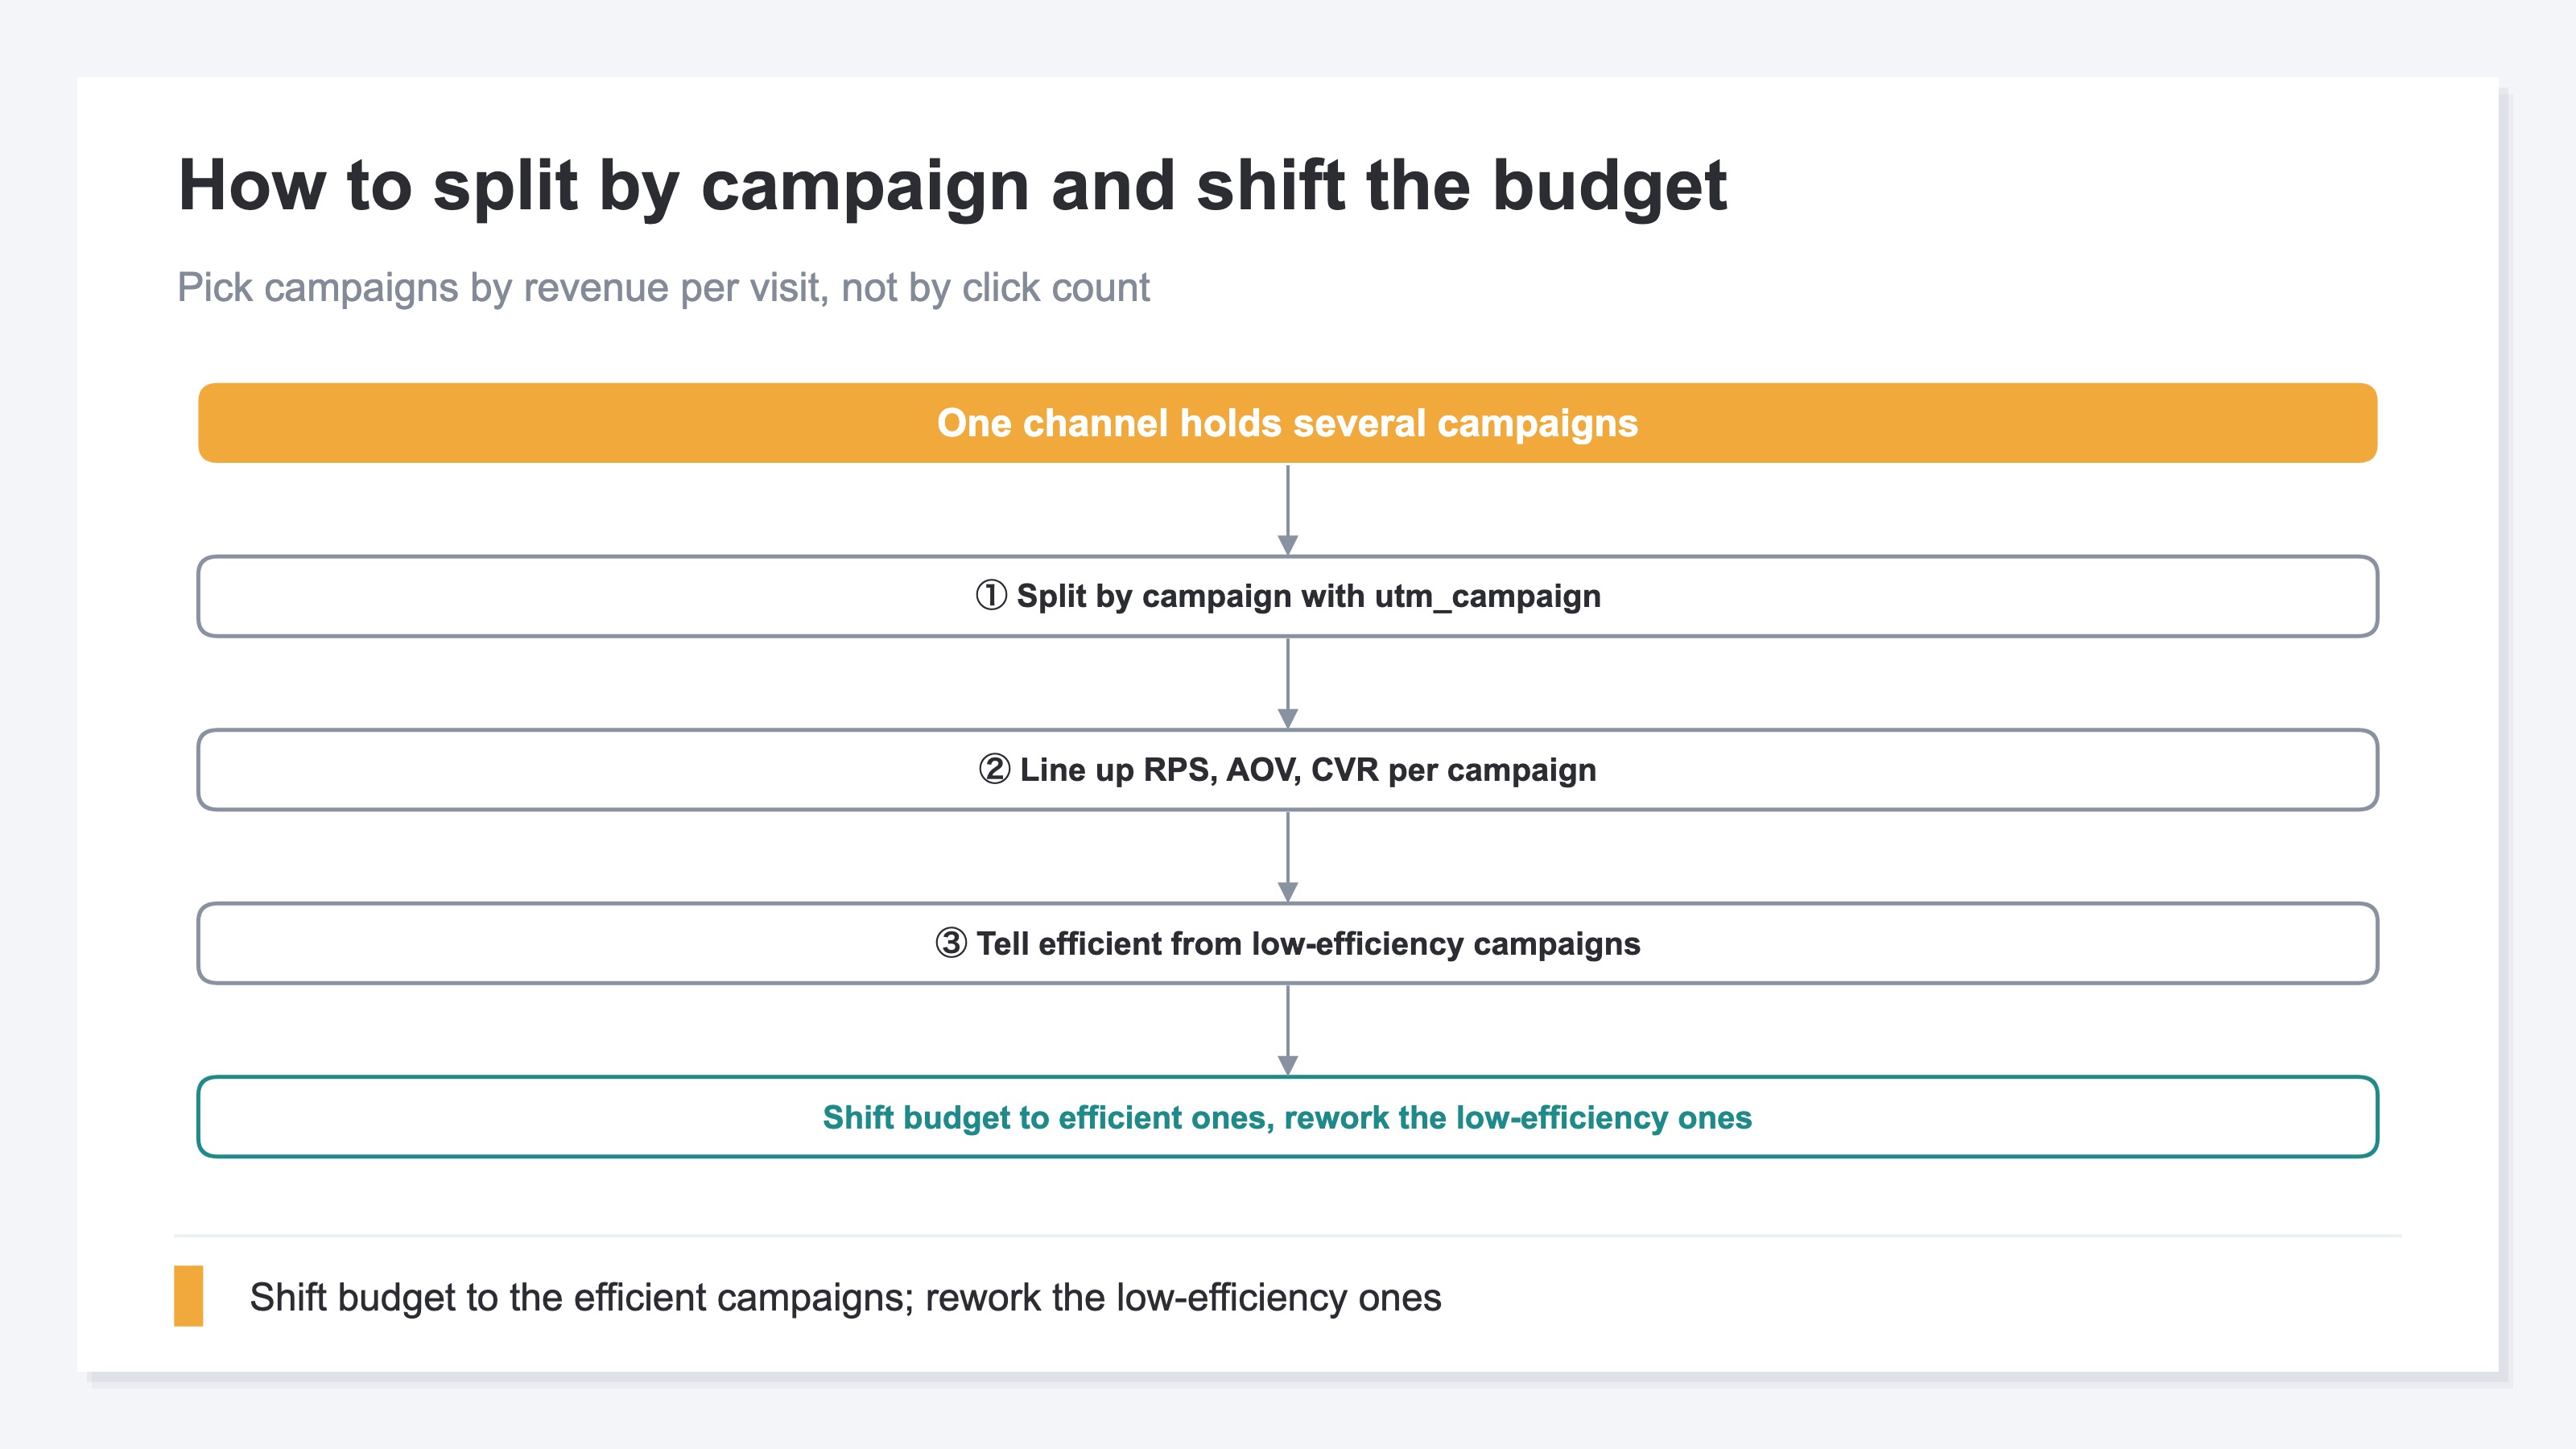
Pick campaigns by revenue per visit, not by gut feel
1. What reading revenue by campaign means#
Reading revenue by campaign means looking, within one ad channel, at how efficiently each individual campaign sold.
The field to use here is the UTM tag utm_campaign. A UTM tag is a marker added to an ad link that records where a visit came from. Within it, utm_campaign shows "which campaign a visit came from." For example, even within the same Instagram ads, if you separate the marker for a lowest-price campaign, a free-shipping campaign, and a new-arrivals campaign, you can later split revenue by campaign. Tagging itself is covered in the correct way to use UTM parameters, so here we focus on how to read them once they're set.
GA4's standard report groups traffic by channel (ads, search, newsletter, and so on). That's a handy starting point, but when several campaigns run inside one channel, the breakdown inside isn't visible in the standard view. The campaign unit is one level below the channel. Reading channel-level RPS was the topic of channel-level revenue efficiency. This article steps one level down, into the campaigns inside a single channel.
2. More clicks or spend isn't more efficient selling#
A campaign with many clicks or much spend is one that gathered a lot of people. But that isn't the same as one that sold efficiently.
Click count is right there the moment you open the dashboard. So it's easy to read a high-click campaign as "the winner." But what clicks show is the volume of traffic; how much that traffic turned into revenue is a separate number. A campaign that leads with cheapness earns clicks easily, yet many visitors grab the single cheapest item and leave, so revenue per visit struggles to grow.
The number to read instead is RPS (revenue per session). RPS shows "how much, on average, one visit sold." A campaign with many clicks but low RPS gathered people but had trouble turning them into revenue. As the figure below shows, this gap appears clearly between campaigns even within the same channel.
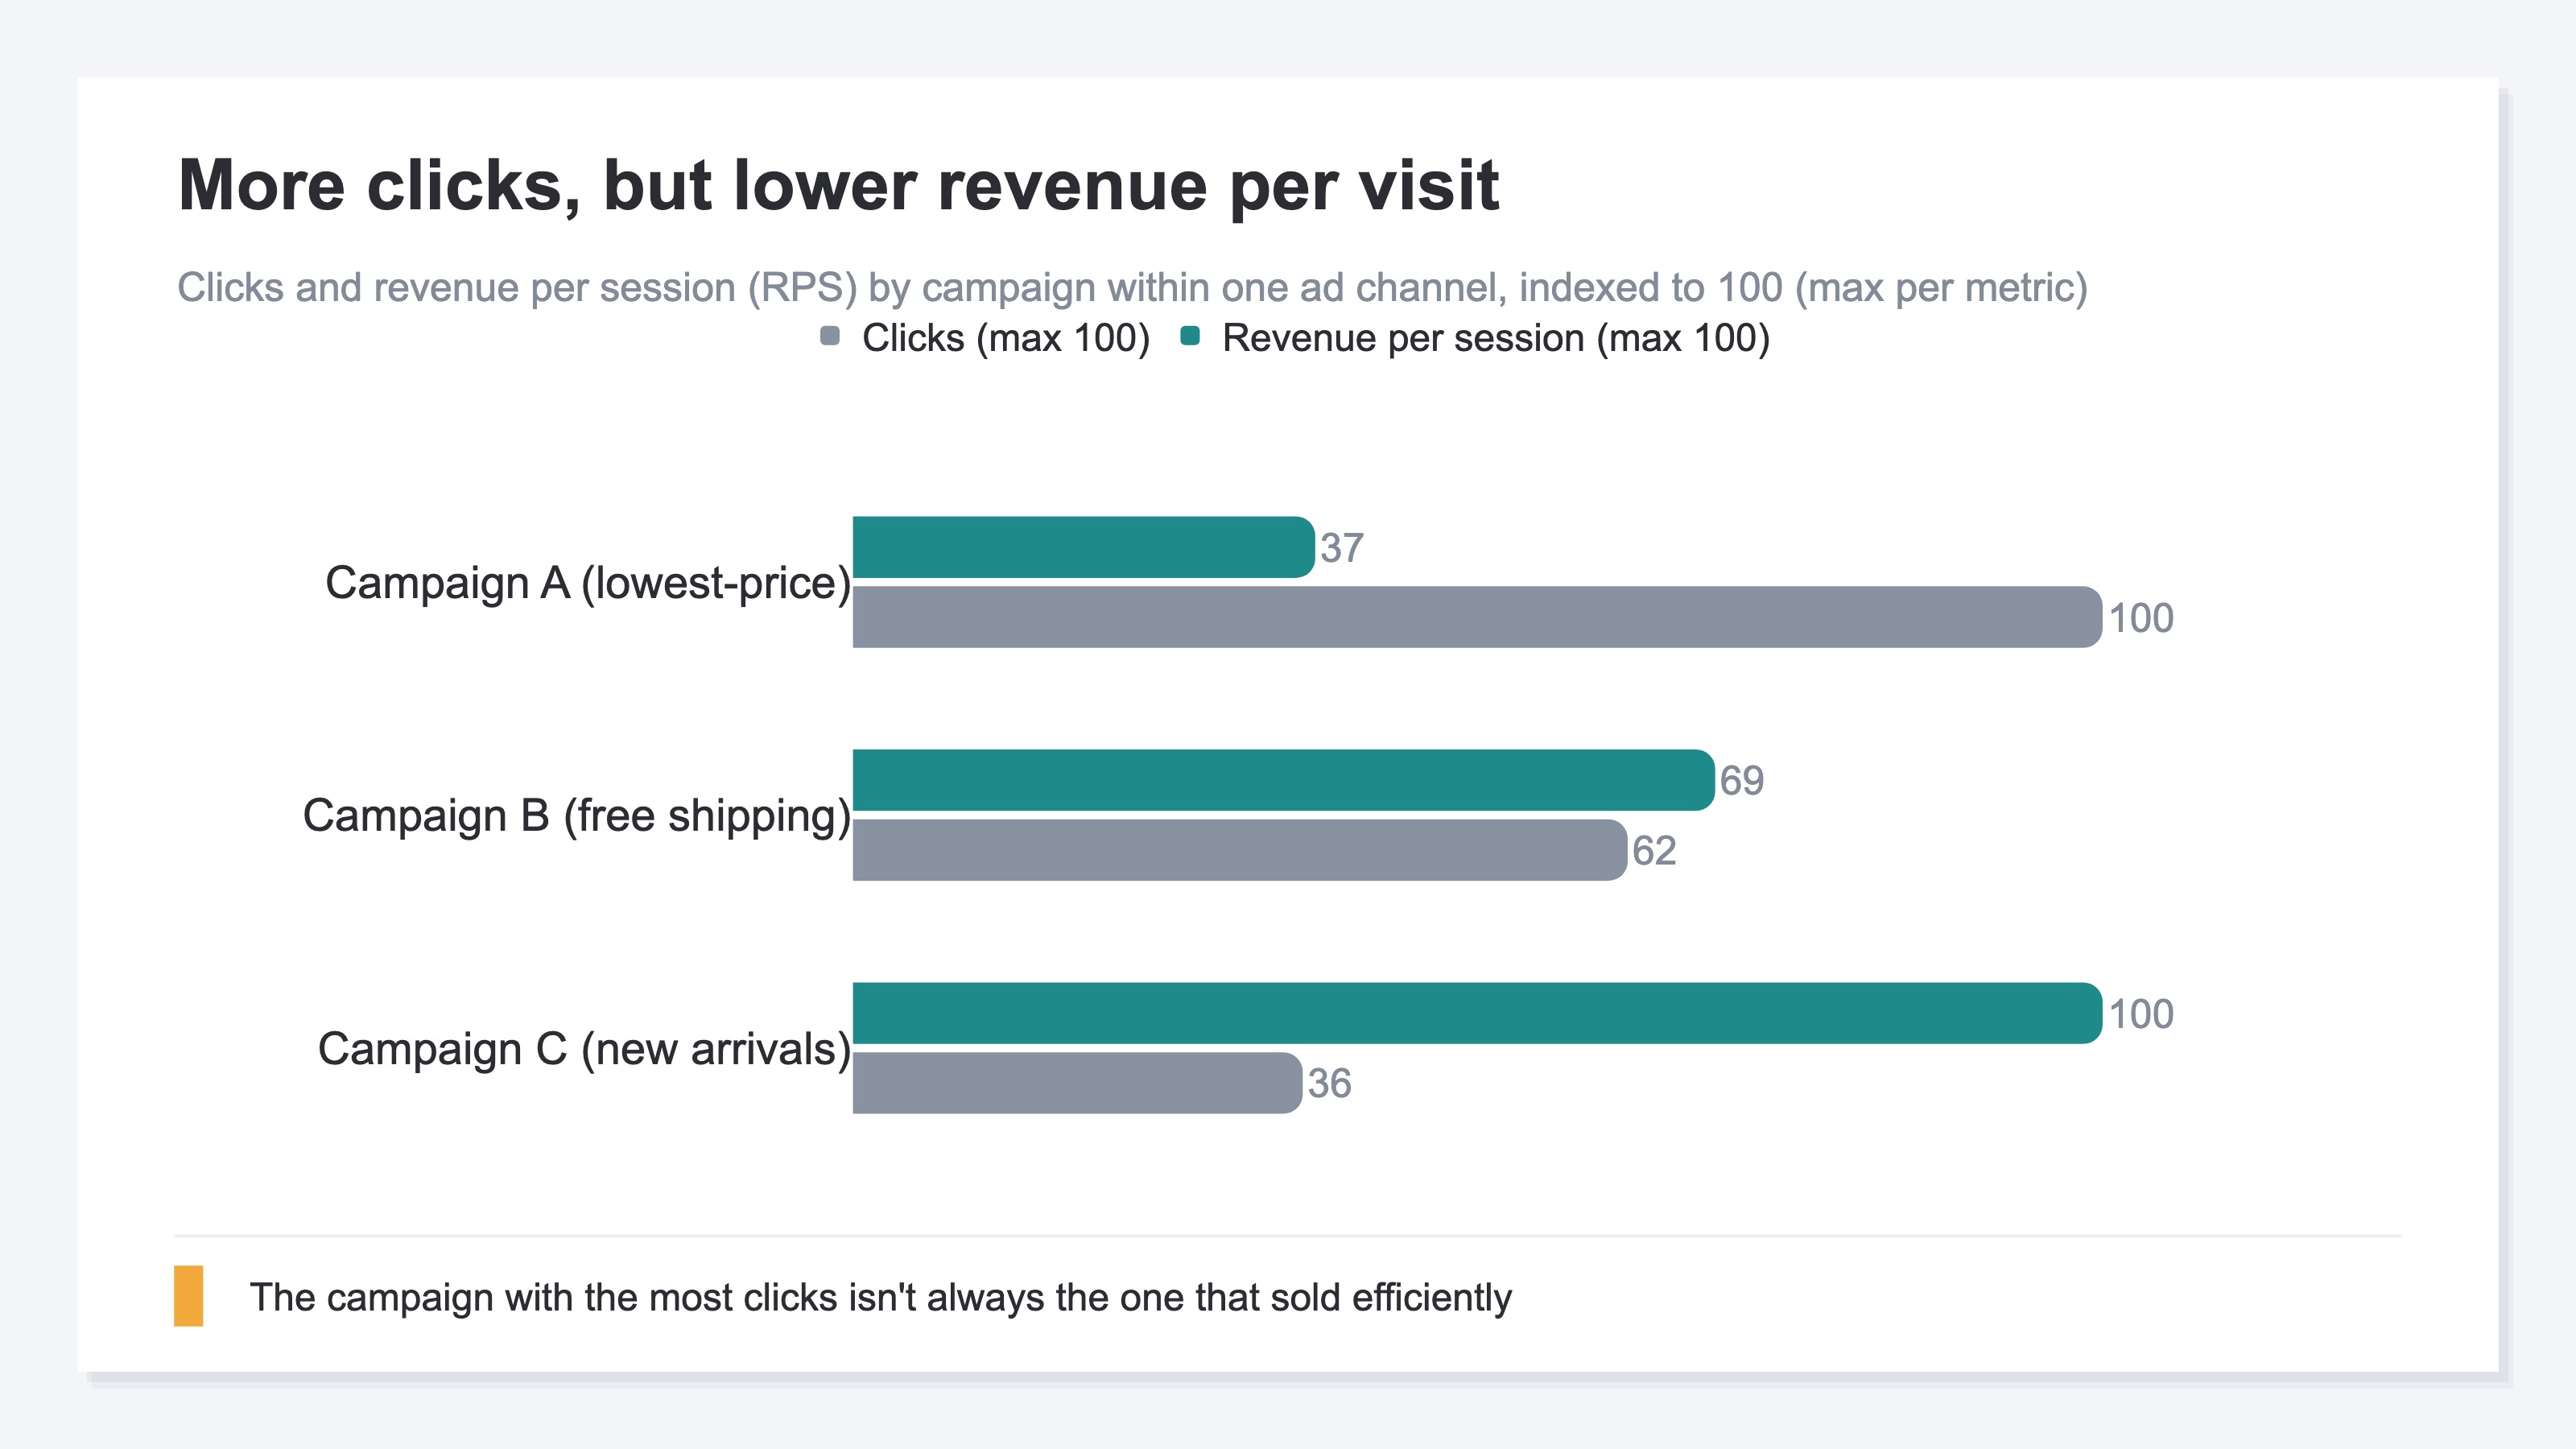
Campaign A, leading with the lowest price, has the most clicks but the lowest RPS. Campaign C, introducing new arrivals, has fewer clicks but higher RPS. Raise the budget on clicks alone, and you'd pour it into A, which is actually the less efficient one. Judge a campaign by revenue per visit rather than volume, and the way you pick changes.
3. Three metrics to read per campaign#
To read by campaign, line up three numbers: RPS, order value, and purchase rate. These three show even why efficiency differs.
RPS is one number, but it splits into two parts. RPS is order value times purchase rate.
RPS (revenue per session) = AOV (order value) × CVR (purchase rate)
AOV (order value) is how much, on average, one order bought. CVR (purchase rate) is what share of visits bought. When RPS is low, the move differs depending on whether order value is low, purchase rate is low, or both. That's why you line up all three.
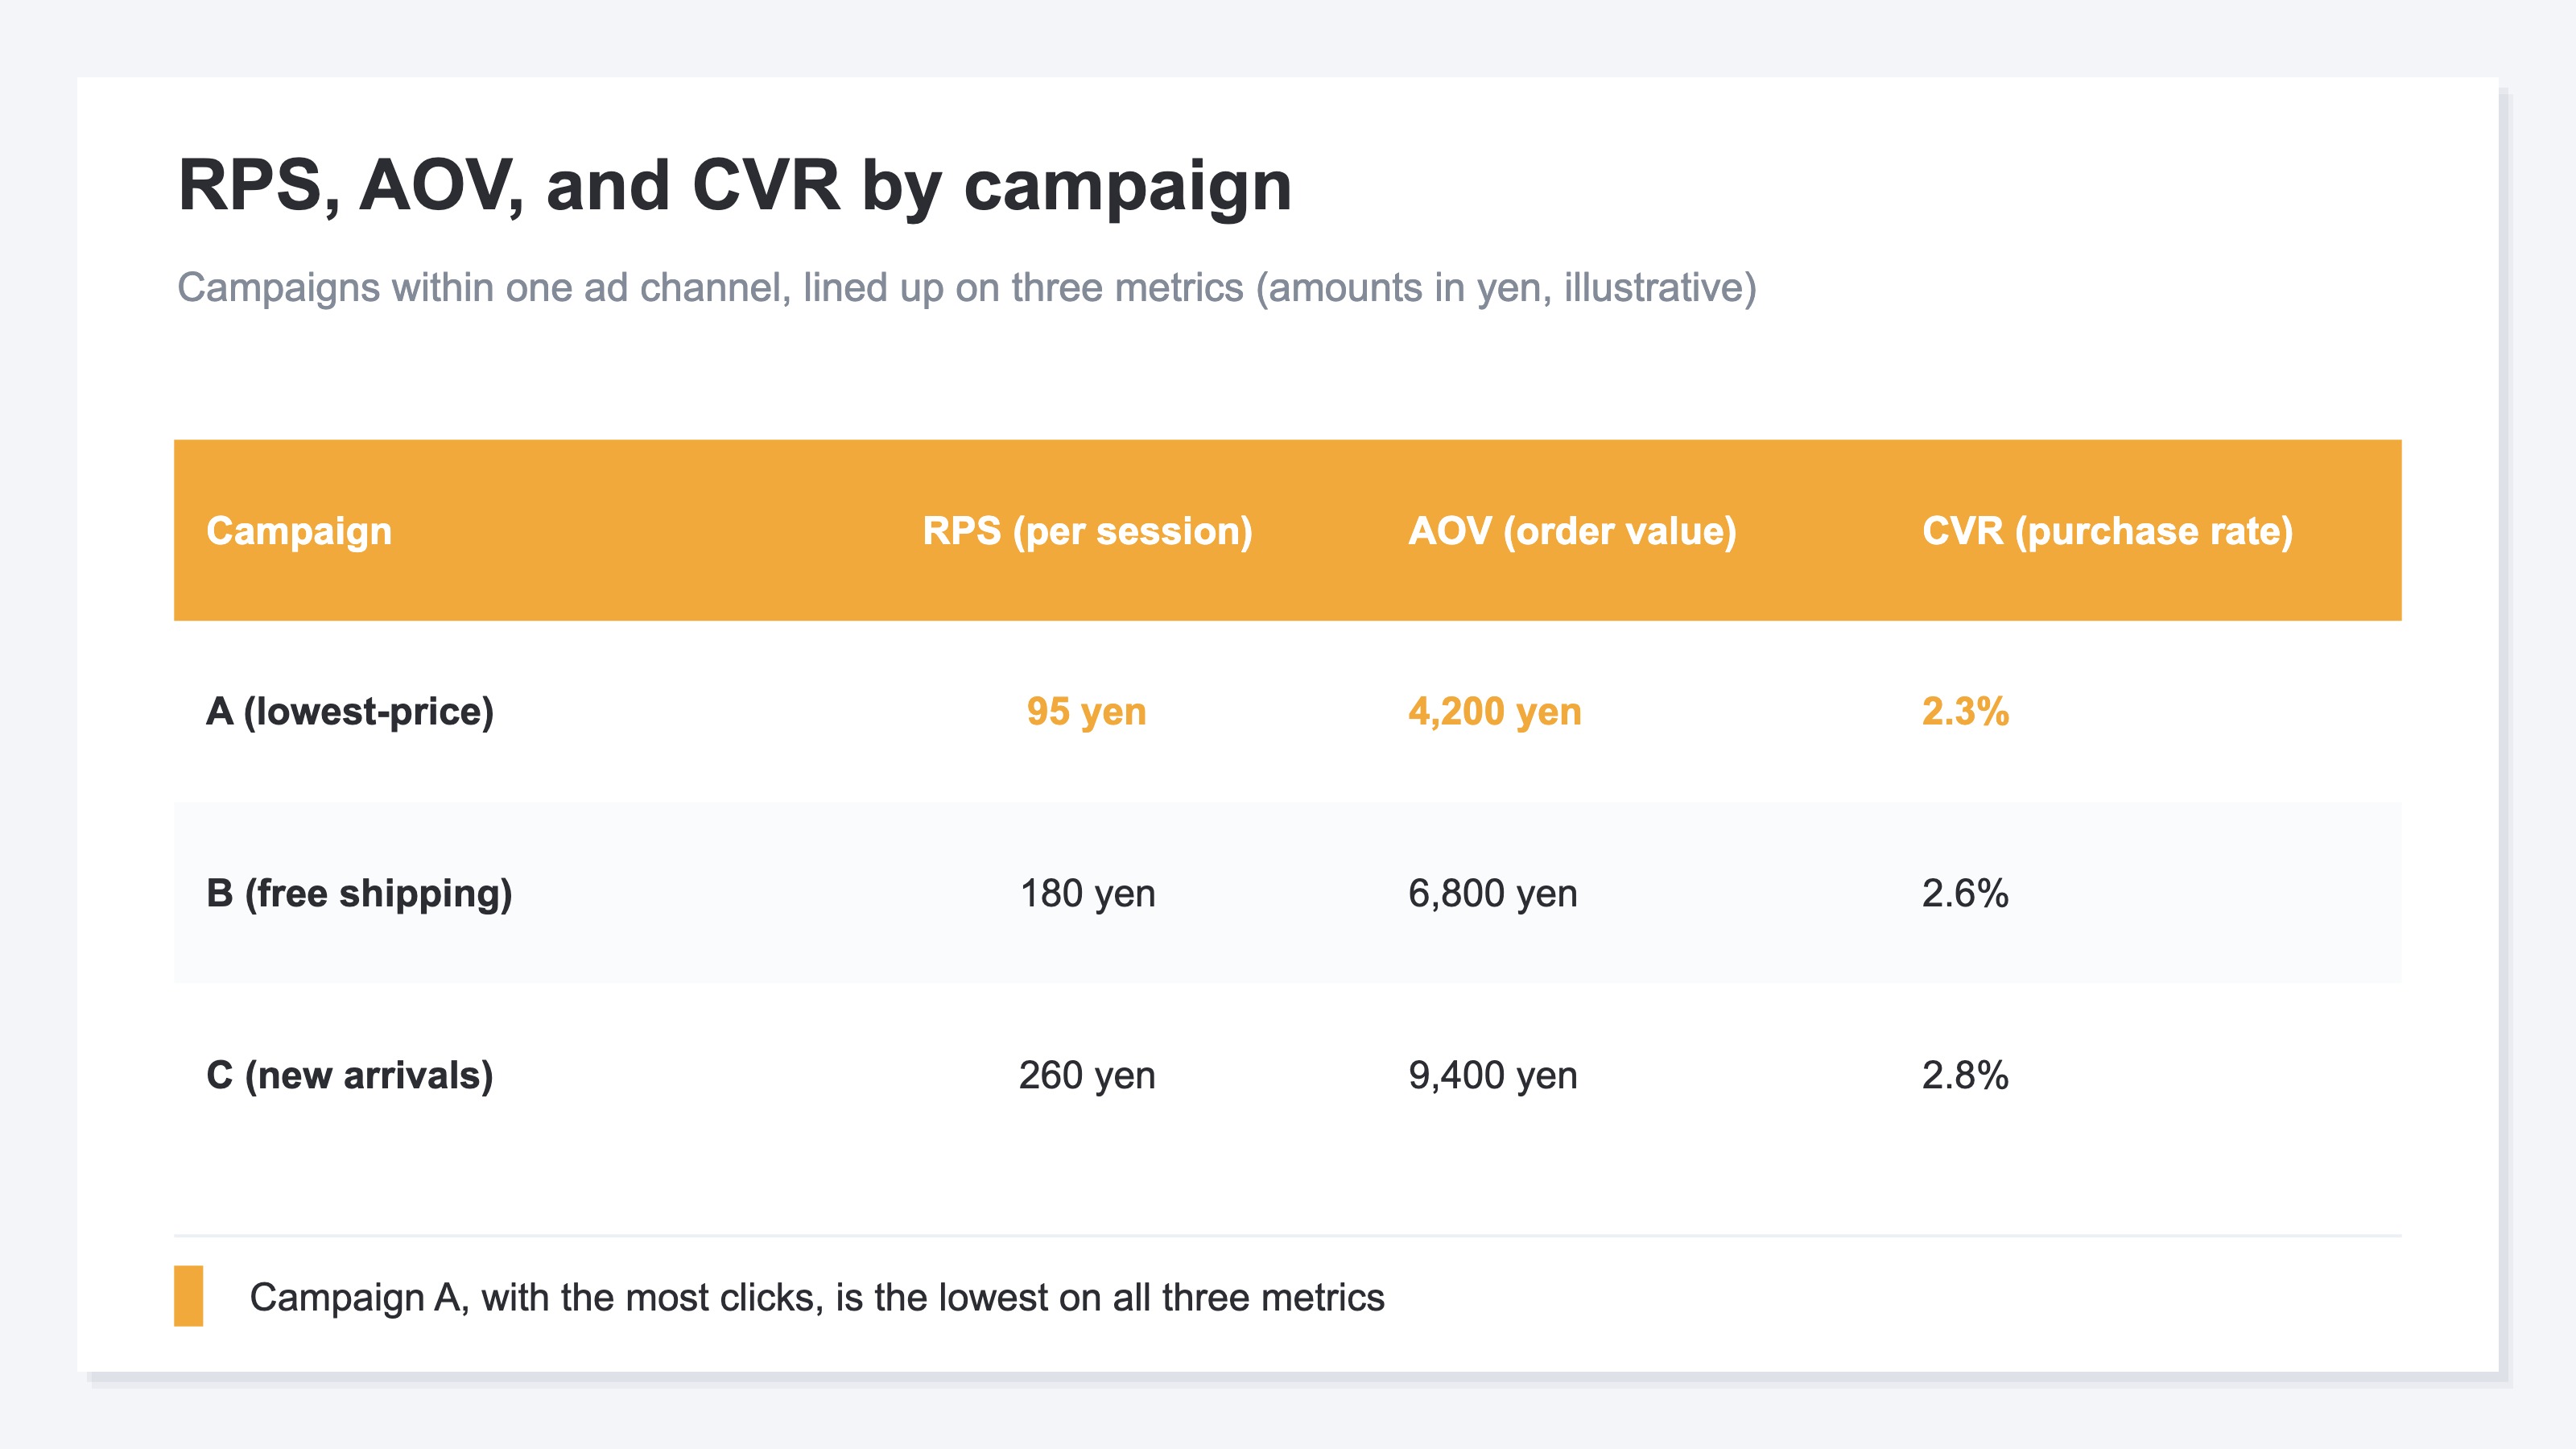
In the table, lowest-price Campaign A has both low order value and low purchase rate, so their product — RPS — is the lowest. Cheapness gathered people, but they bought one cheap item and left. As you move to free-shipping B and new-arrivals C, order value rises and so does RPS. Lining up the three this way shows "why A is inefficient" in the form of low order value.
4. Where GA4 gets heavy#
The idea itself isn't hard. What's heavy is building it in GA4 by hand, every time.
GA4 can produce campaign-level numbers too. Open the Traffic acquisition report, switch the dimension to session campaign, and you can line up sessions and revenue by campaign. For a one-time look, that's enough.
The problem is getting it into a form you can act on. RPS (revenue per session) doesn't appear as a standard metric, so you divide revenue by sessions yourself. To compare campaigns across channels, you rebuild an exploration report from scratch each time. On top of that, traffic without UTM tags lumps into Unattributed, dropping out of the campaign-level numbers. Repeating this build every campaign gets heavier the more times you do it.
The simpler the idea, the more the weight of the per-time handwork shows. Keeping RPS, order value, and purchase rate on the same basis, by campaign, across channels, becomes a burden the longer you keep it up.
RevenueScope solution
That campaign-level efficiency stays hard to see, and that lining it up is heavy, trace back to the same thing: there's usually no place at hand to put the campaigns inside one channel on the same RPS, order value, and purchase rate on one screen. GA4 can produce campaign-level numbers with an exploration report, but it becomes a rebuild — computing RPS by hand each time while checking that UTM-less traffic doesn't slip into Unattributed.
In RevenueScope, filter by channel and the campaigns inside it line up on one screen by RPS, order value, and purchase rate. Pick "Instagram ads," for instance, and the lowest-price, free-shipping, and new-arrivals campaigns inside it come out lined up on the same metrics. RPS is computed from real revenue with duplicates removed by its own tracking, so there's no aligning it by hand.
| Campaign | RPS | Order value (AOV) | Purchase rate (CVR) |
|---|---|---|---|
| A (lowest-price) | 95 yen | 4,200 yen | 2.3% |
| B (free shipping) | 180 yen | 6,800 yen | 2.6% |
| C (new arrivals) | 260 yen | 9,400 yen | 2.8% |
(An illustration of how it looks when you filter by channel in RevenueScope. Figures are demo data.)
Reading this lineup lets you decide the next move. Campaign A, with the most clicks, has the lowest RPS at 95 yen — cheapness gathered numbers and nothing more. New-arrivals C has fewer clicks, but RPS of 260 yen, more than double A's. Shift budget here, and the same visit count yields more revenue. For A, cut the budget or rework the presentation so it doesn't end in a single-cheapest-item buy. You choose these calls by the numbers, not by gut.
What RevenueScope does is not produce profit itself directly. It lines up the campaigns inside one channel on the common metrics of RPS, order value, and purchase rate, so you can choose the next campaign to fund by the numbers. When you want to go further into pricing and price-setting, see ecommerce pricing strategy as well.
FAQ#
Frequently asked questions#
Q. Can I see campaign-level numbers without setting UTM tags?
A. No — to split by campaign you need utm_campaign set. Traffic without the tag can't be tied to a campaign and lumps into Unattributed. Start by adding the marker to your ad links, and you can read revenue efficiency by campaign afterward.
Q. Should I never raise the budget on high-click campaigns?
A. Many clicks isn't a problem in itself. The problem is deciding the budget on click count alone. Clicks are the volume of traffic, a separate number from revenue per session (RPS). A high-click campaign with high RPS is good; a high-click campaign with low RPS may just be gathering numbers through cheapness. Line up both before you decide — that's the safe way.
Q. Should I cut a low-RPS campaign right away?
A. Rather than cutting it right away, first split it into order value and purchase rate to find the cause. If order value is low, a presentation that doesn't end in a single cheap item, or a bundle offer, can raise it. If purchase rate is low, the cause may be a mismatch between the pitch and the product. Don't judge by RPS alone — look inside, then choose to rework or scale back.
Conclusion#
Even within one ad channel, each campaign sells differently. The campaign with the most clicks or spend isn't always the one that sold efficiently, because clicks are the volume of traffic and how much each visit sold (RPS) is a separate number.
Line up RPS, order value, and purchase rate per campaign, and you can see which campaign just gathered numbers through cheapness, and which sold while keeping order value. Split campaigns with utm_campaign, compare them on the same metrics, and you can choose the next campaign to fund by the numbers, not by gut feel. Before you set the budget by click count, look one level down at efficiency by campaign.
See which ads actually drive revenue, at a glance
Free up to 5,000 sessions/month, AI analyst included. No credit card required. Up and running in 5 minutes.