
Your monthly revenue is real—the money landed. But when you add up sales channel by channel, somehow the pieces never add up to the total. Google search, ads, email. Add every number together and it comes out lower than what actually hit your account. That "missing slice" is revenue you can't trace back to a source—what's commonly called unattributed revenue (sales that can't be assigned to any single channel's effort).
Most people treat this as a tracking mistake and start hunting for the cause. But the point here is the opposite. No matter how correctly you configure everything, a certain amount of unattributed revenue always shows up by design. You can't get it to zero. And if you leave it invisible, your read on whether an ad is working—and your call on where next month's budget should go—quietly drifts off course. This article lays out why this revenue appears, what you get wrong when you ignore it, and a realistic way to track the percentage and build it into your decisions.
Table of contents
Key takeaways#
- Your revenue is real, but when you add up results by channel, they never reach the total. That gap is revenue tied to no channel—unattributed revenue.
- This isn't a tracking mistake. For structural reasons like direct traffic and cross-device journeys, a certain amount always appears. You can't get it to zero.
- Leave it invisible, and you'll over- or under-value your ads and misallocate budget.
- The right move is to reduce what you can, then continuously track "what percentage is unattributed" and evaluate each channel with that figure in mind.
1. Why untraceable revenue shows up#
Bottom line: Unattributed revenue isn't a tracking error. It shows up by design because the path to purchase is complex.
Assuming "the math doesn't add up, so I must have misconfigured something" is natural. But most of the time, configuration isn't the culprit. The reason is that the journey a customer takes before buying was never a single straight line. Let's walk through the common causes.
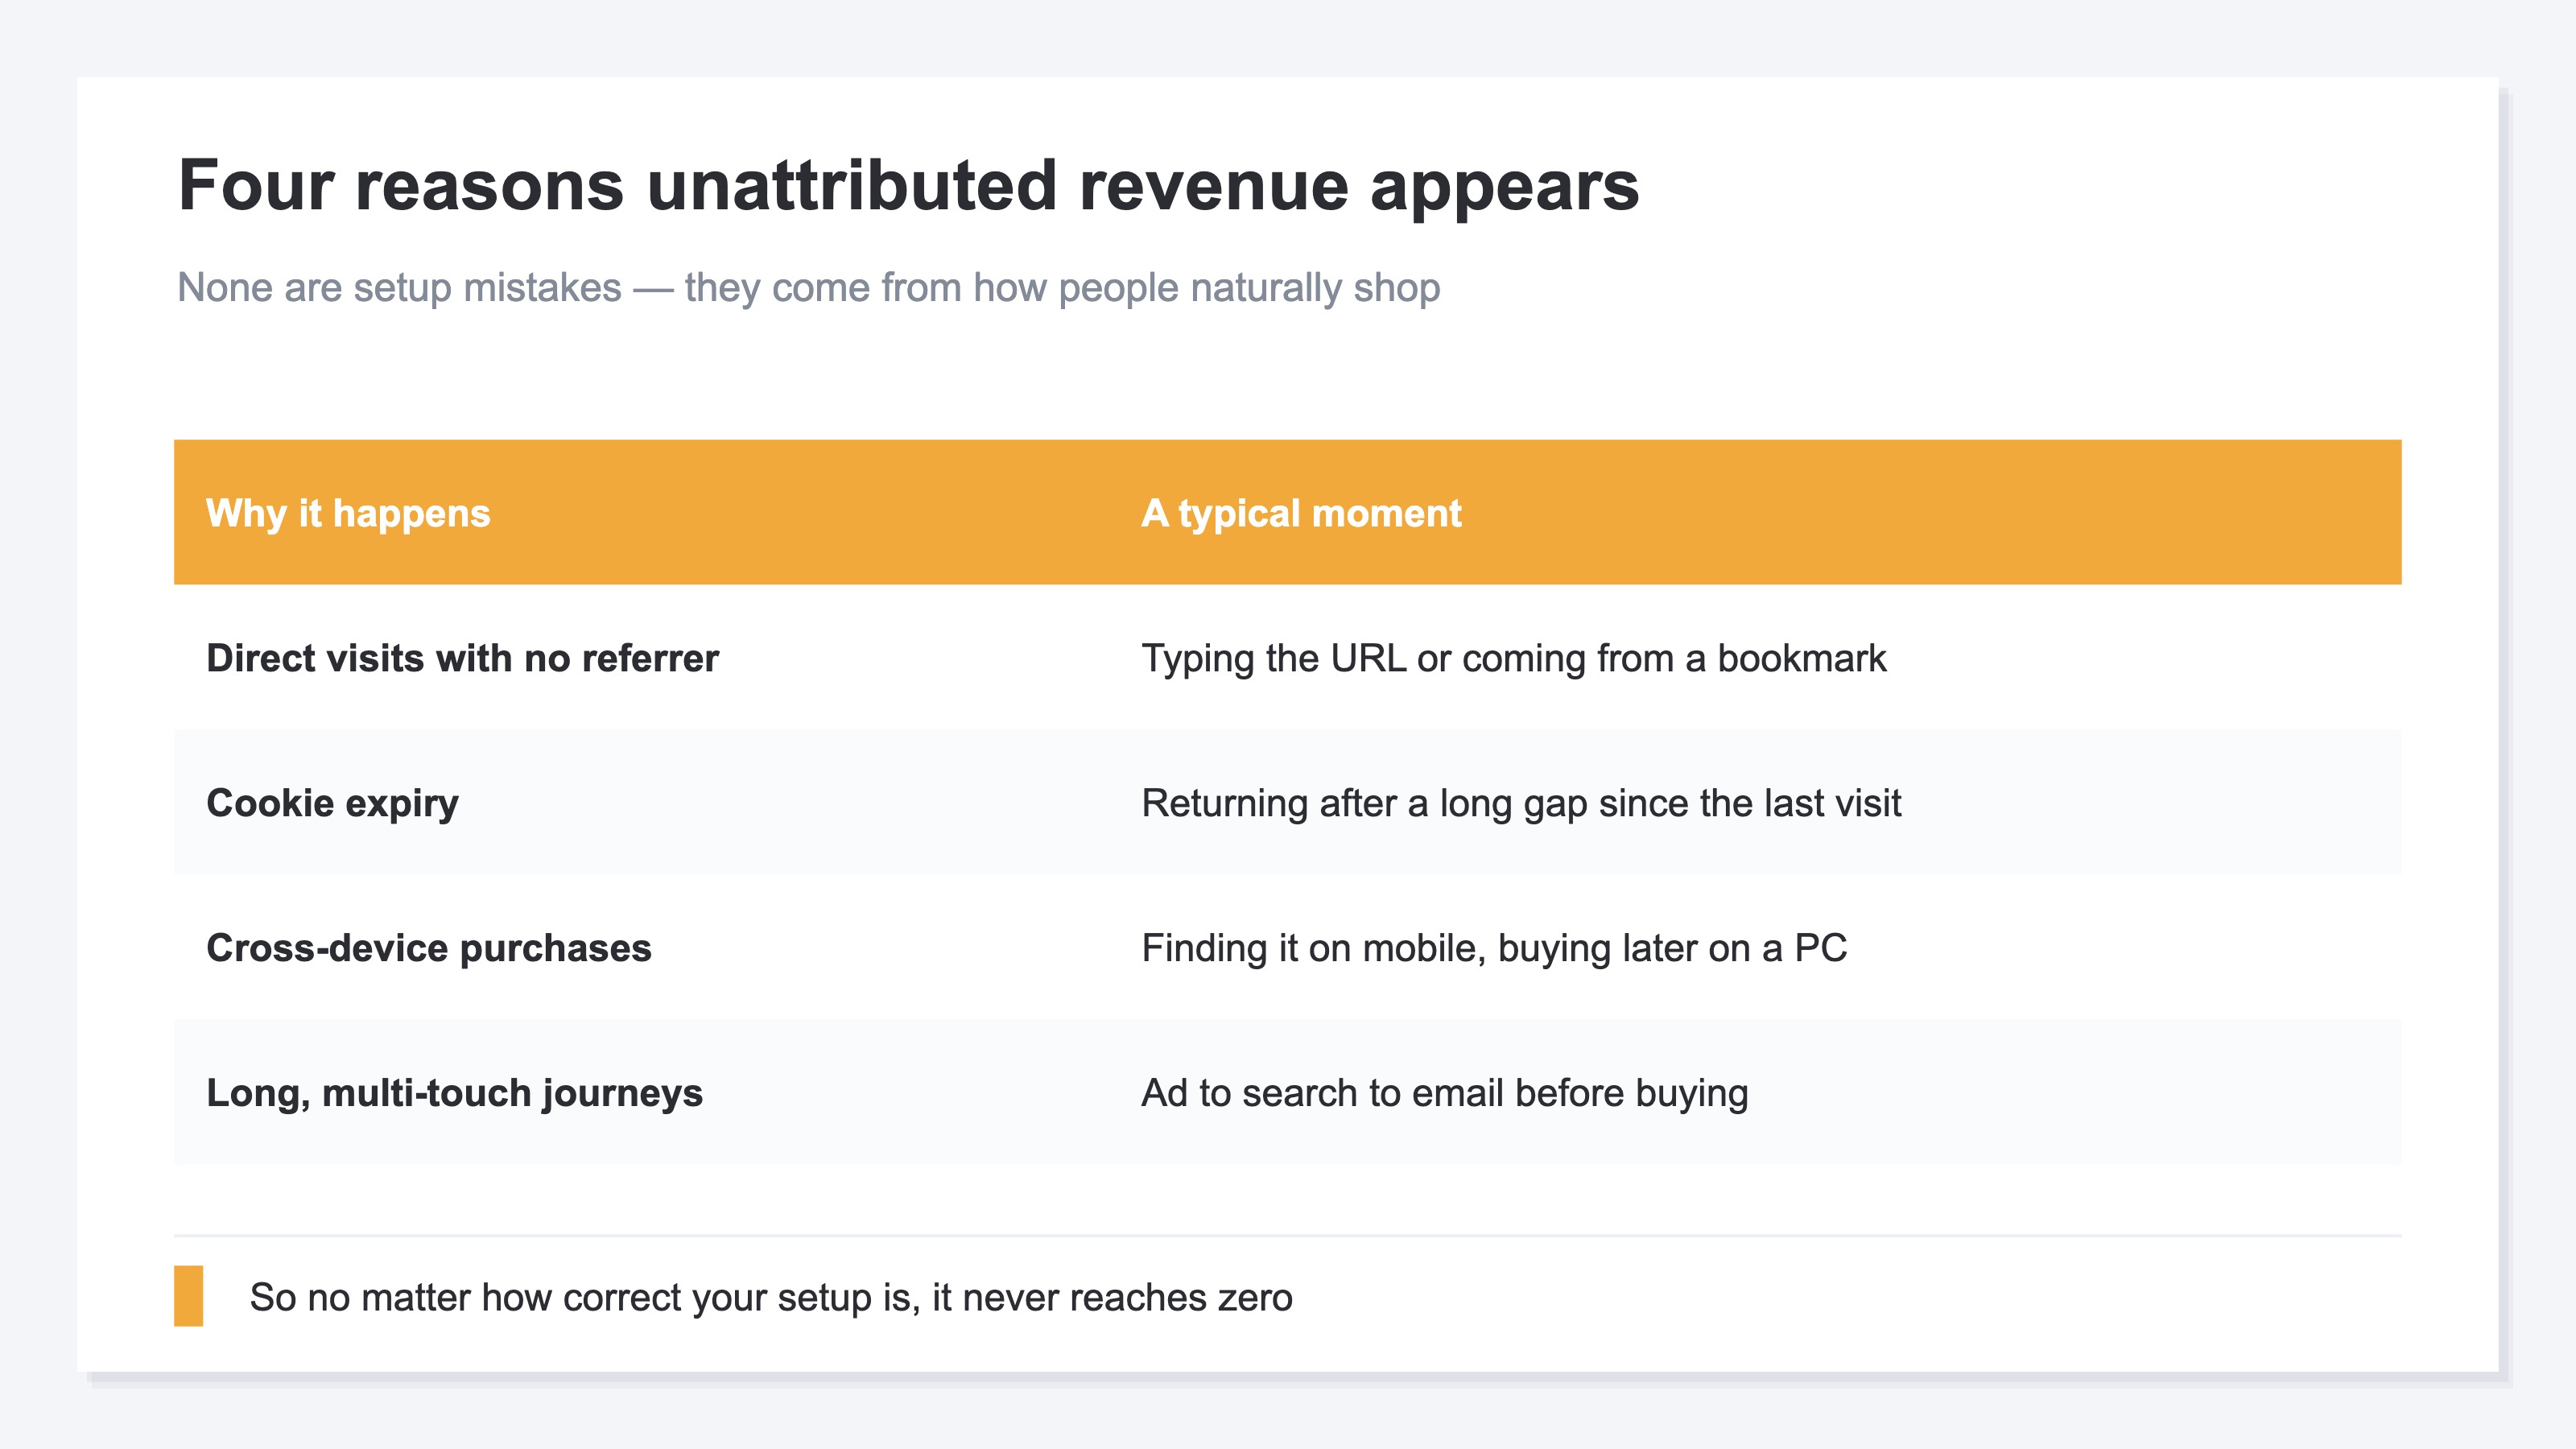
The first is direct traffic. When a customer arrives via a bookmark, by typing the URL directly, or from an app, no information about which channel they came through (the referrer—the data showing which site sent them) is left behind. As a result, tools like GA4 file them under "Direct" or "(direct)/(none)," an entry point of unknown origin.
The second is cookie expiration. A shopper might first learn about a product from an ad, but if they don't buy until a few weeks later, the marker (the cookie—the browsing identifier stored in the browser) can disappear in the meantime. The original trigger and the purchase then fail to connect.
The third is purchases that span multiple devices. They find it on their phone, then buy later from a laptop. These two sessions tend to be recorded as different people, so the first trigger and the purchase never link up.
The fourth is a long consideration period with multiple channels involved. They discover you on social, re-research on search, and get the final nudge from an email. The more touchpoints involved, the more revenue there is that "the last click alone" can't explain.
The key point: none of these are malfunctions. They're simply how people naturally shop. That's why unattributed revenue always leaves a residual amount behind, no matter how carefully you measure. Set "get it to zero" as your goal, and you'll pour endless hours into a cause hunt that never ends.
2. How ignoring unattributed revenue leads you astray#
Bottom line: Ignore the untraceable slice and you'll over- or under-value your ads, and misallocate budget.
What happens when you set unattributed revenue aside as "something fuzzy"? The problem is that the slice doesn't vanish—it distorts the numbers you can see.
Take an ecommerce operator spending $9,000 to $10,000 a month on ads. The dashboard lists how much revenue each ad generated. But once you subtract COGS (the cost of goods—what you paid to source the products) and shipping, that screen alone won't show you which ad is actually leaving profit behind. And with unattributed revenue pushed to the side, "the revenue ads created" looks bigger than it really is—or smaller.
The over-valuation pattern goes like this. The sale was actually brought in by direct traffic or email, but because the shopper happened to click an ad last, it gets counted as the ad's win. The ad looks better than it is, so you pile more budget onto it.
The under-valuation pattern is the reverse. The ad created the original trigger, but by the time of purchase the cookie had expired and the sale flowed into unattributed. The ad looks like it "isn't selling much," so you cut budget from an entry point you should actually be growing.
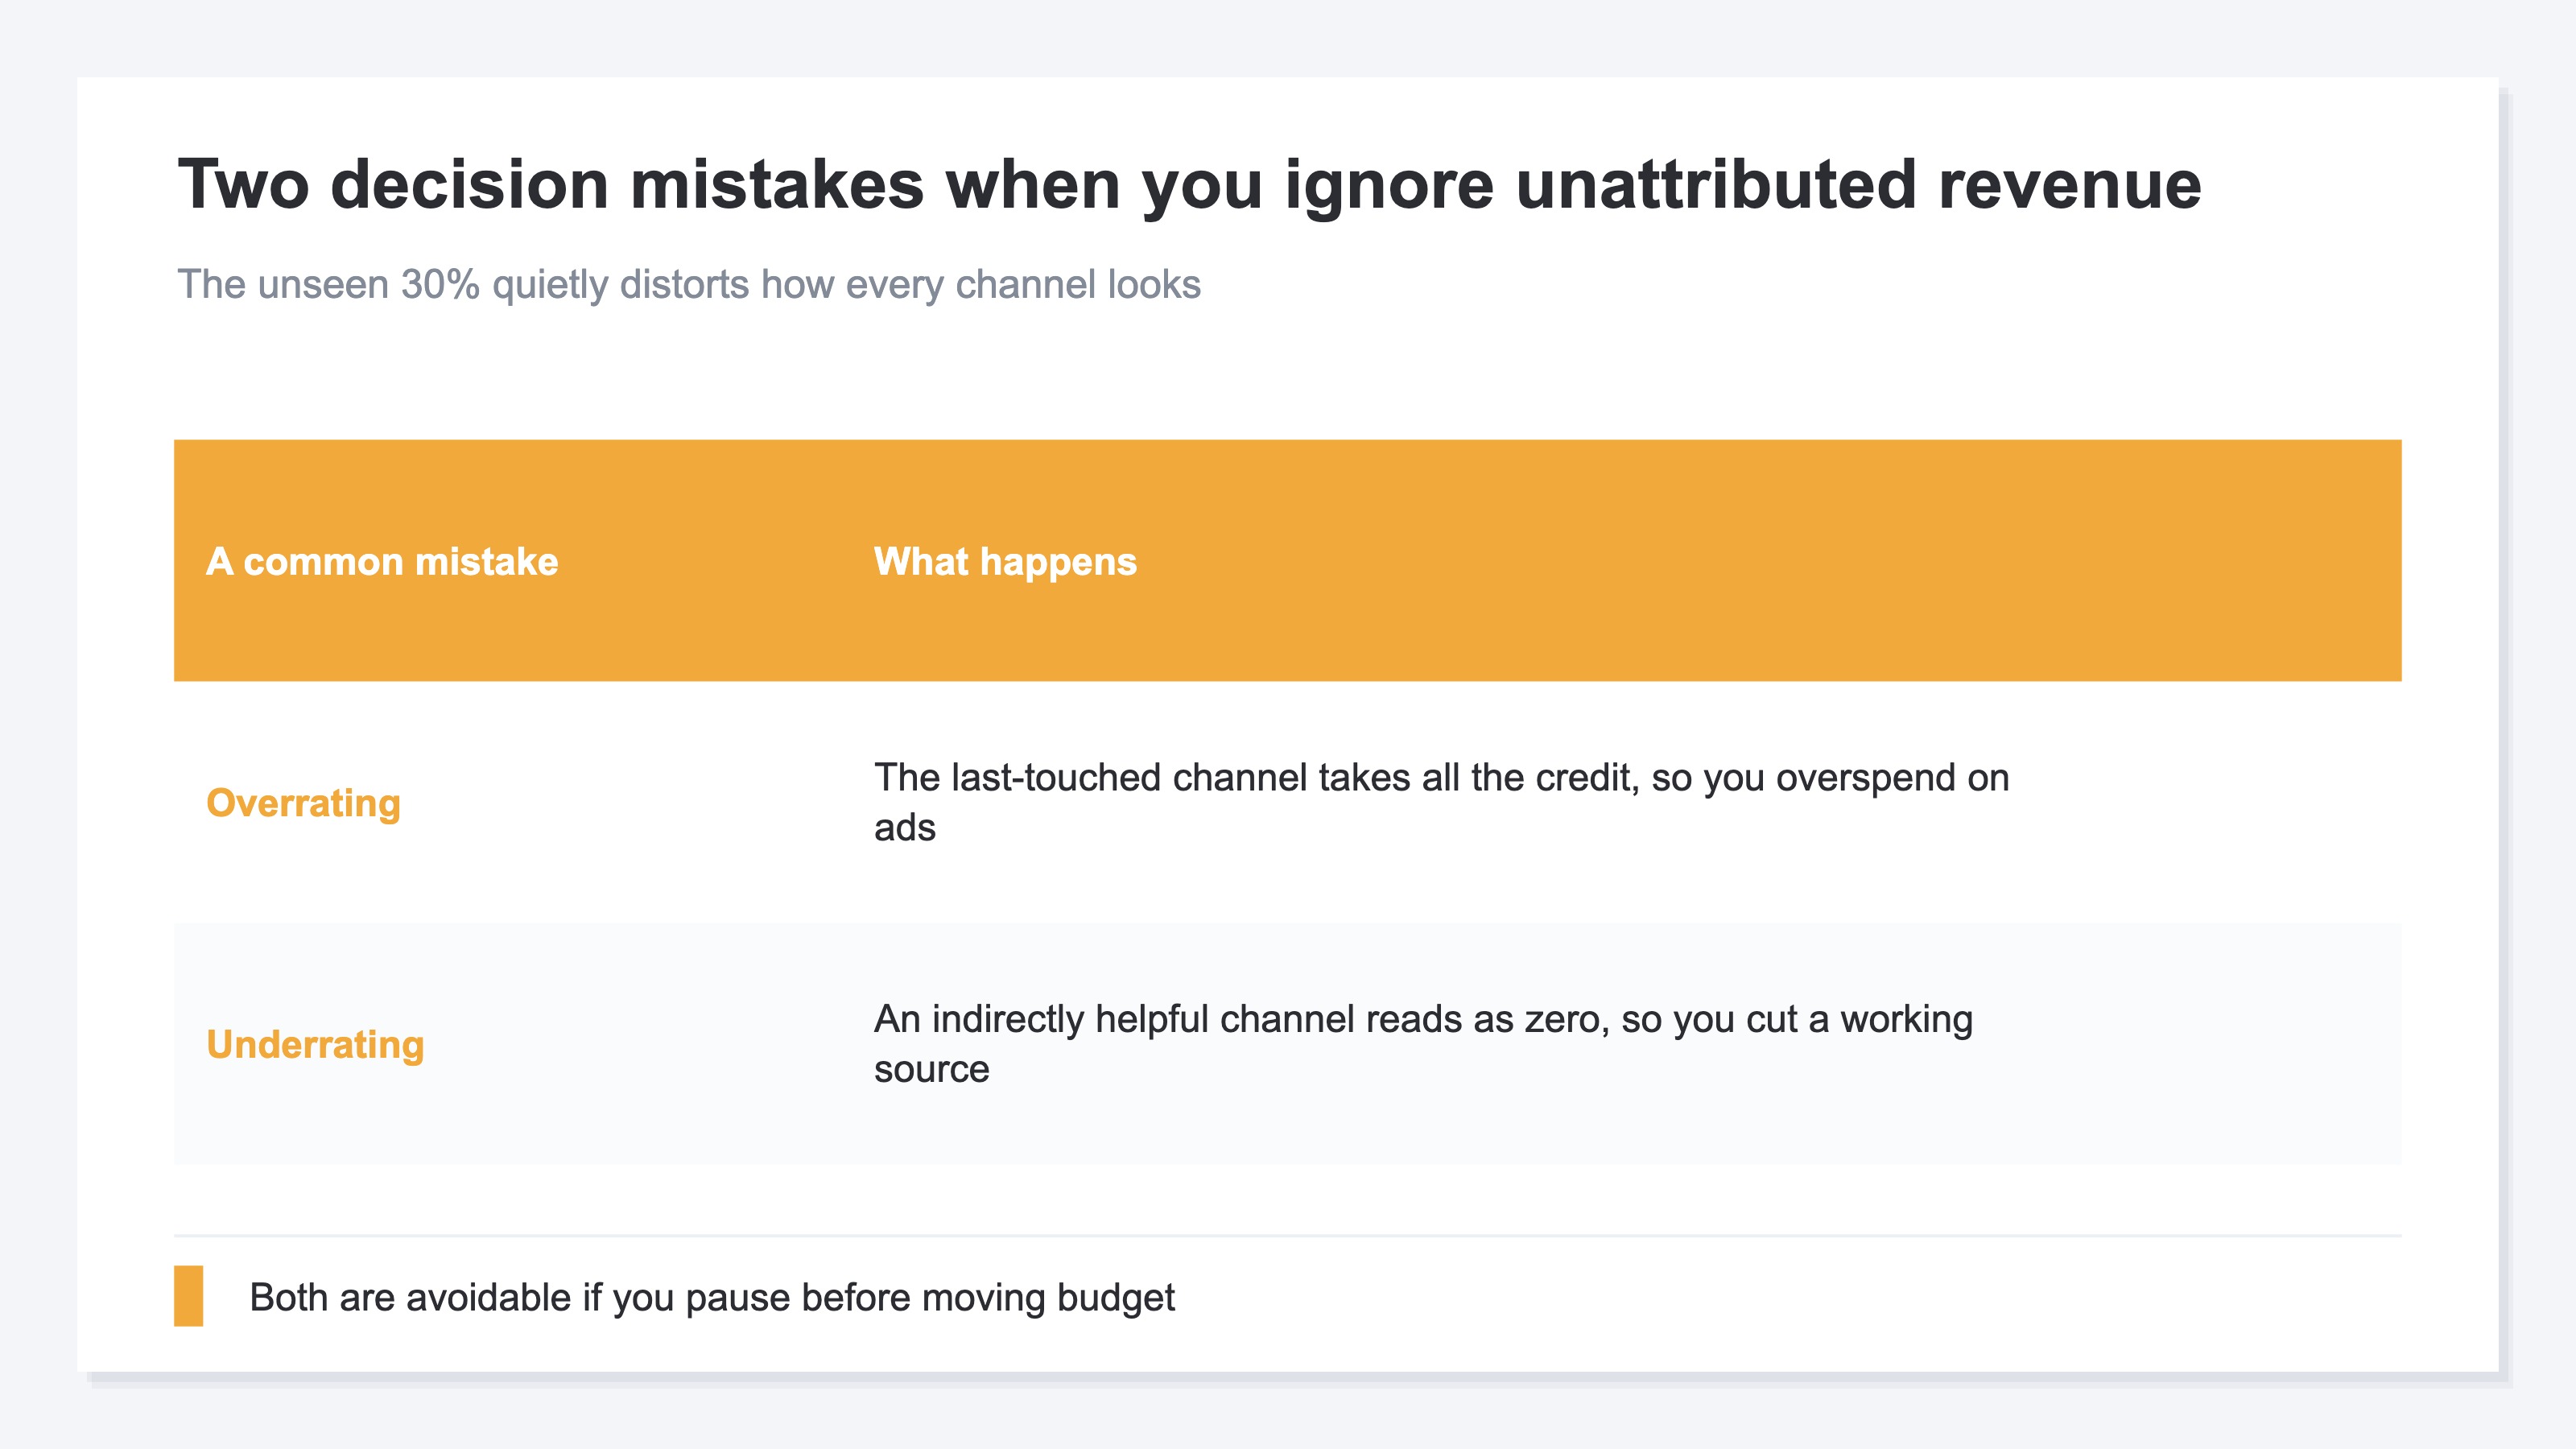
The result is decision drift. You pull reports from tool after tool, and the more you compare them, the more the numbers disagree—and the more confused you get than before. In the end, half of it comes down to gut feel. This isn't a question of the operator's skill. Most dashboards are built to give a "feeling" of being in control, not to help you decide the next move. Until you make the unattributed slice visible, that uncertainty never goes away.
3. You can't get it to zero: track the percentage and factor it in#
Bottom line: Reduce what you can, but accept you'll never hit zero—continuously track "what percentage is unattributed."
So how should you deal with it? The order matters. First, reduce what's reducible. Then track the percentage of what remains and factor it into your decisions. This two-step approach is the realistic answer.
Some ways to reduce it:
- Standardize your UTMs: Tag the links in your ads and emails with a consistent set of source markers (UTM parameters—the tracking strings appended to the end of a link). This cuts down on touchpoints you created yourself slipping through the cracks.
- Measure first-party (tracking captured directly on your own site): Instead of relying entirely on external markers, also record purchases on your own server side. This softens the impact of cookie expiration.
- Ask buyers directly: On the order-complete screen, ask one question—"How did you hear about us?" This fills in entry points that don't show up in tracking.
But if you've read this far, you've probably noticed something. Even after all of this, direct traffic, cross-device journeys, and long consideration periods don't disappear. So the unattributed slice won't reach zero—a certain amount always remains.
That's where the real lever comes in: tracking the percentage. Of this month's revenue, what share is unattributed? Did it go up or down compared with last month? Once you know this figure, you can read each channel's numbers "with the untraceable slice included." If you know unattributed runs at 30%, for instance, you won't take an ad's figure at face value—you can discount it a little when you evaluate it.
The catch is that you can't do this just once. Every time you add a channel, change an ad, or run a sale, the unattributed percentage moves. So what you really need is to recalculate this figure each time and keep watching the trend. Tagging UTMs you can handle by hand. But pulling revenue scattered across multiple services into one place every time, computing the unattributed percentage, and keeping an eye on the trend—do that by hand and you'll be stuck rebuilding spreadsheets, running out of steam before you ever reach the decision that matters. It's a simple idea, yet the longer you keep it up, the heavier it gets.
RevenueScope solution
The reason unattributed revenue is invisible, and the reason tracking its percentage is such a slog, share the same root. The sources of your revenue are scattered across multiple services, and unless you re-combine them into one place every time, you can't see the whole picture.
RevenueScope consolidates those scattered revenue sources onto a single screen. And the standout feature is this: it shows "revenue that belongs to no channel (Unattributed)" as its own independent row—without deleting it or pushing it aside. Ask, and it answers like this (figures are demo data):
| Channel | Revenue | Share |
|---|---|---|
| Google search | ¥320,000 | 32% |
| Meta ads | ¥180,000 | 18% |
| Direct | ¥150,000 | 15% |
| ¥70,000 | 7% | |
| Unattributed | ¥280,000 | 28% |
| Total | ¥1,000,000 | 100% |
Direct here is an entry point whose referrer is unknown but which could still be identified as a channel. Unattributed, on the other hand, is the remainder that doesn't even fall into Direct—revenue that couldn't be assigned to any channel at all. That's why the two appear as separate rows.
The thing to read in this table is that the bolded "Unattributed" runs at a full 28%, and that fact comes out without being hidden. Many screens fold this slice into Direct or round it away. But when 28% is visible, you can read every channel number above it "with the untraceable slice included." Meta ads' 18% and Google search's 32% aren't taken at face value—they become "18% and 32% in a world where nearly a third is unattributed," numbers you can evaluate calmly. Before you take an ad's figure on trust and add or cut budget, you get a chance to pause.
RevenueScope breaks revenue into five components—revenue, average order value, revenue per session (RPS), conversion rate, and visits—and hands them to you alongside their sources. Because it specializes in these revenue-based KPIs, it lays out every one of them—including the untraceable slice, kept as its own row—so you can read each channel with unattributed folded in and decide your next budget move with a clear head.
FAQ#
Frequently asked questions#
Q. Can I reduce unattributed revenue?
A. To some degree, yes. Standardizing UTMs, measuring first-party, and asking buyers "how did you hear about us?" all cut down on what slips through. But reasons like direct traffic, cross-device journeys, and long consideration periods are natural human behavior, so you can't get to zero. The realistic move is a two-step approach: reduce what you can, then track the percentage of what remains.
Q. What percentage of unattributed is normal?
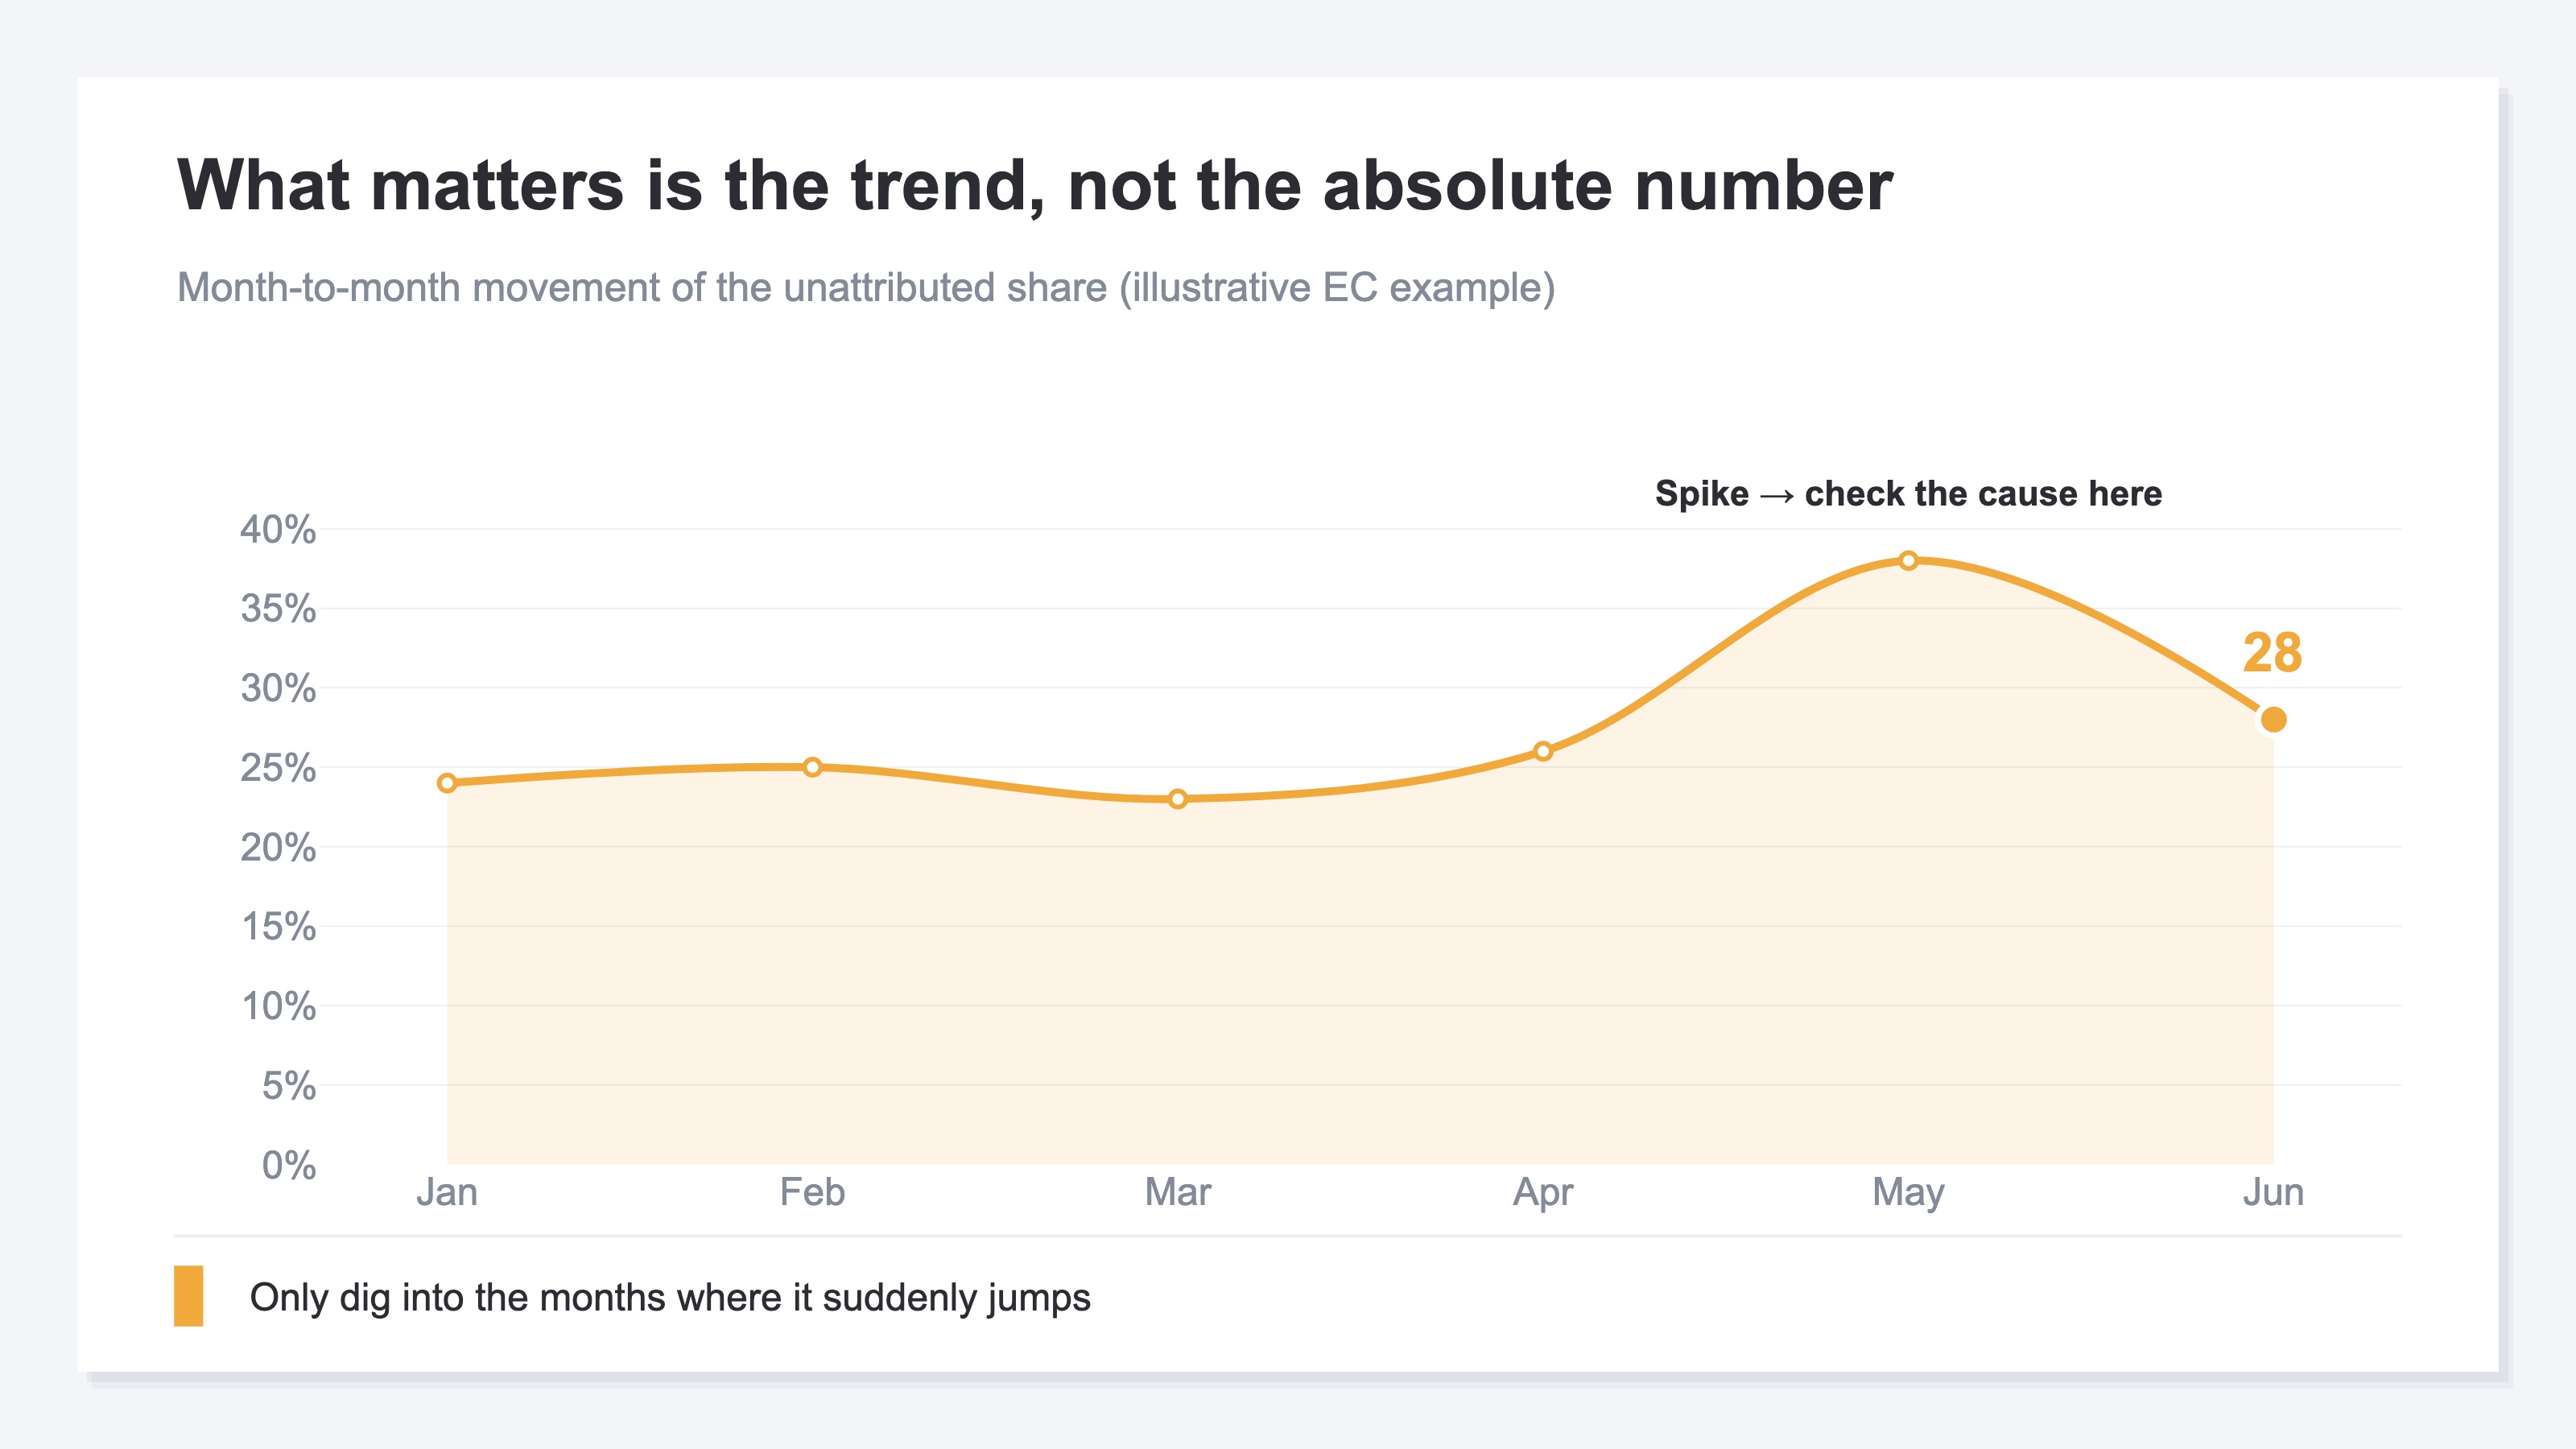
A. It varies widely by industry and channel mix, so there's no single "you're safe at this number" answer. What matters is the trend, not the absolute value. First get a read on your own percentage, then watch whether it has suddenly risen compared with last month or the month before. A spike is a sign of either a tracking glitch or a surge of new, Direct-heavy traffic—and only then do you dig into the details.
Q. Is this the same as GA4's "Direct"?
A. Close, but not the same. GA4's Direct is one channel that bundles together traffic whose referrer couldn't be determined. The unattributed revenue in this article refers to the "leftover revenue"—including Direct—that couldn't be assigned to any channel. Direct is a classification of an entry point; unattributed is about the attribution of revenue. They're measured on different axes. That's why, in the table above, Direct (identified direct traffic) and Unattributed (the residual that fits no channel) appear as separate rows.
Summary#
Your revenue is real, but when you add up results by channel, they never reach the total. That gap is revenue tied to no channel—unattributed revenue. Direct traffic, cookie expiration, cross-device journeys, long consideration periods—these aren't malfunctions but the natural way people shop, so a certain amount of unattributed revenue always remains by design.
Leave it invisible and you'll over- or under-value your ads and misallocate budget. The right move is to reduce what's reducible with steps like UTM standardization, then—accepting you'll never hit zero—continuously track "what percentage is unattributed" and evaluate each channel with that figure baked in. Start by pinning down, just once, how much of this month's revenue is unattributed. Once that comes into view, budget decisions you used to make on gut feel turn into moves backed by evidence.
See which ads actually drive revenue, at a glance
Free up to 5,000 sessions/month, AI analyst included. No credit card required. Up and running in 5 minutes.
References#
- [1] Google Analytics Help "Default channel group" (2026)
- [2] Google Analytics Help "[GA4] Source / medium" (2026)