
How far would revenue fall if you stopped your ads? Plenty of store operators keep spending while, somewhere inside, they dread that very question. The moment you pause ads, orders drop off — so it feels too risky to stop. And that's how, almost without noticing, you slide into leaning entirely on ads.
Here's the first thing this article wants to say. The size of the drop when you stop ads is, in itself, your store's ad dependence. And that drop is set by the revenue that remains when ads go quiet — the sales your non-ad channels generate. We'll call this revenue that survives without ads your baseline strength. A store with thick baseline strength keeps its footing when ads stop; a store with thin baseline strength collapses all at once. So what you should really watch — before the return on ad spend (ROAS) — is how much revenue your non-ad channels are bringing in right now. This article walks through, in order, how to measure ad dependence in numbers rather than by feel.
Table of contents
Key takeaways#
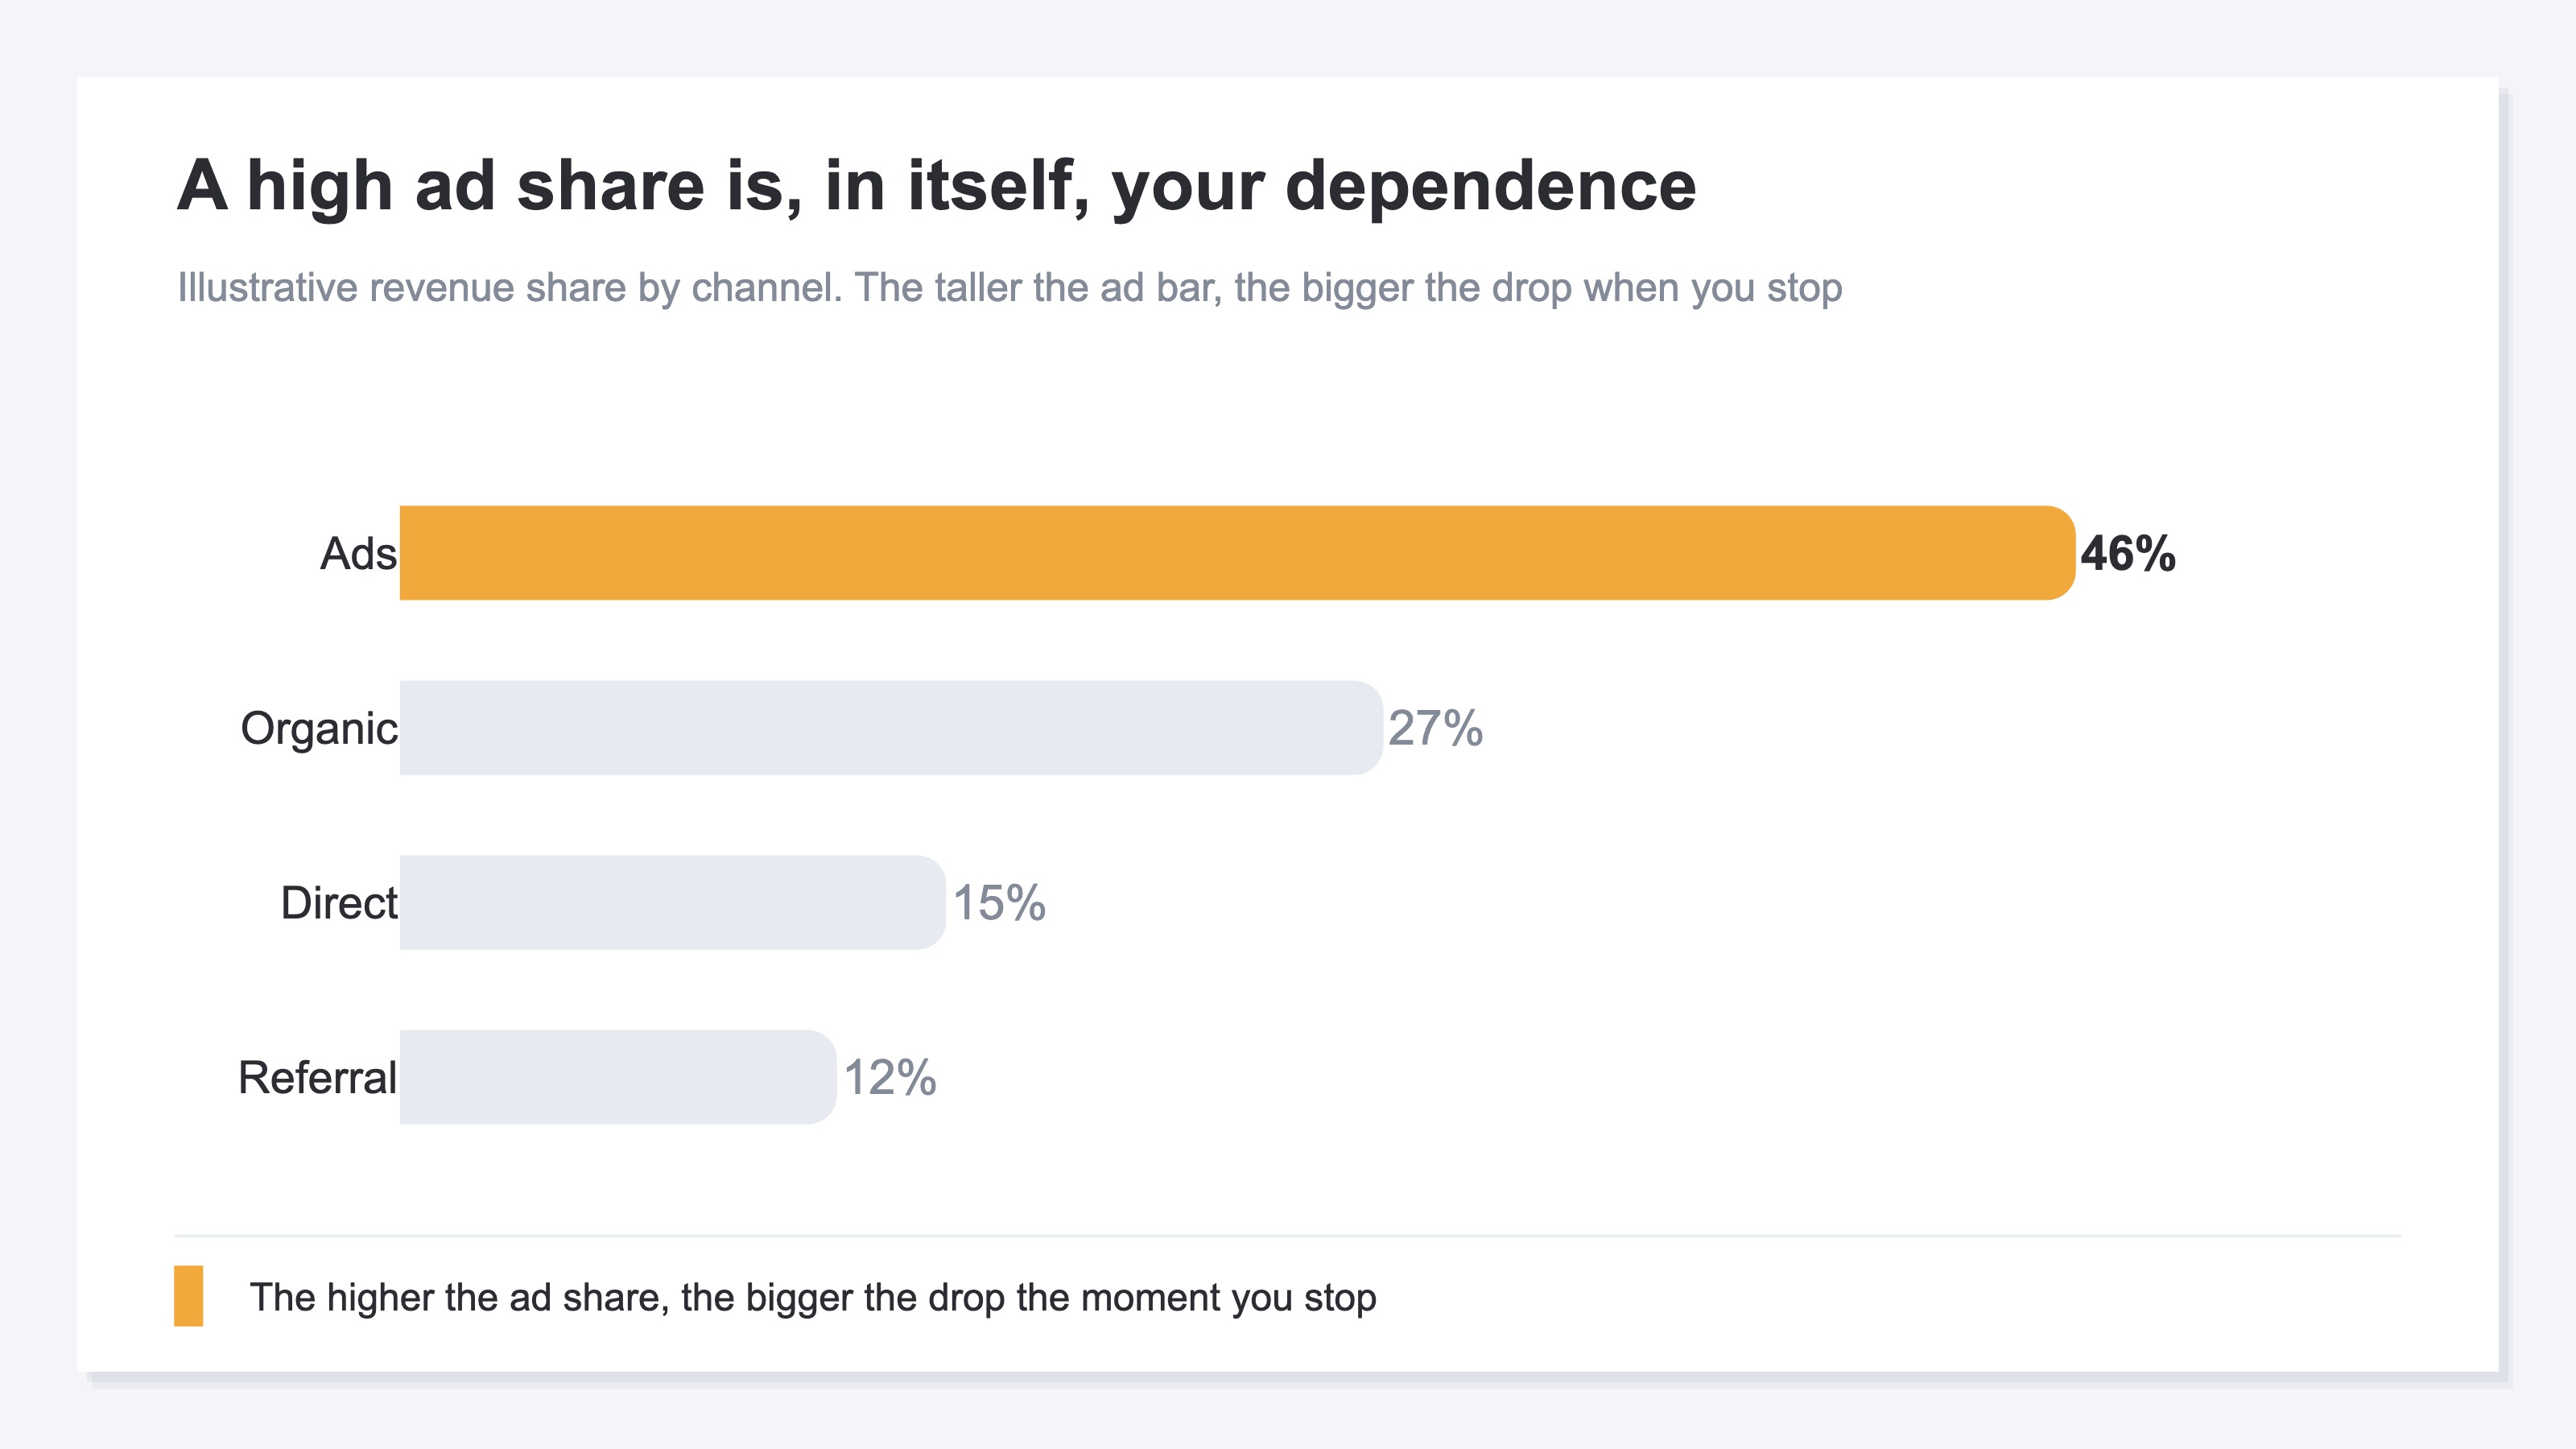
- The size of the drop when you stop ads is, directly, your ad dependence. The bigger the drop, the more your revenue leans on the ad exposure itself rather than on your products or brand.
- The revenue that remains when you stop ads — the sales from non-ad channels (Organic, Direct, Referral) — is your baseline strength. A store with thick baseline strength keeps revenue when ads stop; a store with thin baseline strength dries up fast.
- So what you should watch, before ROAS, is how much revenue your non-ad channels generate right now — in other words, revenue share by channel.
- One caveat: GA4 lets ad and organic traffic leak into Direct, and it tends to hide unattributed revenue, so it struggles to give you an accurate baseline strength (the non-ad share).
1. Why revenue falls when you stop ads#
Revenue falling when you stop ads is obvious — what really matters is how much it falls. That drop is exactly what expresses your store's ad dependence.
Ads are an entry point that brings in new visitors. While you keep spending, orders stack up; stop, and that inflow disappears. The larger the share of revenue that came through ads, the bigger the fall the moment you stop. Conversely, if enough revenue comes in from search and direct access, the foundation stays in place even when ads go off. So dependence isn't a "mood" — you can measure it with a number: revenue share by channel.
One thing to be careful of here: don't write off ad dependence as "a bad thing." Using ads to build a flood of traffic in your launch phase is, if anything, the right play. The problem is sliding into dependence without noticing, never once counting the revenue that would remain if you stopped. The reason it feels too risky to stop is that you can't see the size of the drop. Put that drop into a number and the source of the fear turns into something you can actually act on: "the revenue that survives without ads is thin."
2. Measure the baseline strength that survives at zero ads#
Measuring baseline strength is simple. You look, channel by channel, at the revenue that remains when you stop ads — the sales from non-ad channels.
Non-ad channels are the inflows that arrive without ad spend. There are three classic ones: Organic, which comes from search; Direct, from typing the URL straight in or from a bookmark; and Referral, from links on other sites. When you stop ads, only the ad channel vanishes — these three remain. So the thickness of your baseline strength is set by how much revenue each of these non-ad channels generates right now.
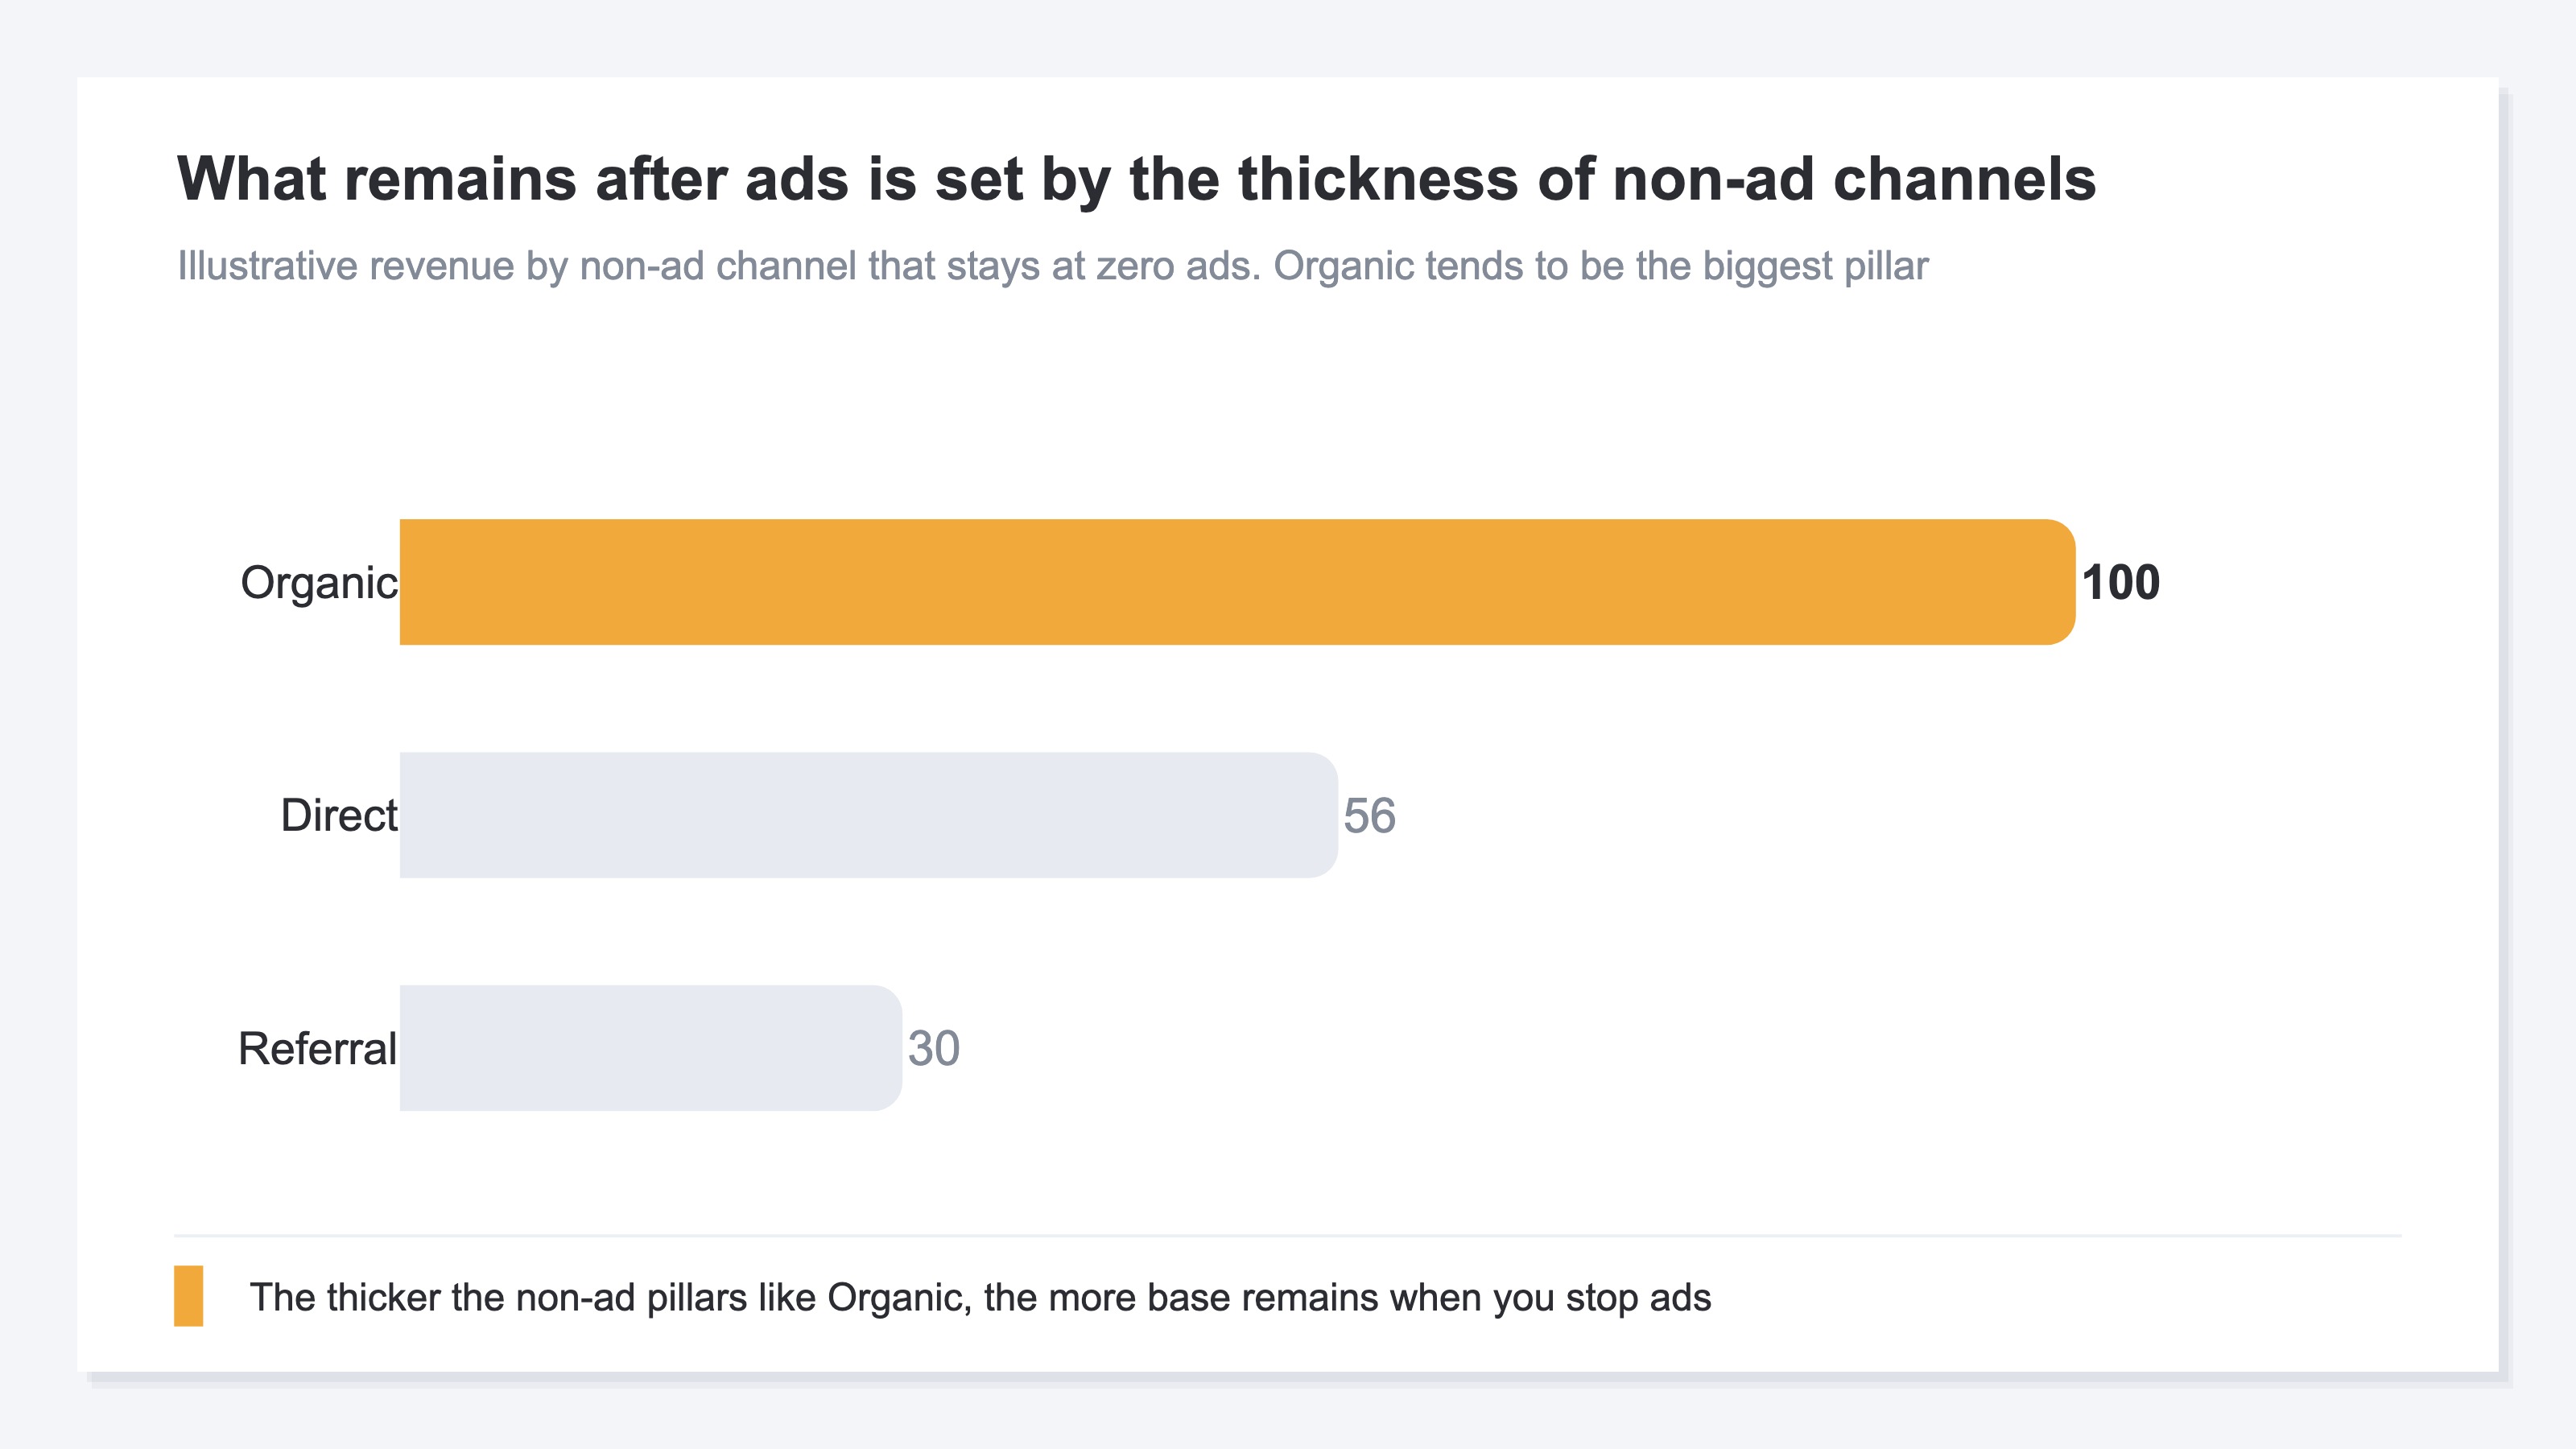
At most stores, the thickest pillar tends to be Organic. People who search by your product or brand name, and people hunting for articles and information, come in whether or not you run ads. A store with a thick Organic pillar doesn't see its revenue foundation crumble when ads stop. Conversely, if every non-ad channel is thin and ads make up almost all of your revenue, that's a sign of thin baseline strength. Before you decide whether to add more ads, knowing how thick these non-ad pillars are right now is the starting point for reading your dependence accurately.
3. Two traps that distort the channel mix#
But producing an accurate revenue share is harder than it looks, and there are two traps that make you misread your baseline strength.
The first is misattribution into Direct. In analytics tools like GA4, revenue that actually came from ads or search but whose source couldn't be identified gets dumped together into Direct. So work that was really the ad channel's result rides on Direct (a non-ad channel), making your baseline strength look thicker — and your ad dependence look lighter — than it really is. The second is unattributed revenue. When revenue that couldn't be tied to any channel never surfaces, the denominator of the mix itself is missing, and every channel's share gets distorted.
Eyeballing each channel's revenue in GA4 to get a rough read is free. It's what comes after that gets heavy. To sort the ad and organic traffic that leaked into Direct, you have to decide how to handle revenue whose source couldn't be identified. On top of that, the mix shifts with which touchpoint you credit for a sale (the attribution model — last, first, and other rules). But that comparison is heavy by hand, and it usually ends after a single eyeball pass. That way, you run out of energy before you reach the true thickness of your baseline strength.
Let me make the boundary clear. What this article covers is how to measure the baseline strength that remains when you stop ads, and diagnose your dependence from it. How to actually grow the non-ad channels you find — those tactics are laid out separately in "How to grow non-ad channel revenue." For what unattributed revenue leaking into Direct really is, "Why unattributed revenue happens" is the entry point; for judging whether to add still more ads, "Spotting when you're over-spending on ads" is where to start.
The idea itself isn't hard. What's hard is keeping it up every time. Sorting inflow sources, switching attribution models, checking unattributed revenue — the handwork grows with every angle you want to see, and you stall before you reach the actual diagnosis of your baseline strength.
RevenueScope's solution
When you try to put ad dependence into numbers, you end up against the same wall. You know baseline strength can be measured as the non-ad channels' revenue share — yet sorting the traffic that leaked into Direct, comparing across attribution models, and checking unattributed revenue, all by hand every time, is heavy enough that you run out of energy just short of the diagnosis.
RevenueScope holds that split from the start, as revenue share by channel. It outputs ad and non-ad (Organic, Direct, Referral) revenue separately, and it shows revenue that ties to no channel openly, as an Unattributed row (display uses demo data). Ask it, and it comes back like this.
| Channel | Revenue share | Revenue | Category |
|---|---|---|---|
| Ads | 46% | ¥2,300,000 | Ad |
| Organic | 27% | ¥1,350,000 | Non-ad (baseline) |
| Direct | 15% | ¥750,000 | Non-ad (baseline) |
| Referral | 8% | ¥400,000 | Non-ad (baseline) |
| Unattributed | 4% | ¥200,000 | Unattributed |
The most telling read in this table is that ads make up 46% of revenue. Meanwhile, the non-ad baseline strength that survives if you stop ads is 50% (Organic 27% + Direct 15% + Referral 8%). Even when the ad inflow vanishes, half of the foundation remains — and the thickness of that baseline strength is visible as a number, the channel mix, not a feeling. On top of that, by reporting the 4% that tied to nothing as Unattributed, it keeps the denominator of the mix from going missing and skewing the shares. Switch the attribution model across last, first, linear, and time_decay, and you can repeatedly check how much of the ad's result had leaked into Direct — a way to verify you aren't overstating your baseline strength.
Let me make one thing clear. What RevenueScope outputs is revenue, revenue share, revenue per session (RPS), and conversion rate (CVR) by channel, along with their breakdowns. It does not output gross profit after cost, or a customer's lifetime value (LTV). And the revenue share and the per-attribution-model figures shown here are estimates and approximations, not a firm forecast of revenue after you stop ads. It assembles the material for how thick your baseline strength is, but the final call on whether to cut or add ads is yours.
FAQ#
Q1. My revenue halved after I stopped ads. Does that mean I'm too dependent?
Don't conclude that right away. Since the drop is your dependence, a half that remained can also be read as your baseline strength supporting half of revenue. What matters is taking one honest look at the number behind the drop. The half that fell is the ads' contribution; the half that stayed is the baseline strength of your non-ad channels (Organic, Direct, Referral). The next move is to confirm the makeup of that remaining half — which channels form the foundation — by its channel share.
Q2. How do I split out non-ad channel revenue?
Reading revenue share by channel is the basis. But when you read it in GA4, watch for inflow whose source couldn't be identified leaking into Direct and making your baseline strength look thicker than it is. When revenue that actually came from ads rides on Direct, you underestimate your ad dependence. The mix only becomes accurate once you decide how to sort inflow sources and how to handle unattributed revenue that ties to nothing.
Q3. If I learn my baseline strength is thin, should I cut ads right away?
Cutting abruptly is dangerous. Stop ads while your baseline strength is thin and revenue falls hard. The order is backwards. First, get an accurate grip on how much revenue your non-ad channels generate now; then, while growing baseline strength like Organic, lower the ad ratio little by little — that's the safe path. The decision to "cut or add" ads comes after you've grasped the thickness of your baseline strength in numbers.
Summary#
The size of the drop when you stop ads is, directly, your ad dependence. The bigger the drop, the more your revenue leans on the ad exposure itself rather than your products or brand, and the harder it falls the moment that ad inflow disappears.
What sets that drop is the non-ad channel revenue that survives when you stop ads — your baseline strength. So what you should watch, before ROAS, is how much Organic, Direct, and Referral generate right now: revenue share by channel. Just note that in GA4, misattribution into Direct and unattributed revenue easily distort the mix, so keep an eye there. Start by splitting your recent revenue into ads and non-ads. That alone makes "the revenue that remains if you stop ads" — the source of the fear all along — show up clearly as a number.
See which ads actually drive revenue, at a glance
Free up to 5,000 sessions/month, AI analyst included. No credit card required. Up and running in 5 minutes.
References#
- [1] Ministry of Economy, Trade and Industry "Survey on Electronic Commerce" (2024)
- [2] Google Analytics Help "Default channel groups" (URL unconfirmed)
- [3] Google Analytics Help "About attribution" (URL unconfirmed)
- [4] Baymard Institute (2024)