
Google Search Console has added "platform properties," so you can now see how your social posts on X, YouTube and the like perform in Search and Discover. A welcome addition. But if you read rising exposure straight as a result, you'll misjudge. The new report counts up to the click, and whether that exposure became revenue sits after landing. This article separates what's newly visible from what isn't, and works through — with a sample store's data — how to read social traffic by revenue.
Contents
TL;DR#
-
Platform properties make the Search/Discover exposure of social posts visible
You can track how often your posts on X, YouTube, TikTok and others were shown in Search and Discover, which terms drove clicks, and their position
-
What's visible stops at the click. More exposure isn't more revenue
Impressions and clicks can grow, but whether they led to a purchase doesn't appear in this new report
-
"Whether it sold" happens after landing, outside GSC
Revenue occurs once someone lands on your site. GSC covers the search-side exposure; purchases only connect through your own measurement
-
Whether to invest in social is decided by post-landing revenue and RPS, not exposure volume
Only by seeing how much each source sold, by channel, can you pick where to invest. Exposure is the metric one step before that
1. What Platform Properties Newly Make Visible#
Bottom line: A platform property is a new Google Search Console property type for seeing how much your social posts were exposed in Search and Discover [1][2]. Search performance, which used to cover only your own site, now extends to your social and video posts.
You can add account/channel-level properties for X, YouTube, TikTok and Instagram [1]. Once set up, you can see how many times those posts were shown in Search, Discover and Google News, plus clicks, average click-through rate, and average position [2]. Which post brought people in on which query, and which posts are growing, are all trackable at the post level. Bringing content outside your own domain under the same yardstick — impressions, clicks, position — is the single biggest change here.
Signals from social used to be scattered across each platform's own dashboard. Now they line up on one axis: "how are you being found on Google." For an EC business that also invests in social, having more material to see where exposure is working is a genuine step forward.
Still, keep one thing front of mind: what's visible here is "exposure on the search side." Impressions and clicks are events in Google's search results and Discover. What someone bought after clicking through and landing on your site sits outside the range of this new report.
2. More Exposure ≠ More Revenue#
Bottom line: When impressions or clicks climb in the new report, it looks like results. But exposure is a metric one step before revenue. That exposure grew, and that revenue grew, are two things you have to confirm separately before they connect.
The reason is simple: platform properties count up to the click. How many times shown, how many clicks, what position — this comes out in detail. But whether that click ultimately became a purchase, and how much revenue it generated, isn't visible from the search side. A click is a count of entrances, not a count of checkouts.
The awkward part is that the size of exposure and the size of revenue often don't line up. The most-seen post isn't always the best-selling post. Some traffic gets buzz and clicks yet barely buys after landing; other traffic is modest on exposure but steadily produces revenue. Decide post priority on exposure alone, and you miss this reversal.
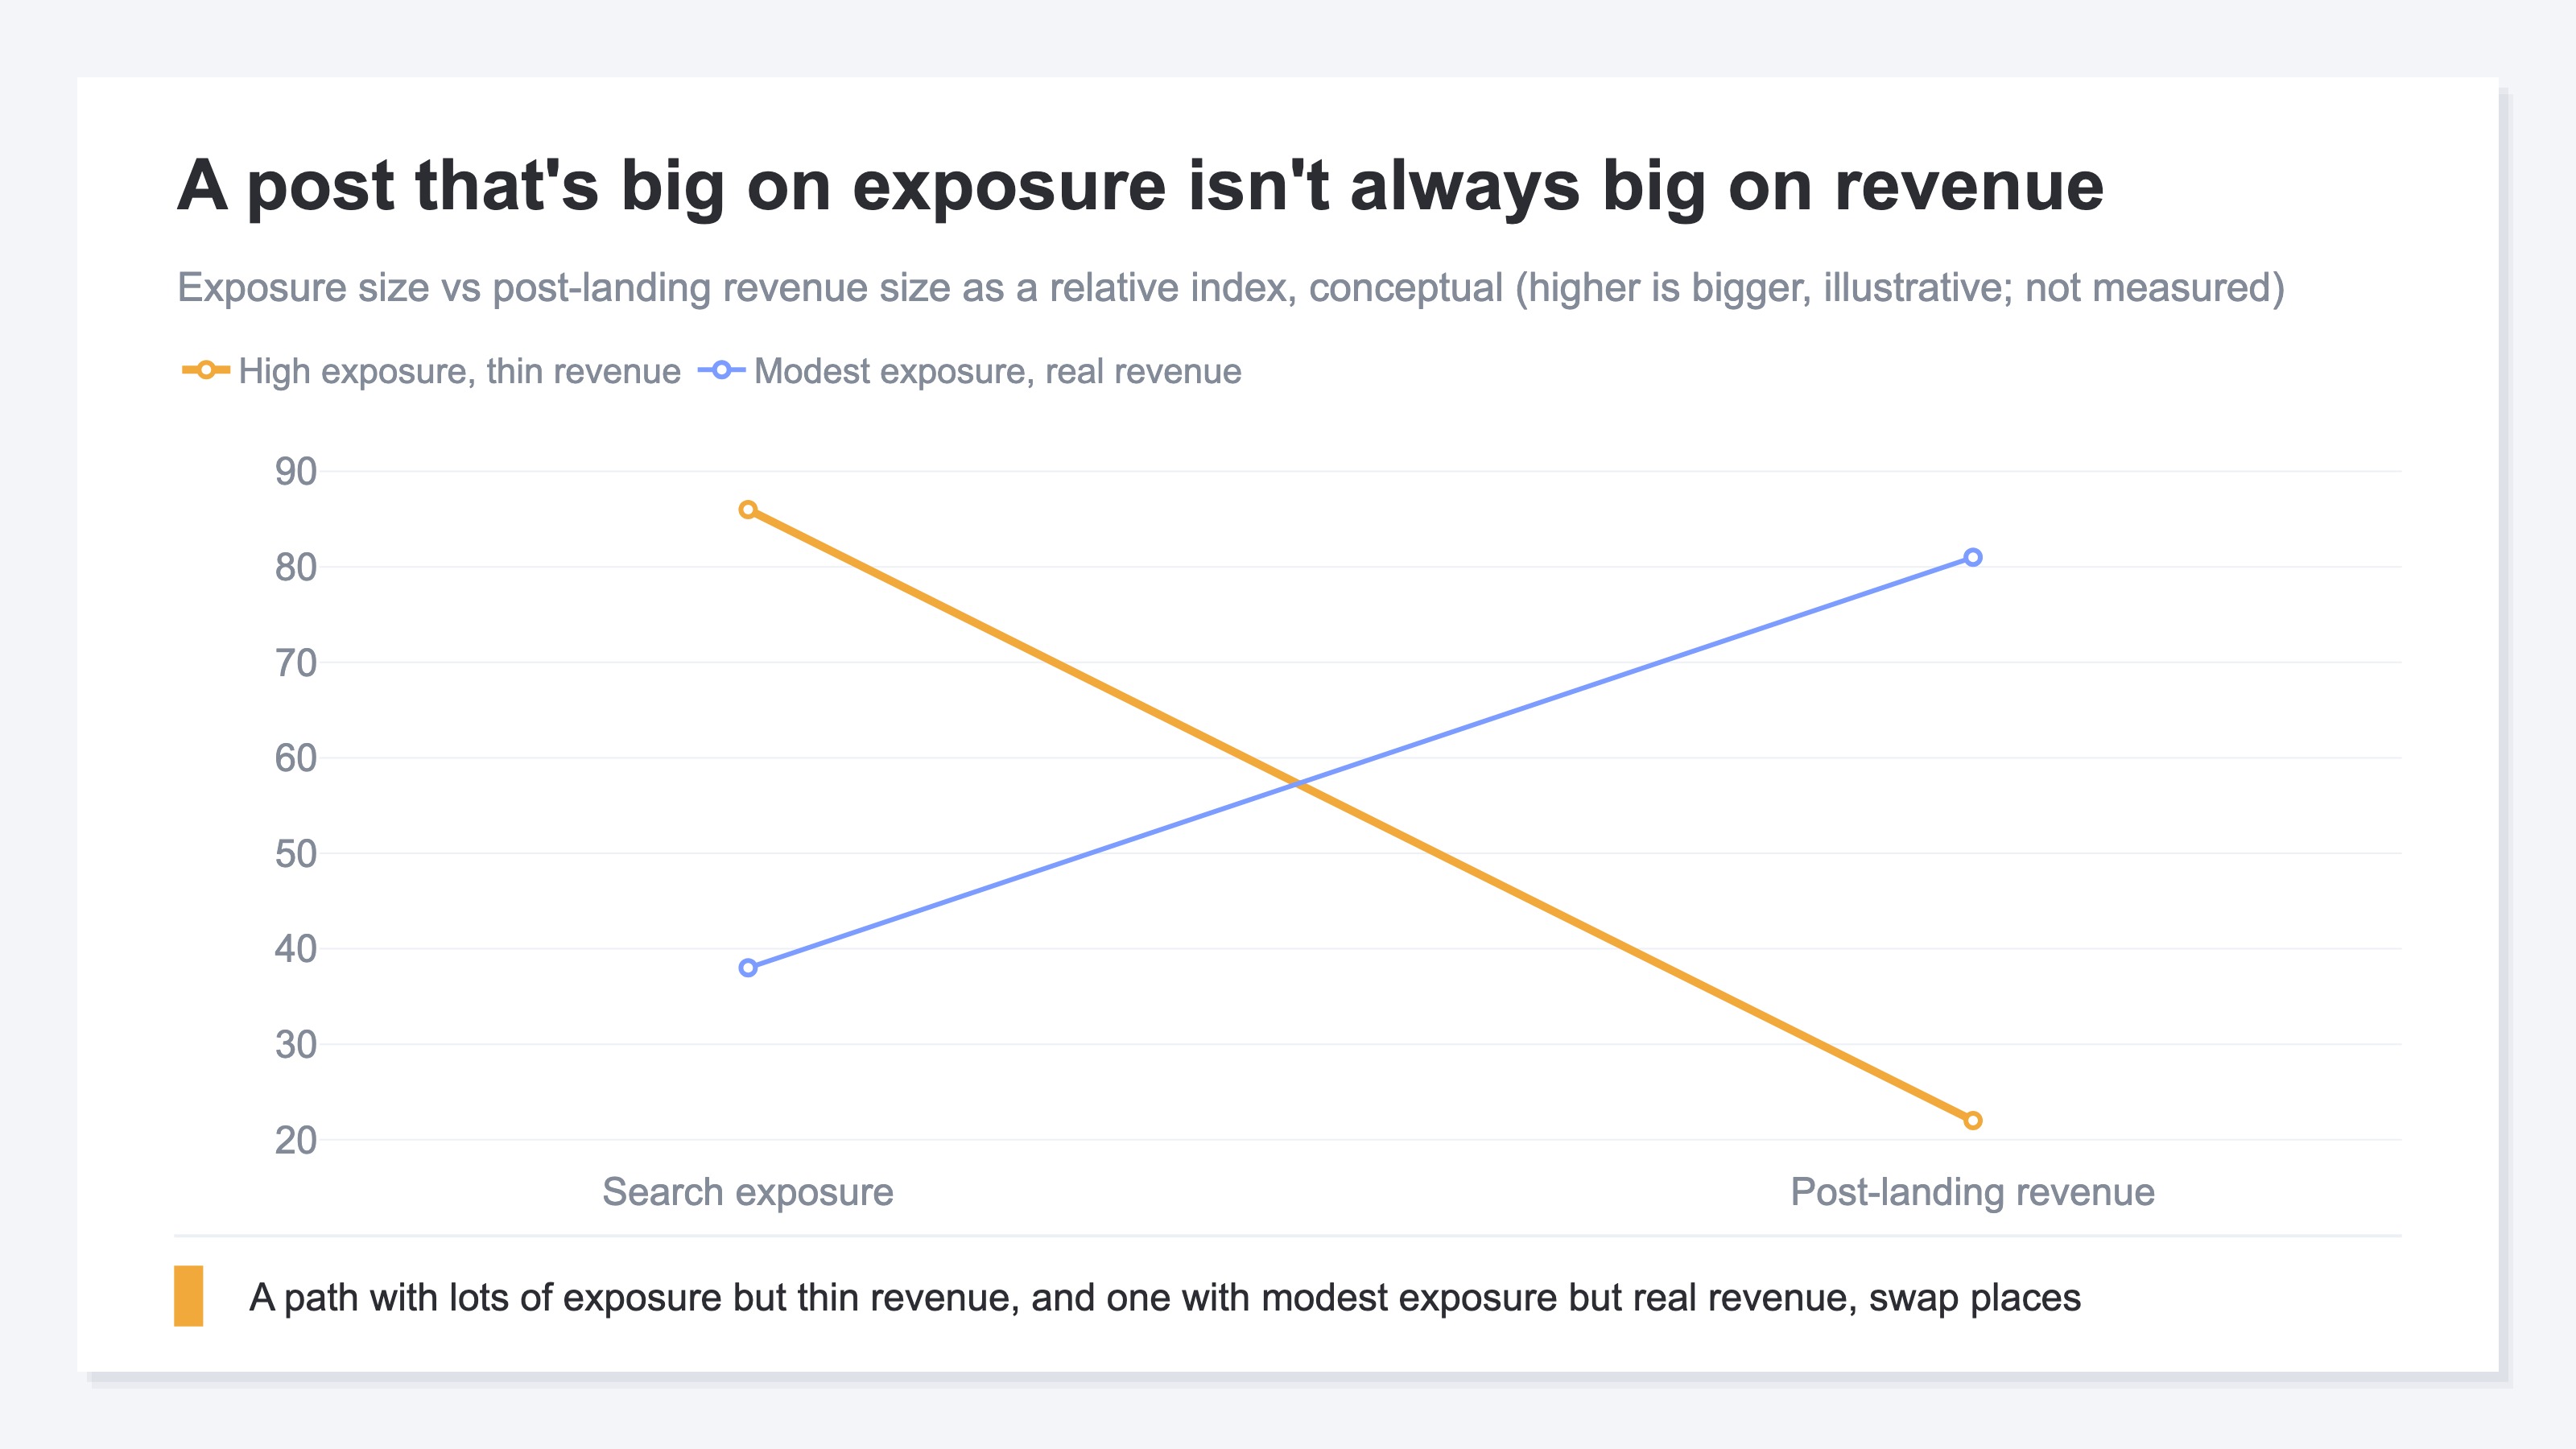
So the exposure report is ideal for knowing "which posts are being found," but you can't use it as-is for the final call on "which posts deserve your time." That call needs numbers that follow through to revenue after landing. Where social revenue tends to hide is laid out in the problem of Instagram revenue hiding in Direct.
3. Whether It Sold Sits Outside GSC#
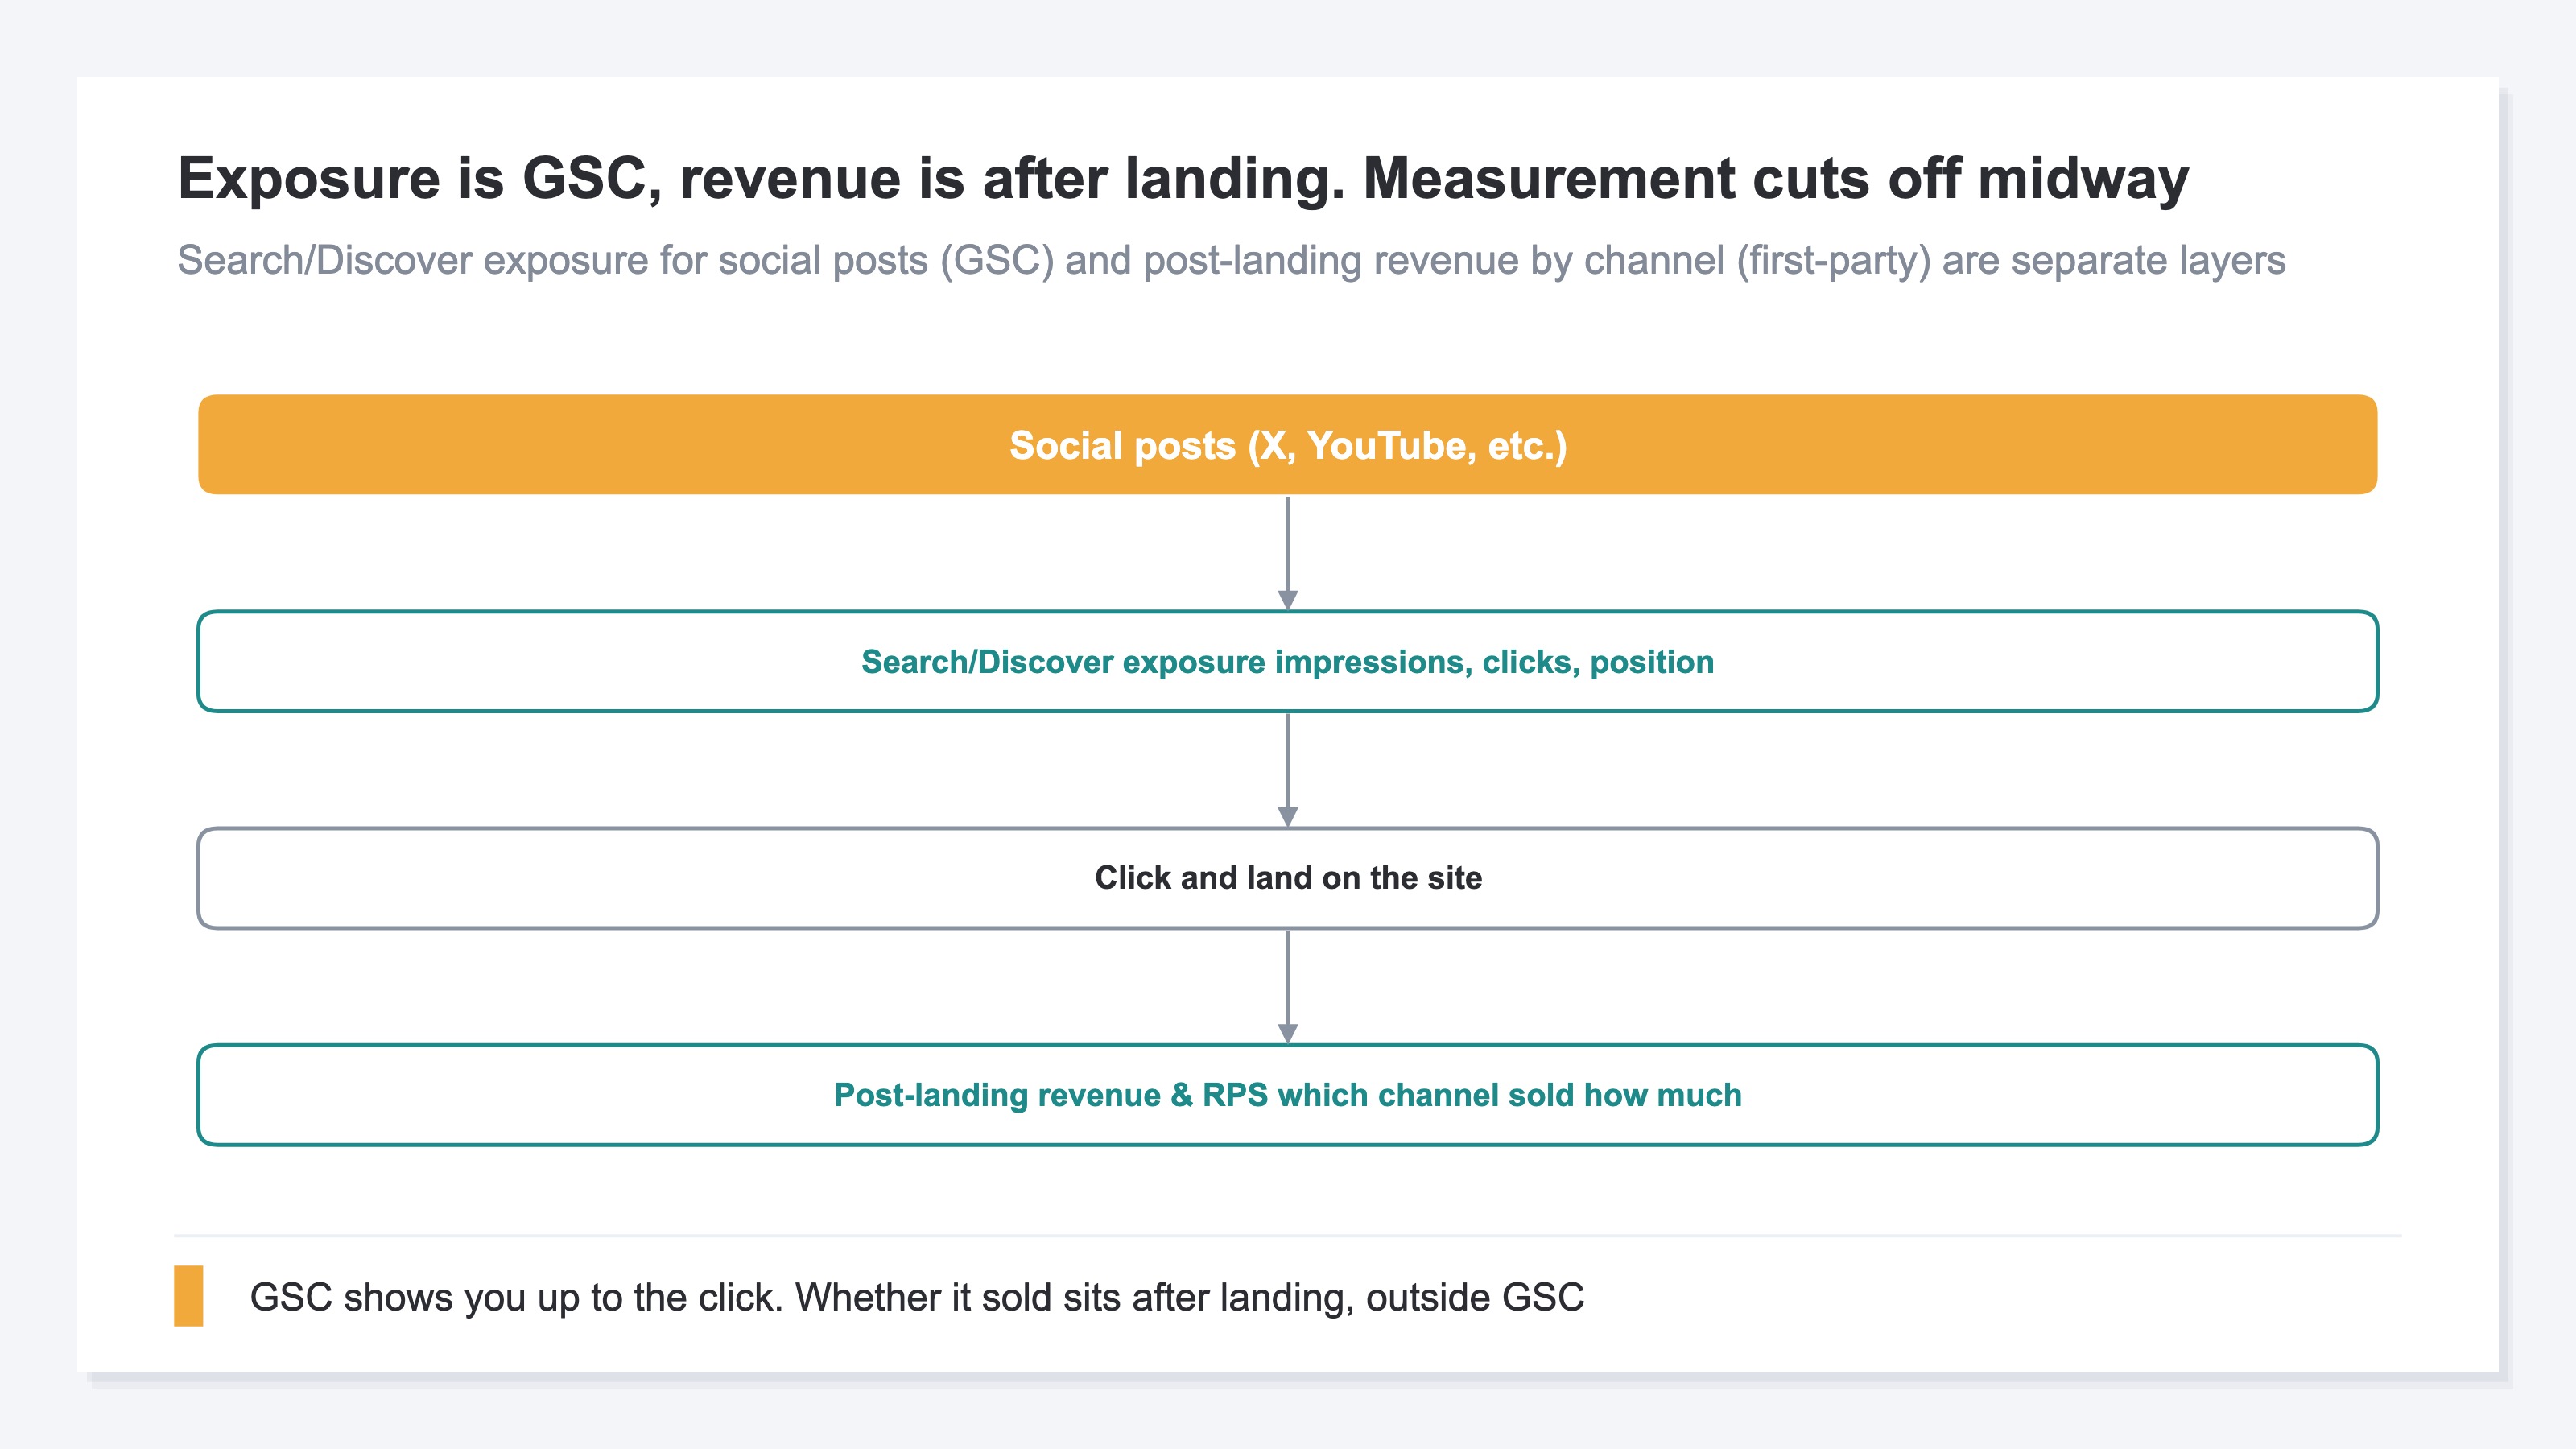
Bottom line: Revenue happens after someone lands on your site. So "whether it sold" connects not through search-side Google Search Console, but through your own post-landing measurement. GSC exposure and post-landing revenue are separate layers.
Draw where measurement cuts off, and the seam is clear. Social post → exposure in Search/Discover (GSC ends here) → click and land on the site → post-landing revenue and RPS. What GSC shows you is the middle — up to the click. What happened after landing doesn't enter GSC's reports.
The same thing happens with the AI-search exposure report: impressions show, but whether they became revenue can't be measured. That structure is covered in the problem where generative-AI performance shows but revenue doesn't. The more exposure reports you get, the more the "visible" and the "sold" get treated as the same thing.
One more caution: the search-side numbers and the post-landing numbers are different sources to begin with. GSC clicks are events in Google Search, tallied with a 2–3 day lag. Post-landing sessions are counted on your own site, in real time. These two differ in how and what they count, so the numbers won't match exactly. Read one off the other and you drift. Safer to see exposure as exposure and revenue as revenue, each on its own measurement.
4. Reading Social Traffic by Revenue#
Bottom line: Whether to invest time in social is decided by post-landing revenue and RPS (revenue per session) by channel, not by exposure volume. Only by lining up how much each source sold can you pick where to invest.
What you do is take the "posts that seem to be working" you found in the exposure report, and follow them through to post-landing revenue. Did the person who arrived from social move to the next page, buy, and how much? See this far, and a different picture emerges from the exposure impression. Traffic with lots of clicks but low RPS won't grow revenue much even if you add exposure. Conversely, plain-looking traffic with high RPS is worth adding exposure to.
The problem is that this post-landing view is heavy by hand. Social traffic tends to hide in Direct in GA4 [3], and a forgotten UTM makes the referrer vanish. Referral revenue, too, takes effort to trace which site actually worked. When exposure is in GSC, traffic in GA4, and revenue on another screen, just reconciling them burns time. Why social/app traffic turns into Direct is in why social and app traffic turns into Direct; how to measure referral revenue is in measuring revenue from referral traffic.
That's exactly why, once exposure gives you a lead, having post-landing revenue in one view speeds up the call. Rather than swinging with the rise and fall of exposure, see whether it sold afterward at the same granularity. That's the crux of the social investment decision.
RevenueScope's solution
Bottom line: RevenueScope splits post-landing traffic by channel and returns sessions, revenue and RPS in one view. See exposure from platform properties on Google, and see whether that exposure became revenue in RevenueScope — that's the division of labor. It connects exposure measurement and revenue measurement correctly, while keeping them as separate layers.
Here's the division of labor. The "search-side exposure" GSC shows is best viewed in Google's own report, and RevenueScope handles what comes next — after someone lands on the site, which channel sold how much. Exposure (GSC) and revenue (first-party) are separate layers, and RevenueScope shows the post-landing revenue by channel.
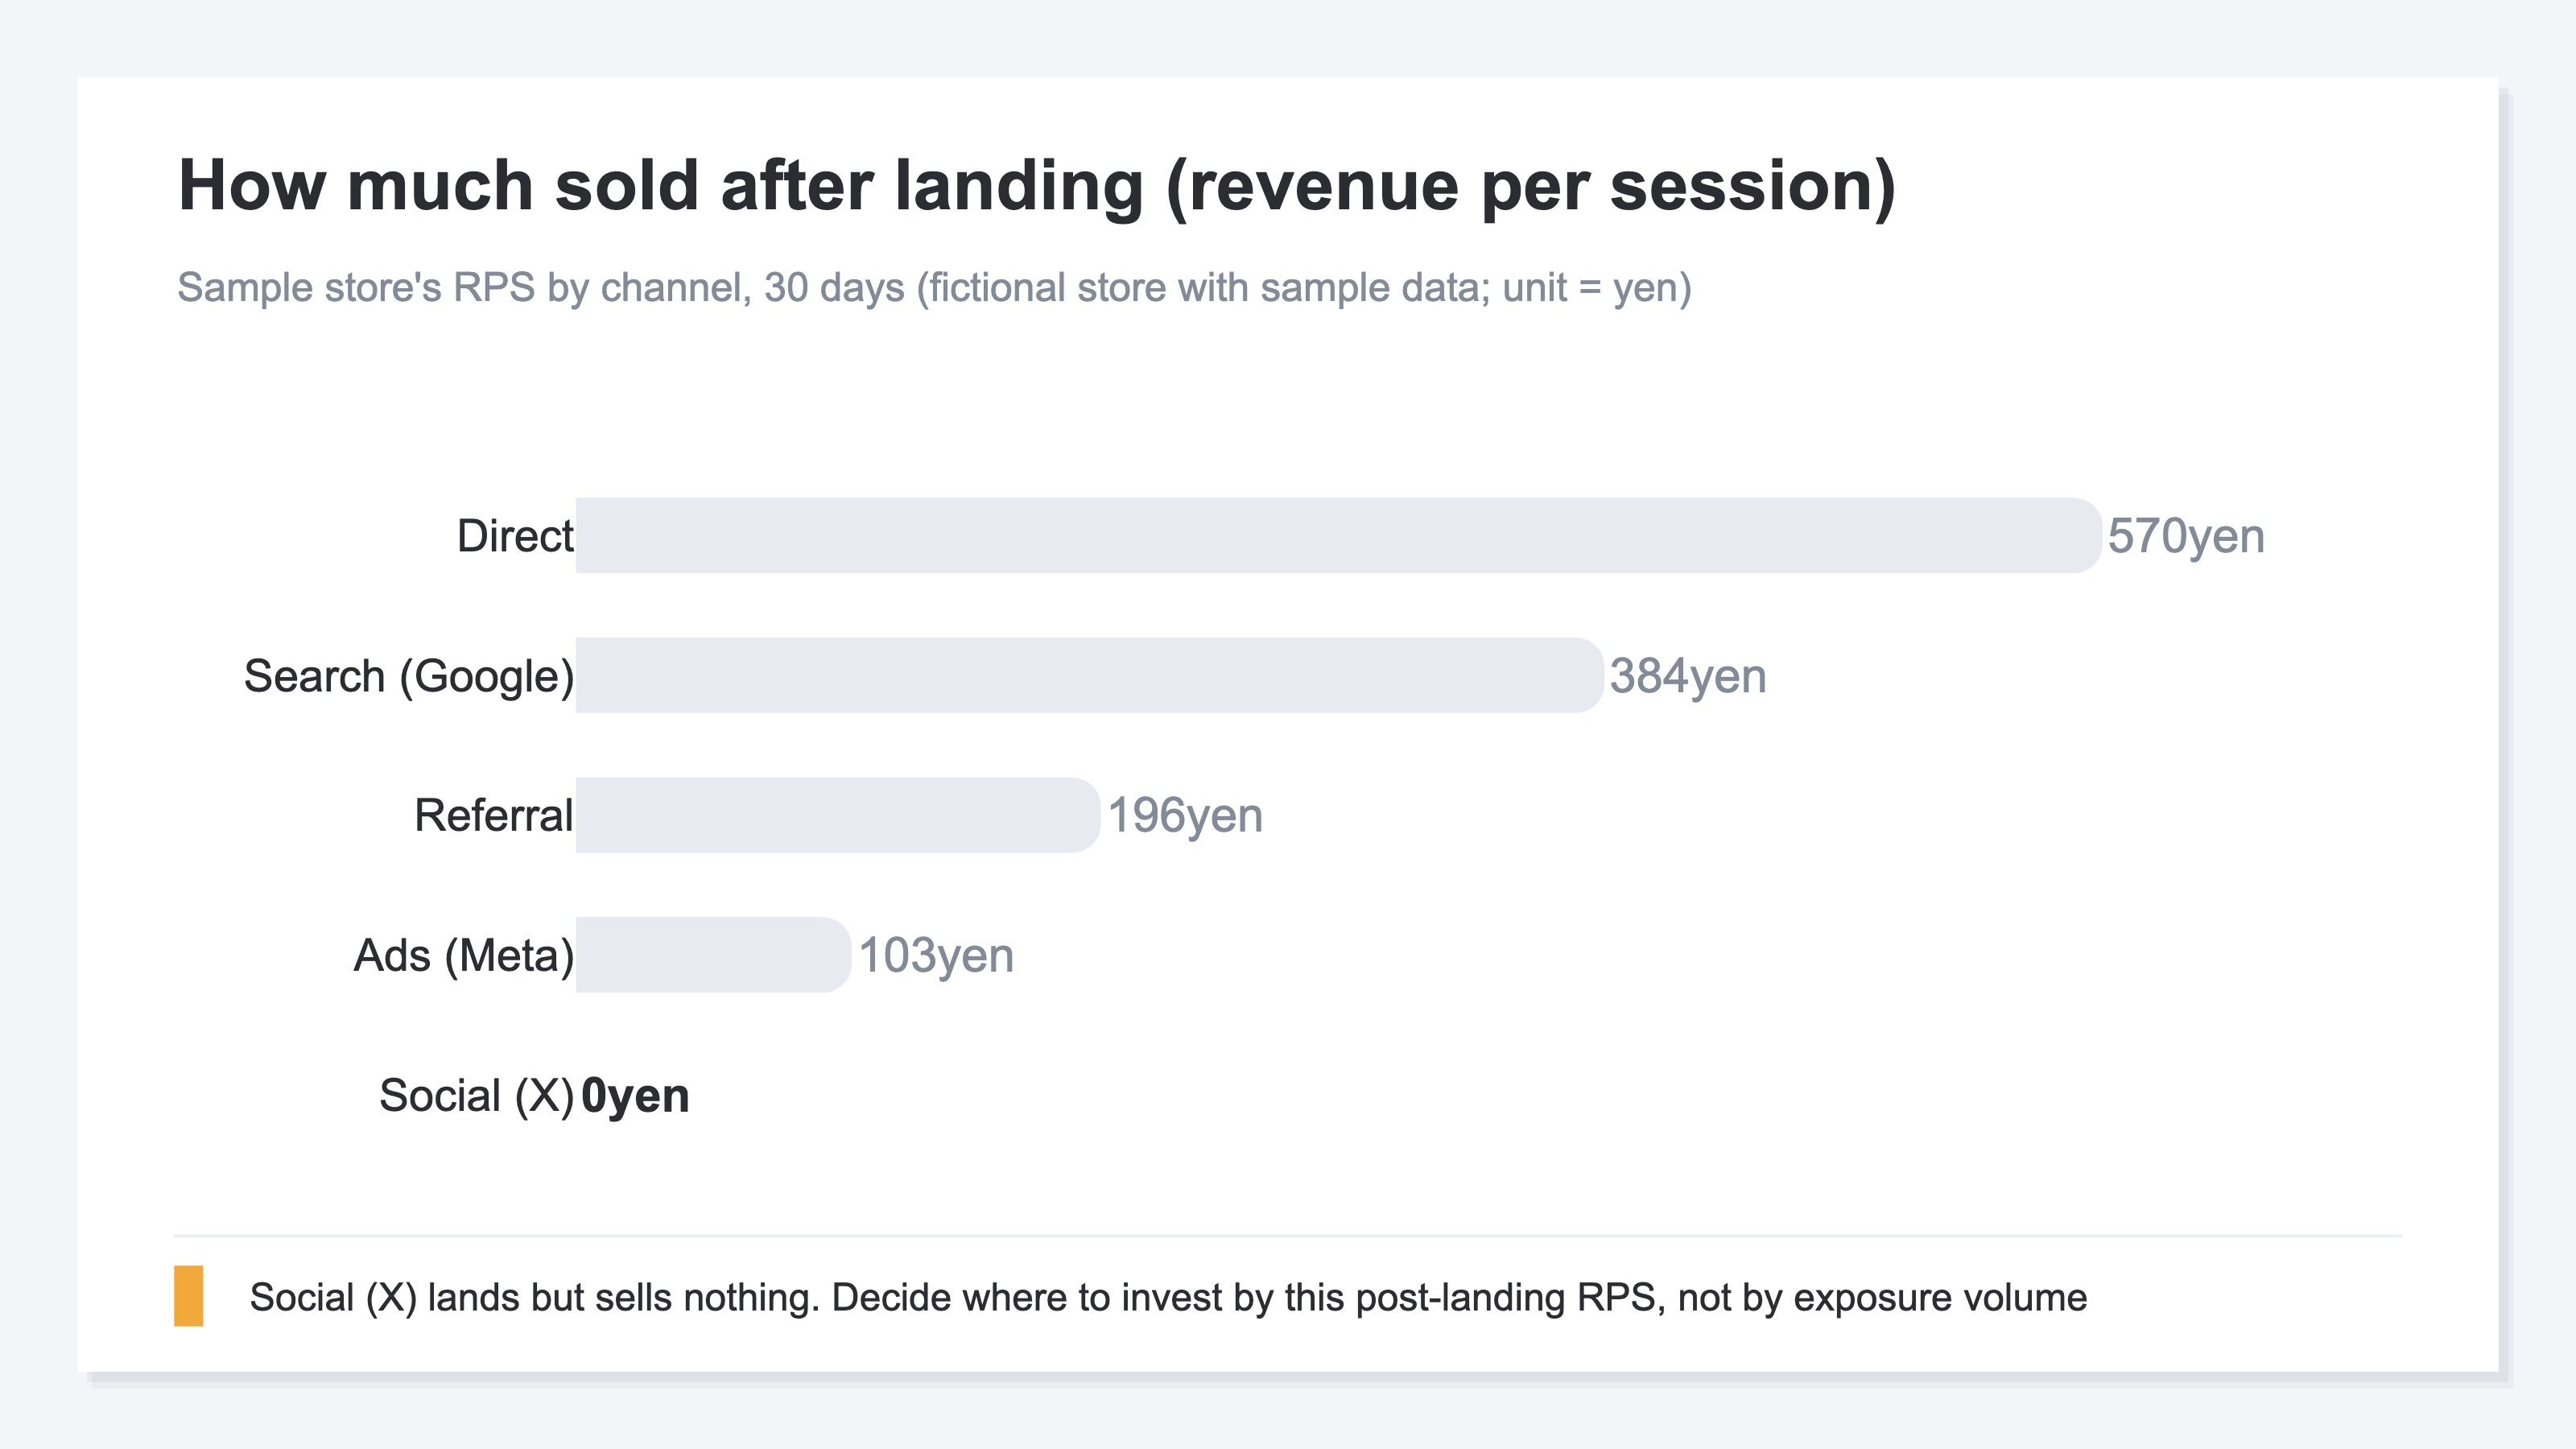
Look at post-landing by channel, and differences the exposure impression couldn't show emerge. Here's how it actually looks, with a sample store's data.
Sample store: revenue by channel (30 days)
| Channel | Sessions | Revenue (JPY) | RPS (JPY) |
|---|---|---|---|
| Social (X) | 27 | 0 | 0 |
| Ads (Meta) | 151 | 15,633 | 103 |
| Referral | 57 | 11,198 | 196 |
| Search (Google) | 282 | 108,558 | 384 |
Figures from a fictional store with sample data (RevenueScope demo). RPS is revenue per session. RevenueScope focuses on revenue-based metrics (revenue by channel and RPS).
In this sample, Social (X) brings in 27 sessions, but post-landing revenue is 0. Had you looked only at the exposure and click reports, you might have stopped at "X is growing." See through to post-landing, and you learn that X hasn't translated into revenue yet. Referral, meanwhile, has real RPS. Where to spend your time can be decided by these post-landing numbers.
RevenueScope also shows revenue tied to no channel as an "Unattributed" row rather than hiding it, and it can switch the attribution model (last click / first click, and so on) to compare how revenue is assigned. Traffic like social — which works for awareness but shows up less on the last click — looks different when you change the model. How to handle unattributed revenue is in the story of revenue tied to no channel (Unattributed).
RevenueScope breaks down post-landing traffic into revenue-based metrics — revenue by channel and RPS. Social and AI-referred traffic is classified by tracing the referrer, lining up how much each channel sold in one view. Once exposure gives you a lead, seeing post-landing revenue on the same screen to pick where to invest — that much you can move on from today.
FAQ#
Q. If I set up a platform property, will I see social revenue too?
A. No. What a platform property shows goes as far as exposure in Search and Discover (impressions, clicks, position). Whether that exposure became revenue is an event after landing on your site, outside GSC. RevenueScope splits that post-landing traffic by channel and returns sessions, revenue and RPS in one view — see exposure on Google, and whether it became revenue in RevenueScope.
Q. If exposure (clicks) is rising, can I assume results are coming?
A. It's a rough sign of traction, but not the result itself. A click is a count of entrances, not of purchases. The post with the most exposure and the one selling the most don't always match. Safer to use exposure to get a lead, then make the final call on post-landing revenue and RPS — a two-step read.
Q. GSC clicks and my site's sessions don't match. Which is correct?
A. Both are correct; they just count different things. GSC tallies Google-search exposure and clicks with a 2–3 day lag, while your site counts landed sessions in real time. Different sources, different granularity, so not matching is by design. Don't read one off the other — see exposure as exposure and revenue as revenue.
Summary#
Google Search Console's platform properties make the Search/Discover exposure of social posts visible. A genuine step forward — but what's visible stops at the click. That exposure grew and that revenue grew are different, and "whether it sold" sits after landing, outside GSC. The size of exposure and the size of revenue can reverse, and deciding post priority on exposure alone misses that reversal. Whether to invest time in social is decided by post-landing revenue and RPS by channel. See exposure in Google's report, and see whether that exposure became revenue in post-landing measurement — keeping that division of labor is the read that's hardest to get wrong.
See which ads actually drive revenue, at a glance
Free up to 2,000 sessions/month, AI connection included. No credit card required. Up and running in 5 minutes.