
"These impressions in my ad dashboard — is the number high?" If you run an EC store, you see this metric every time you open Google Ads, Meta Ads, or a social dashboard. But how many is "enough" stumps even practitioners.
The bottom line: an impression counts how many times an ad or post was shown. More is not automatically better — you judge whether those displays turned into clicks and sales. Impressions are also often confused with reach (the number of people reached), but the two are different.
Below we cover the definition, the difference from reach and pageviews, how impressions are counted, their link to CTR and CPM, how to read them by channel, four ways to grow them, and three steps to measure your own impressions.
Table of contents
Summary at a glance#
-
An impression = one display of an ad or post
It is counted as 1 each time an ad appears on screen — the very first metric in the funnel. Google Ads labels it "impressions."
-
Reach (number of people) is a different thing
If one person sees the same ad 3 times, reach is 1 and impressions are 3. Impressions include repeat views.
-
Growing impressions is not the goal in itself
More displays do not move revenue unless they lead to clicks and conversions. Judge quality together with CTR and sales.
1. What is an impression — the number of times shown#
The bottom line: an impression is the number of times an ad or post was displayed on a user's screen.
An impression is counted as 1 every time an ad or post appears on a user's screen. Google Ads uses the label "impressions," incrementing the count each time an ad shows on a search result or a site [1].
Its role is to measure how widely an ad went out. It is the entry-level volume metric, so if it is low, neither clicks nor conversions can grow. The first pitfall, though, is that a display alone does not translate into revenue.
1.1 How it differs from reach and pageviews#
Impressions are often confused with reach and pageviews (PV). They measure different things, so here is a comparison.
| Metric | What it measures | How duplicates are handled |
|---|---|---|
| Impressions | Times an ad or post is displayed | Repeat views to the same person are all counted |
| Reach | Unique people an ad reached | The same person is counted once |
| Pageviews (PV) | Times a page on your own site is opened | Counted per page |
The most important distinction is from reach. If one user sees the same ad 3 times, reach is "1" and impressions are "3." Impressions include how many times you showed an ad to the same person (frequency); reach does not. Use reach when you want to see how wide your awareness is, and impressions when you want the total volume of displays or the frequency.
2. How impressions are counted, and their link to CTR and CPM#
The bottom line: impressions are counted as "1 per display," and they form the denominator of CTR and CPM.
Counting is simple — one display of an ad or post equals one impression. Even repeat displays to the same person are counted each time.
Impressions matter because they are the denominator of other ad metrics. Look at the two most common relationships.
CTR = Clicks ÷ Impressions
CPM = Ad spend ÷ Impressions × 1,000
CTR expresses "how many of the displays were clicked," and CPM expresses "the ad cost per 1,000 displays." Since impressions are the denominator of both, changing the number of displays moves both figures.
2.1 CTR and CPM sit on top of impressions#
For example, if displays double but clicks stay the same, CTR halves. When "impressions rose but results didn't change," the added impressions may be low quality. For how to read click rate, see What Is CTR?; for cost per click, see What Is CPC?.
3. Reading impressions by channel, and the pitfalls#
The bottom line: the same number of impressions converts to clicks at very different rates depending on the channel.
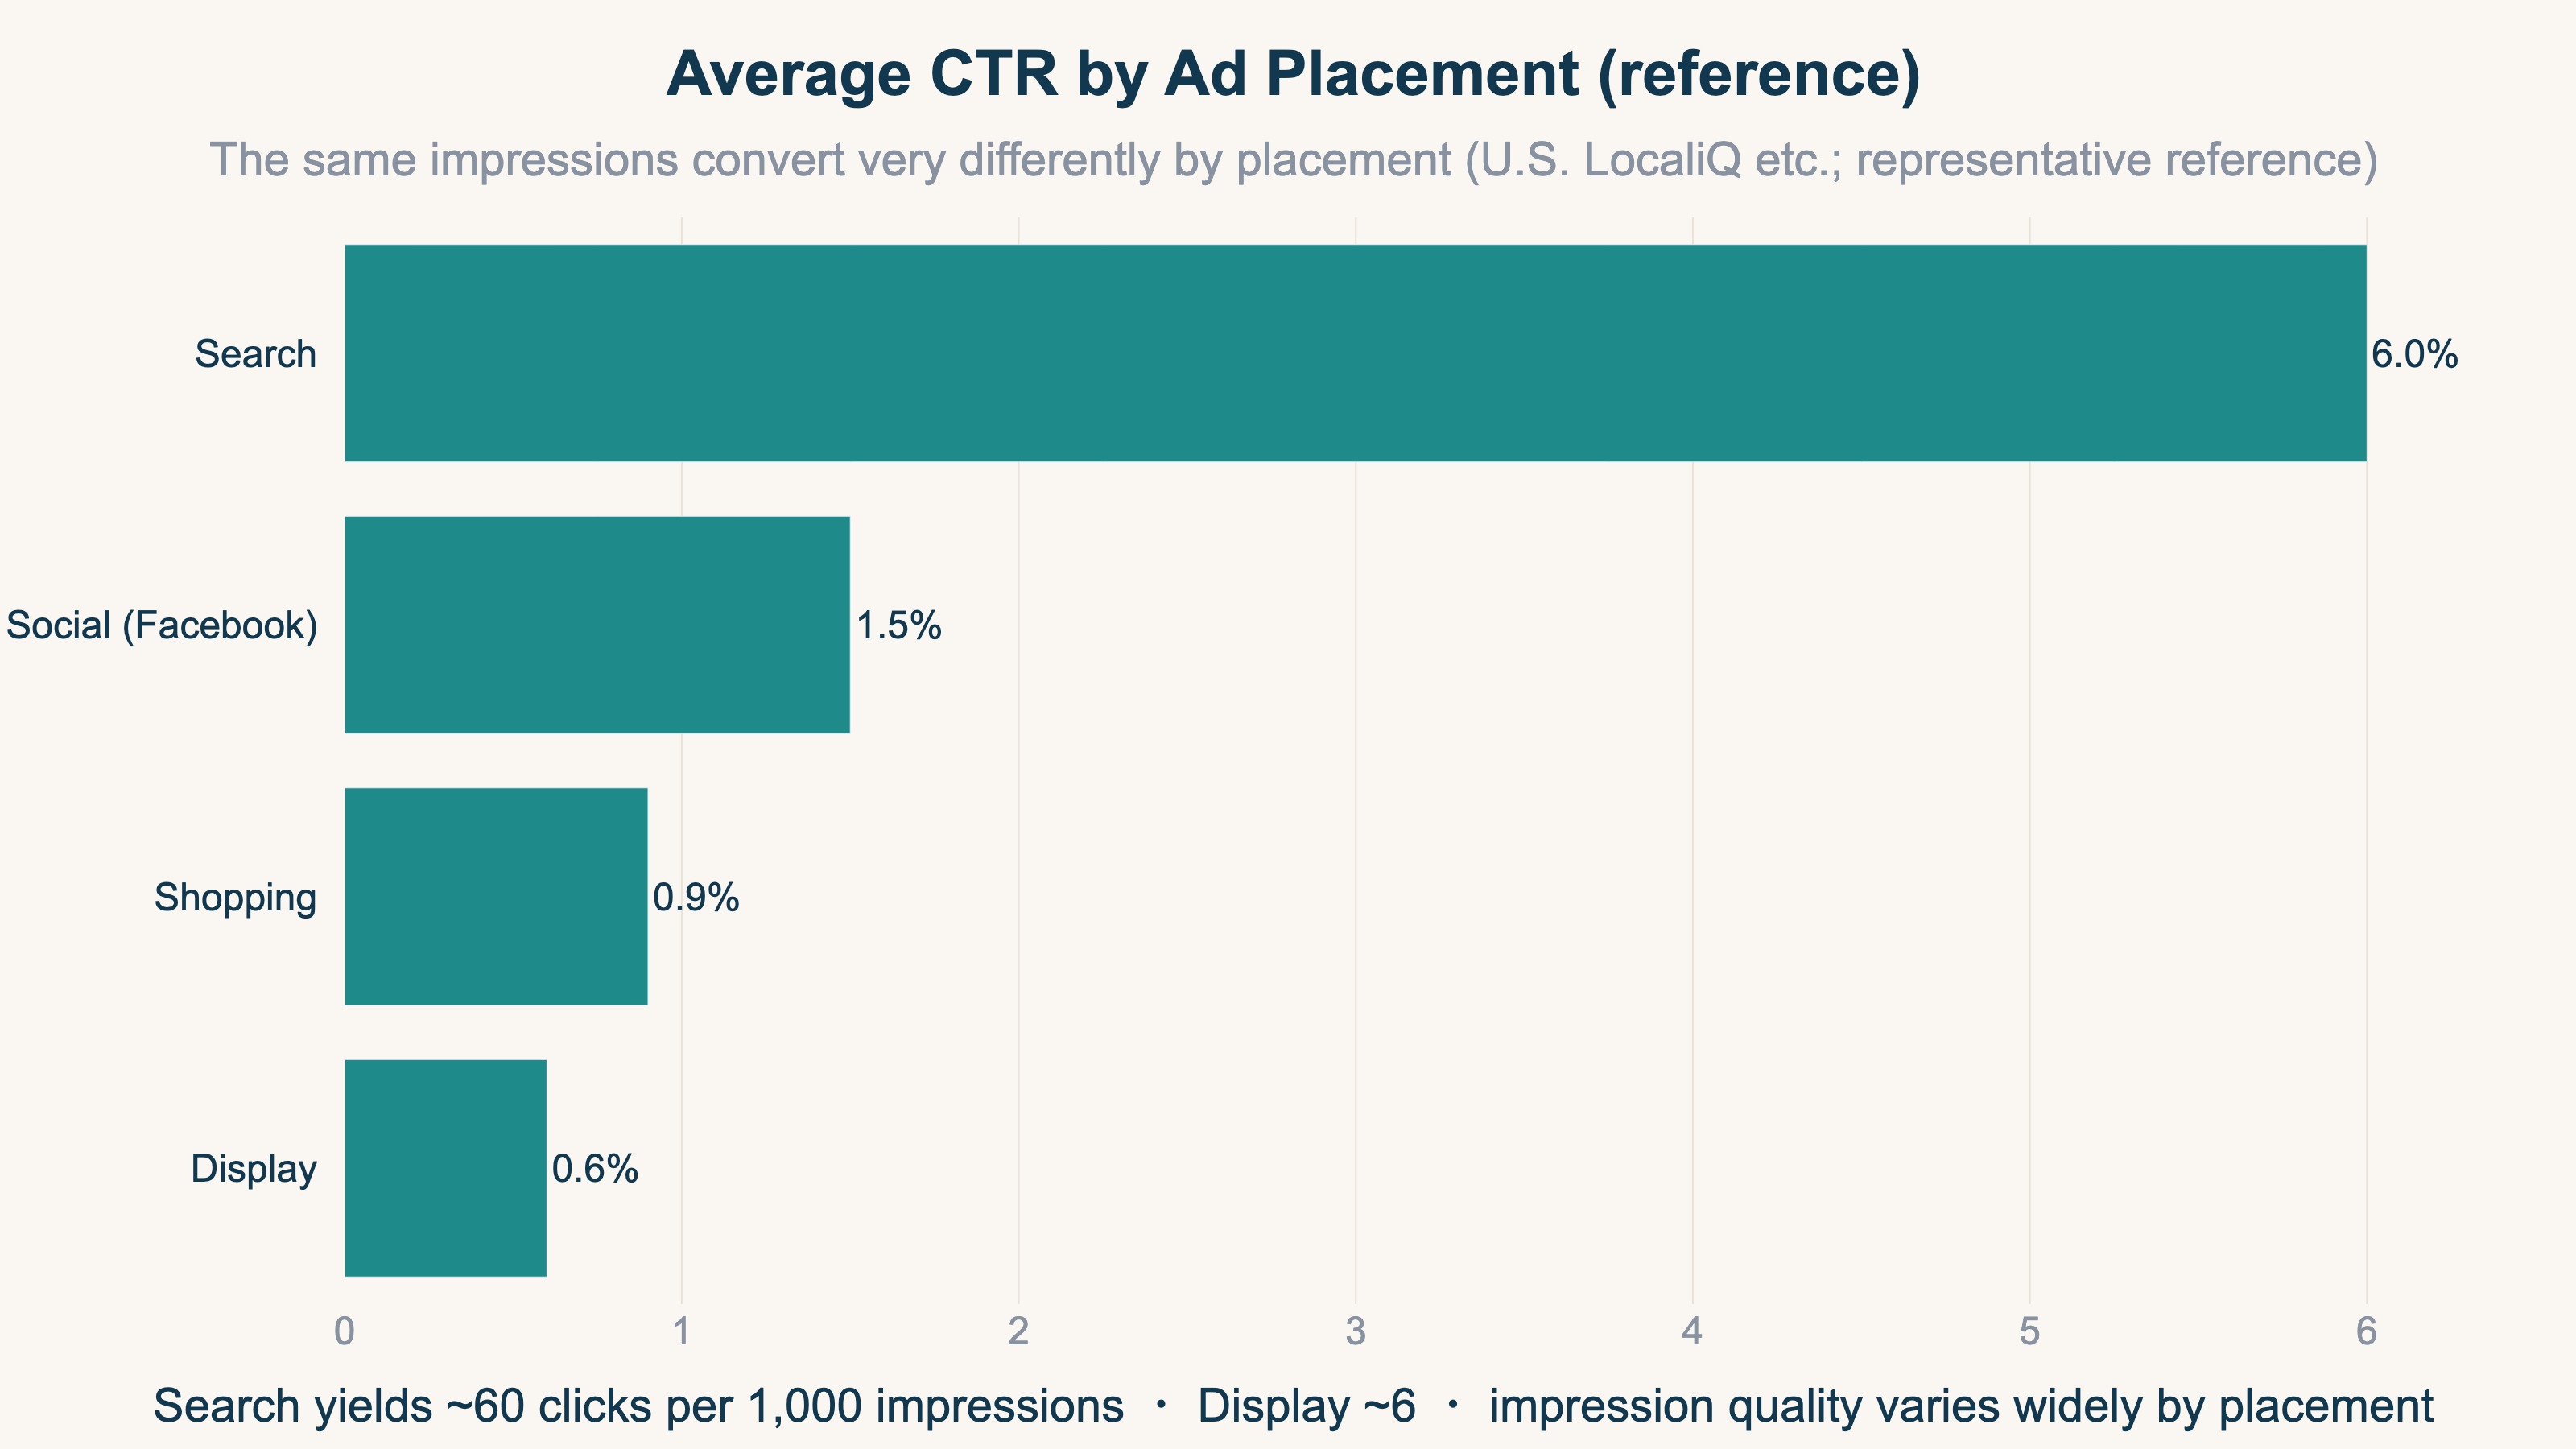
Search ads appear to people who are actively looking, so their click rate is high; display ads appear "in passing," so theirs is low. With the same 1,000 impressions, search may yield dozens of clicks while display yields only a few. As a representative reference, average CTR runs around 6% on search, 1.5% on social, and 0.6% on display (based on U.S. benchmarks such as LocaliQ [3]; figures differ in Japan).
The pitfall is jumping to "impressions grew, so it's working." Display and video placements pile up impressions easily, and the raw numbers look strong. But if the quality of those displays — whether they lead to clicks and conversions — does not follow, you only burn ad spend. When you compare impressions across channels, always read them together with CTR and conversions.
4. Four ways to grow impressions#
The bottom line: you can grow impressions in four places — budget, bids, targeting, and placements.
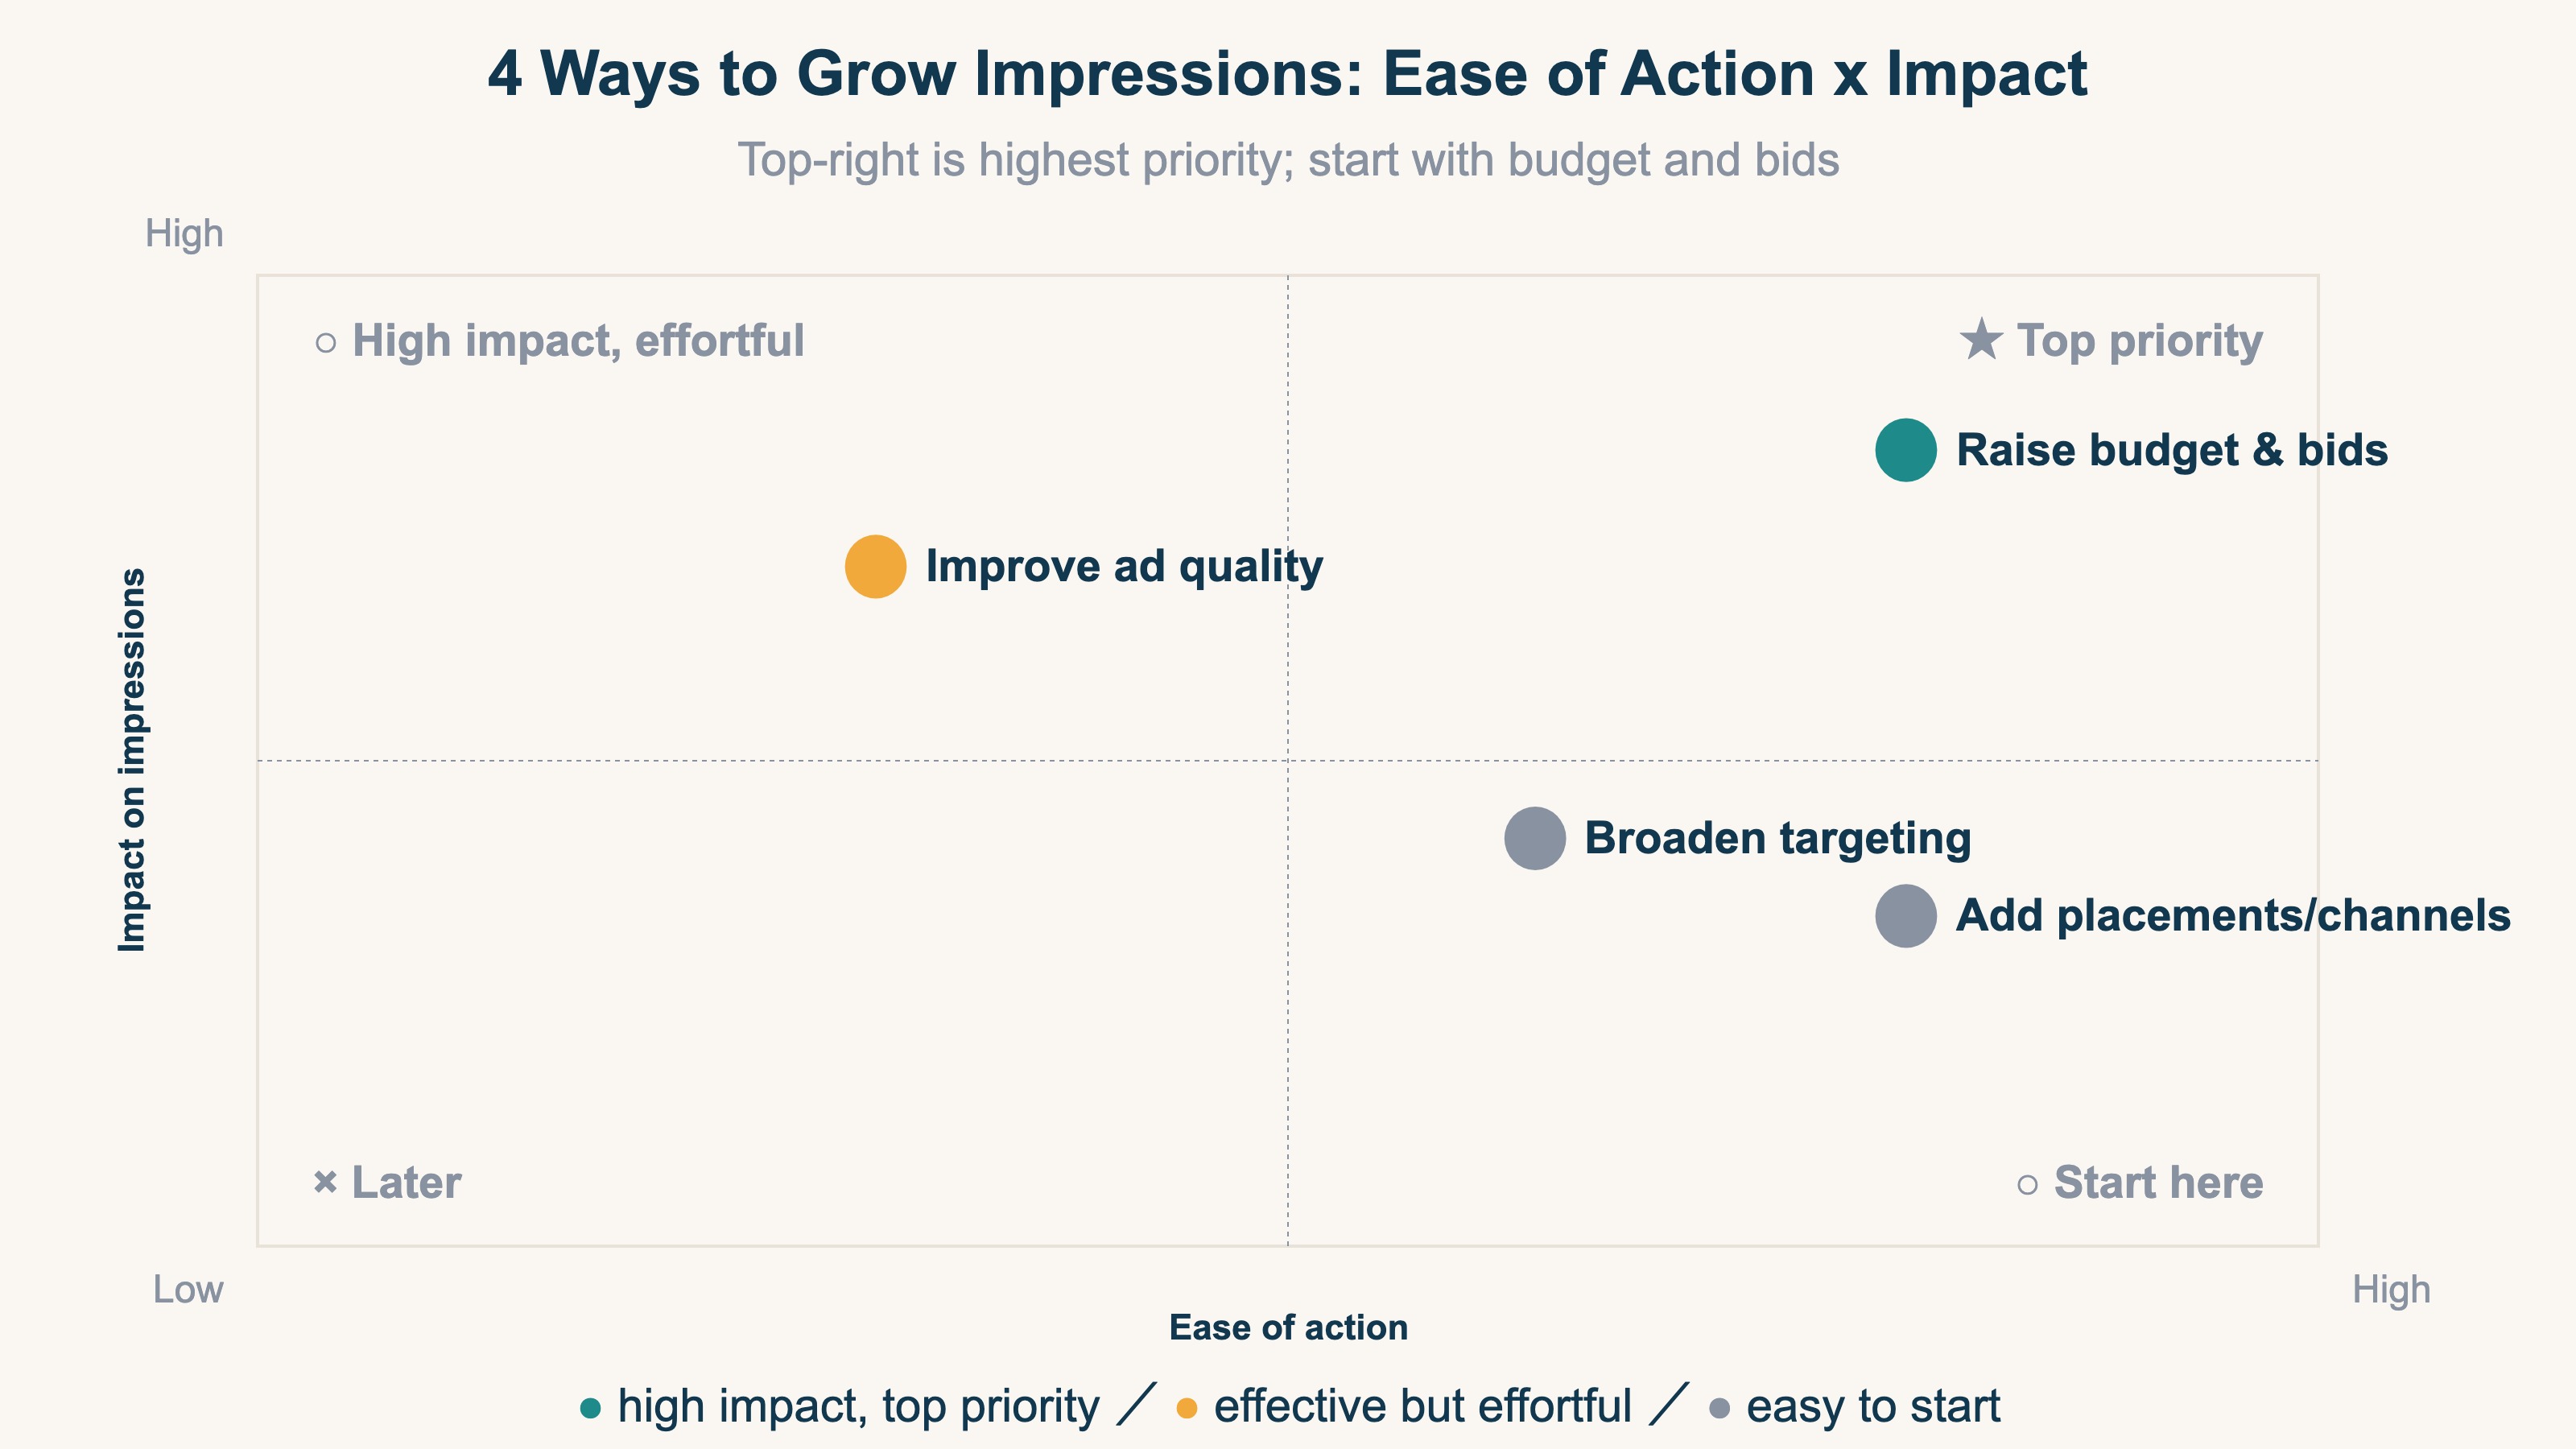
The highest-priority levers are the ones with large impact that are also easy to start.
- Raise budget and bids — the most direct way to lift delivery caps; fast-acting.
- Broaden targeting — widen region, age, and keywords to enlarge the eligible audience.
- Improve ad quality and relevance — a higher quality score or engagement tends to grow displays for the same budget.
- Add placements and channels — extend beyond search to display and social to add display opportunities.
For every lever, the precondition is watching "whether the added displays lead to clicks and conversions." Growing volume while ignoring quality drops CTR and wastes ad spend.
FAQ#
Q. Why doesn't revenue rise even though impressions are high?
Because impressions only measure "how many times shown." They are the entry of the display → click → conversion funnel, and if click-through rate (CTR) or conversion rate (CVR) is low, revenue will not move. Separate the volume and the quality of displays.
Q. Impressions or reach — which should I watch?
It depends on your goal. Use reach to widen awareness among new audiences; use impressions and frequency to manage total volume and how often the same person is touched. Side by side they show "how many people, how many times."
Q. What is a viewable impression?
A display that actually appeared within the screen, where the user had a chance to see it. It separates ads that genuinely came into view from those that were never scrolled to — measuring whether an ad not only "served" but "reached a visible position."
6. See impression quality in revenue — channel-level "revenue per impression"#
The bottom line: chasing impression volume alone does not move revenue. Display quality only becomes visible as "how much each channel sells per impression."
The idea itself is simple. For each channel or ad, read "display → click → conversion → revenue" as one connected flow, and compare by revenue per display. That lets you tell apart a channel with many displays but thin revenue from one with few displays but rich revenue.
What is heavy is keeping it aligned every month. Standardizing channel definitions, excluding bot displays and clicks, separating unattributed (Direct-buried) traffic, and stitching displays through clicks, conversions, and revenue — doing this prep by hand every month does not last. And GA4's standard reports have no view that compares revenue per impression across channels on one screen. They show impressions and sessions, but offer no feature to align "how much a display contributed to revenue" across channels on the same basis.
RevenueScope's solution
RevenueScope excludes bots with its own tracking, returns Direct-buried traffic to its true channel, and lets you compare each channel's displays, sessions, revenue, conversion rate, and revenue per display on a single screen.
| Channel | Impressions | CTR | Revenue per impression |
|---|---|---|---|
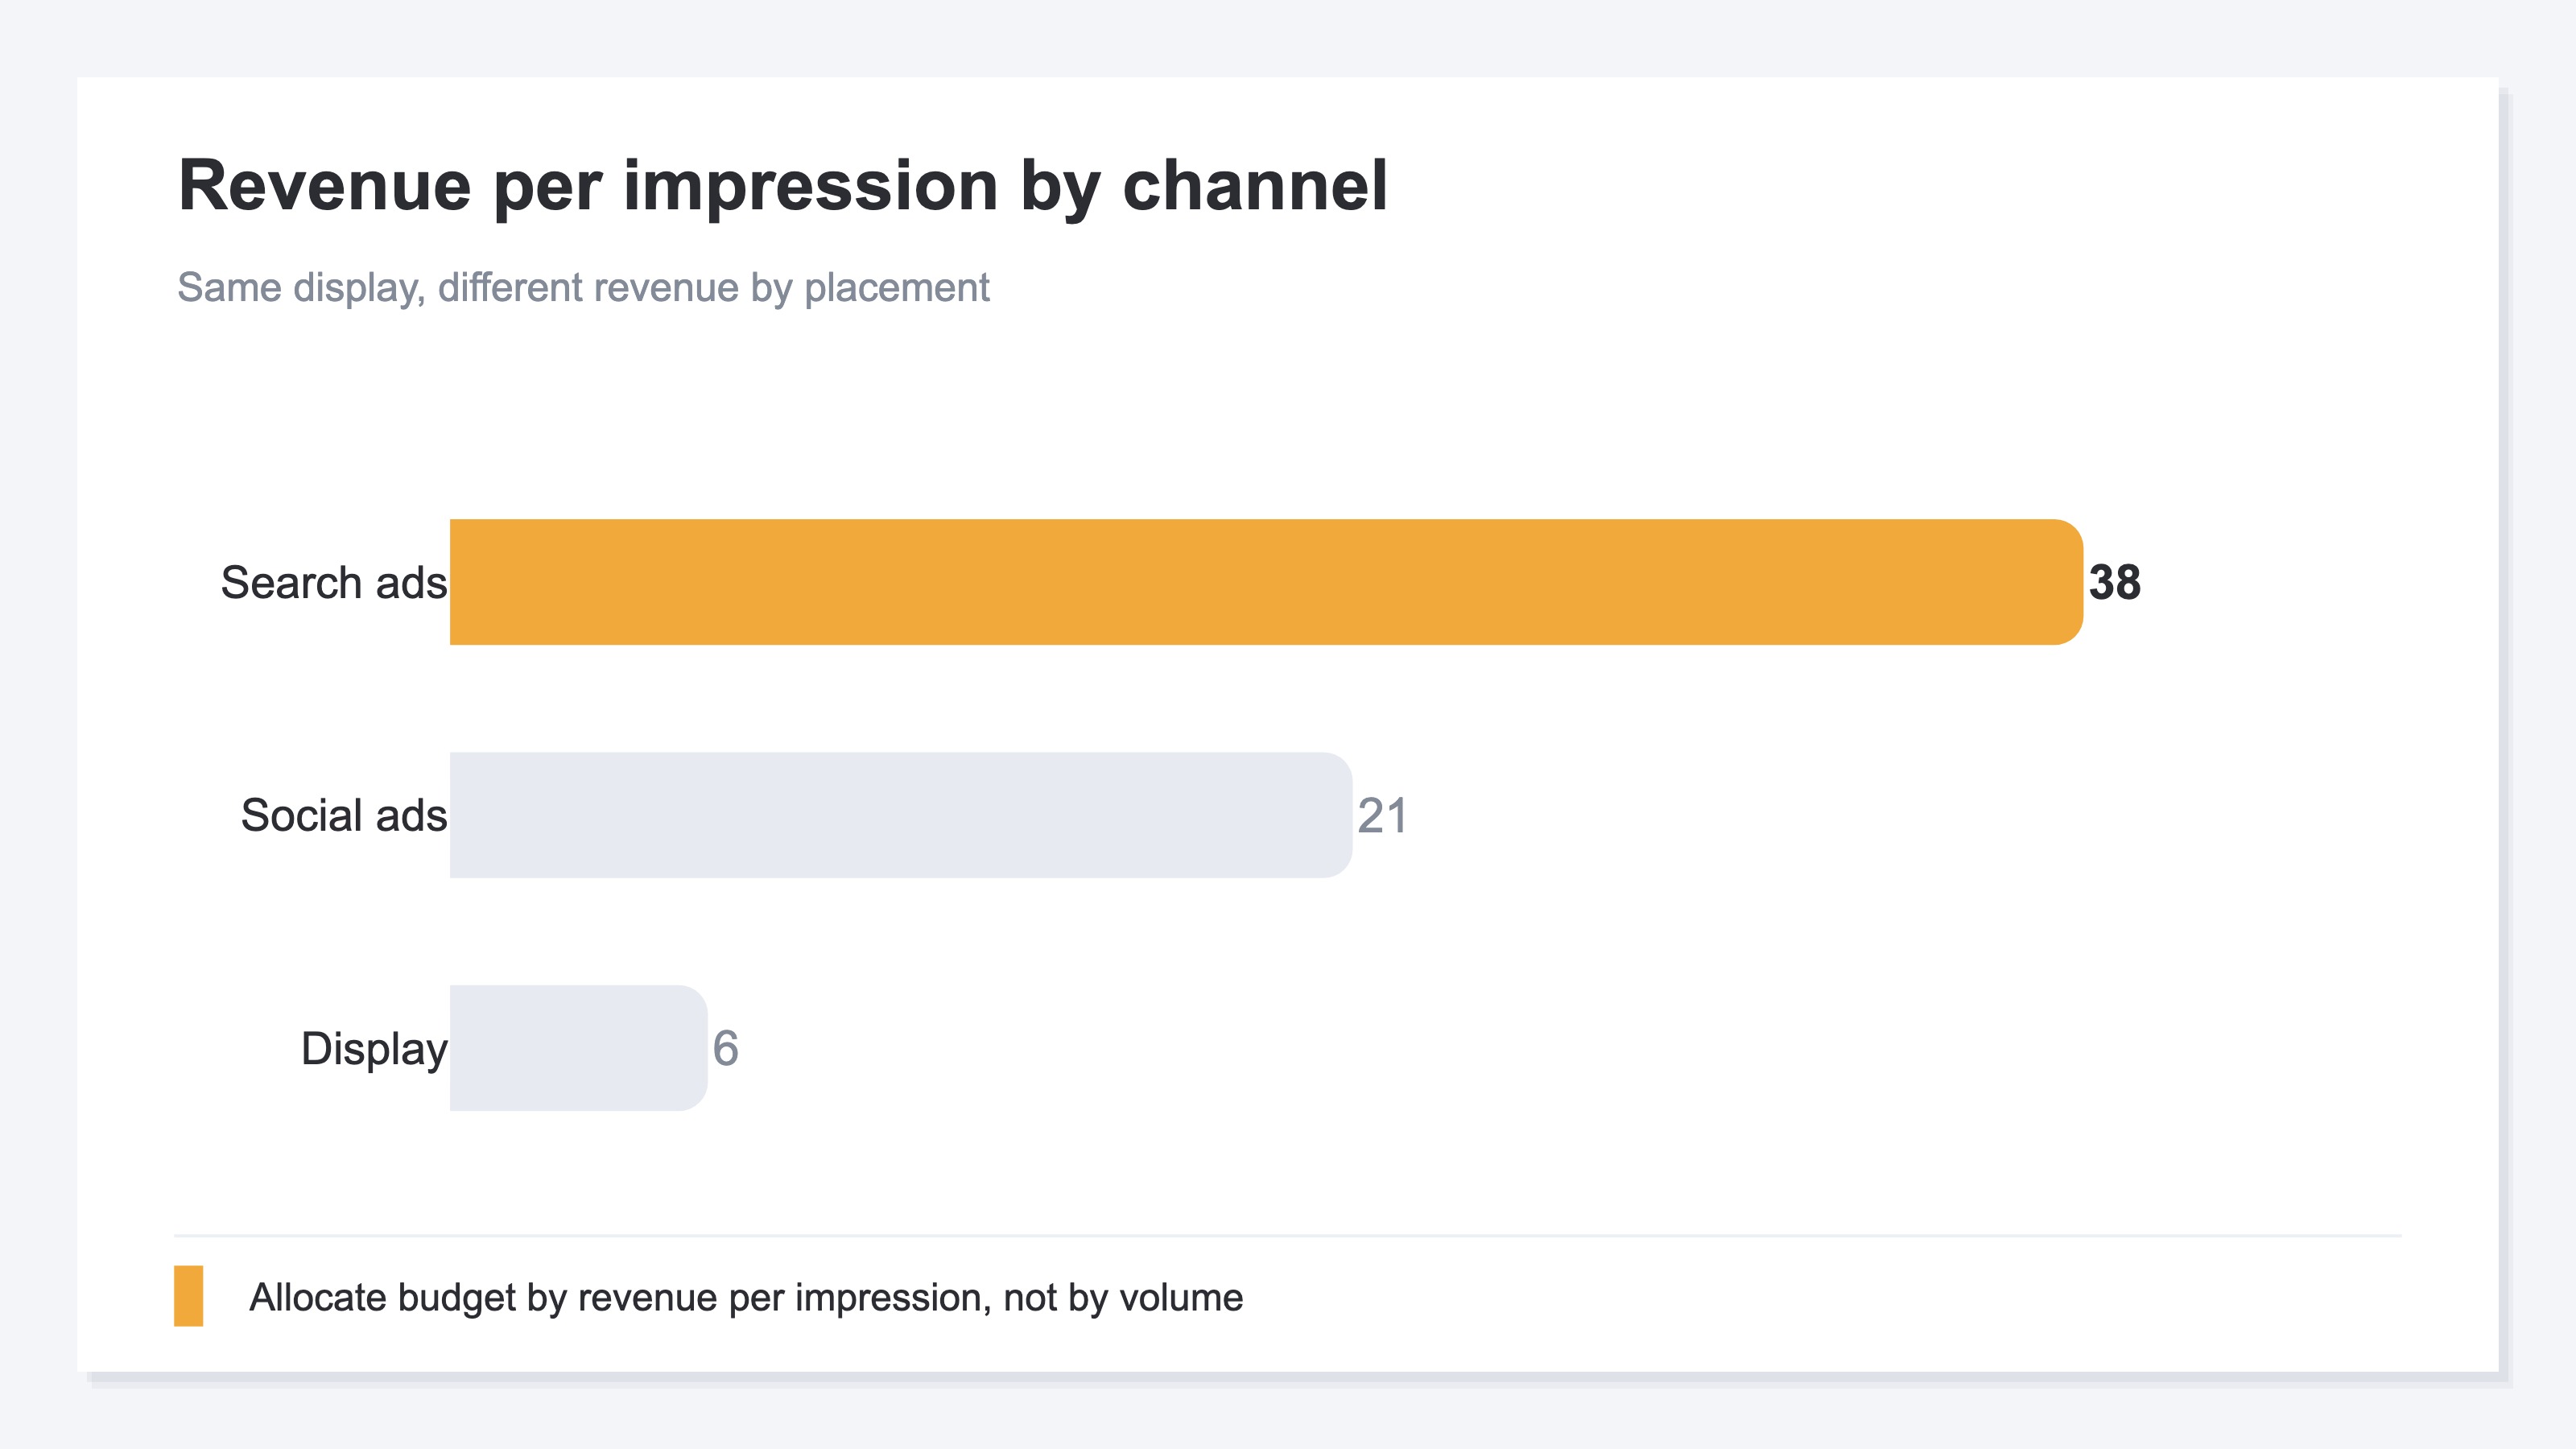
| Search ads | 12,000 | 6.2% | ¥38 |
| Social ads | 30,000 | 1.4% | ¥21 |
| Display | 85,000 | 0.5% | ¥6 |
RevenueScope's by-channel view (demo data). Display, with the most impressions, lands last in revenue per impression — a reversal you cannot catch by watching volume alone.
Only once you have separated this can you tell — by revenue, not gut — which channels to grow impressions for and which need better display quality (click and conversion rates). For UTM tagging see How to Use UTM Parameters Correctly, for revenue-per-visit see RPS Basics, and for the full metric picture Marketing KPI Design.
Summary#
An impression is the entry-level ad metric for "the number of times an ad or post was displayed." It is different from reach (the number of people reached) and includes repeat displays to the same person. Because impressions are the denominator of CTR and CPM, those figures move whenever displays change. There are four levers to grow impressions — budget, bids, targeting, and placements — but chasing volume alone lowers CTR and wastes spend.
Ultimately you judge by "how much that display contributed to revenue." But excluding bots per channel and aligning revenue per display on the same basis is heavy to repeat by hand every month, and GA4's standard reports have no single-screen view for it. Separate volume from quality, and only when you read channel-level revenue per impression do you truly put impressions to work for revenue decisions.
See which ads actually drive revenue, at a glance
Free up to 5,000 sessions/month, AI analyst included. No credit card required. Up and running in 5 minutes.
References#
- Google Ads Help, "About impressions," official help [1]
- Google Ads Help, "About clickthrough rate (CTR)," official help [2]
- LocaliQ, "Search Advertising Benchmarks," benchmark report [3]
- Dentsu, "Advertising Expenditures in Japan 2024," press release, February 2025 [4]


![[Research] More AI Traffic Isn't Proof It Worked: Tell the Real Gain by Revenue](/_next/image?url=%2Fimages%2Fnews%2Fai-referral-revenue-real.jpg&w=3840&q=75)
