![[Research] More AI Traffic Isn't Proof It Worked: Tell the Real Gain by Revenue](/_next/image?url=%2Fimages%2Fnews%2Fai-referral-revenue-real.jpg&w=3840&q=75)
Traffic from ChatGPT or Gemini is up compared to before. Reading that as "our AI optimization worked" is, in fact, too quick. Recent research argues that most of the rise in AI traffic is explained by the platform's own growth, while the effect of the optimization itself is far smaller. In other words, the big multiplier in the headline overstates the cause. So how do you tell, out of all that extra traffic, the part your own work actually produced? This article covers why more traffic doesn't mean it worked, why the raw multiplier overstates the effect, and the two views that reveal the real gain.
Table of contents
TL;DR#
- More AI traffic alone doesn't prove "the optimization worked." Recent research argues most of the rise is platform growth as AI spread, with the optimization's own effect far smaller.
- The raw multiplier (how many times bigger than before) mixes growth and effect, so it overstates the cause of your work.
- The real gain shows up two ways: the difference against pages you didn't optimize, and whether the extra traffic actually buys (revenue per session).
- GA4's raw numbers are skewed too — by bots and by traffic lost to "source unknown (Direct)." Separate AI traffic and line it up with revenue, or the real gain stays hidden.
1. More traffic doesn't mean it worked#
Bottom line: more AI traffic alone doesn't prove your optimization worked, because growth as AI spread can account for most of the rise.
Lately, far more people use ChatGPT and Gemini. So even if you do nothing, AI-driven visits rise on their own. It's a "rising tide lifts all boats" situation — when the tide comes in, even a boat doing nothing floats up. So "AI traffic rose" by itself can't tell you whether it's thanks to your work, or just the tide coming in.
A quick word on what "AI optimization" means: it's the work of making your site easier for AI to cite and surface (researchers call it "AEO," Answer Engine Optimization). Think of shaping how pages are written and including information that's easy to cite.
One thing to make clear: one of the studies behind this is "Disentangling Answer Engine Optimization from Platform Growth: A Log-Based Natural Experiment on ChatGPT Referral Traffic." Using one site's access logs, it compared pages that were optimized against pages that weren't, trying to isolate the optimization's effect [1]. The subject is a knowledge-sharing site (glasp.co), but the skeleton — "a rise in traffic mixes growth and effect" — likely applies to any site that gets AI traffic, e-commerce and service sites included. The numbers themselves are about that site, so read them here as a rough guide. This study is still a preprint (not yet peer-reviewed), so treat it as "this kind of argument is emerging," not as "proven." How it actually plays out is best confirmed with your own site's data.
2. Why the raw multiplier overstates the effect#
Bottom line: the raw multiplier (how many times bigger than before) mixes the growth of AI itself with your own effect, so it makes your work look bigger than it is.
The study makes this split clear in numbers. It reports that total ChatGPT referrals grew about 5.7x. But looking only at pages that were not optimized, those grew about 3.5x. In other words, even pages where nothing was done rose 3.5x — that 3.5x is growth as AI spread, unrelated to the work. And the effect of the optimization itself, isolated from the difference between optimized and non-optimized pages, was reported as about 1.82x [1].
The chart below compares these three numbers as an illustration. It's tempting to take the leftmost "raw rise (5.7x)" as your achievement, but most of it is growth, and the part the work produced (1.82x) is far smaller. Look only at the raw multiplier and you overstate the effect by nearly threefold.
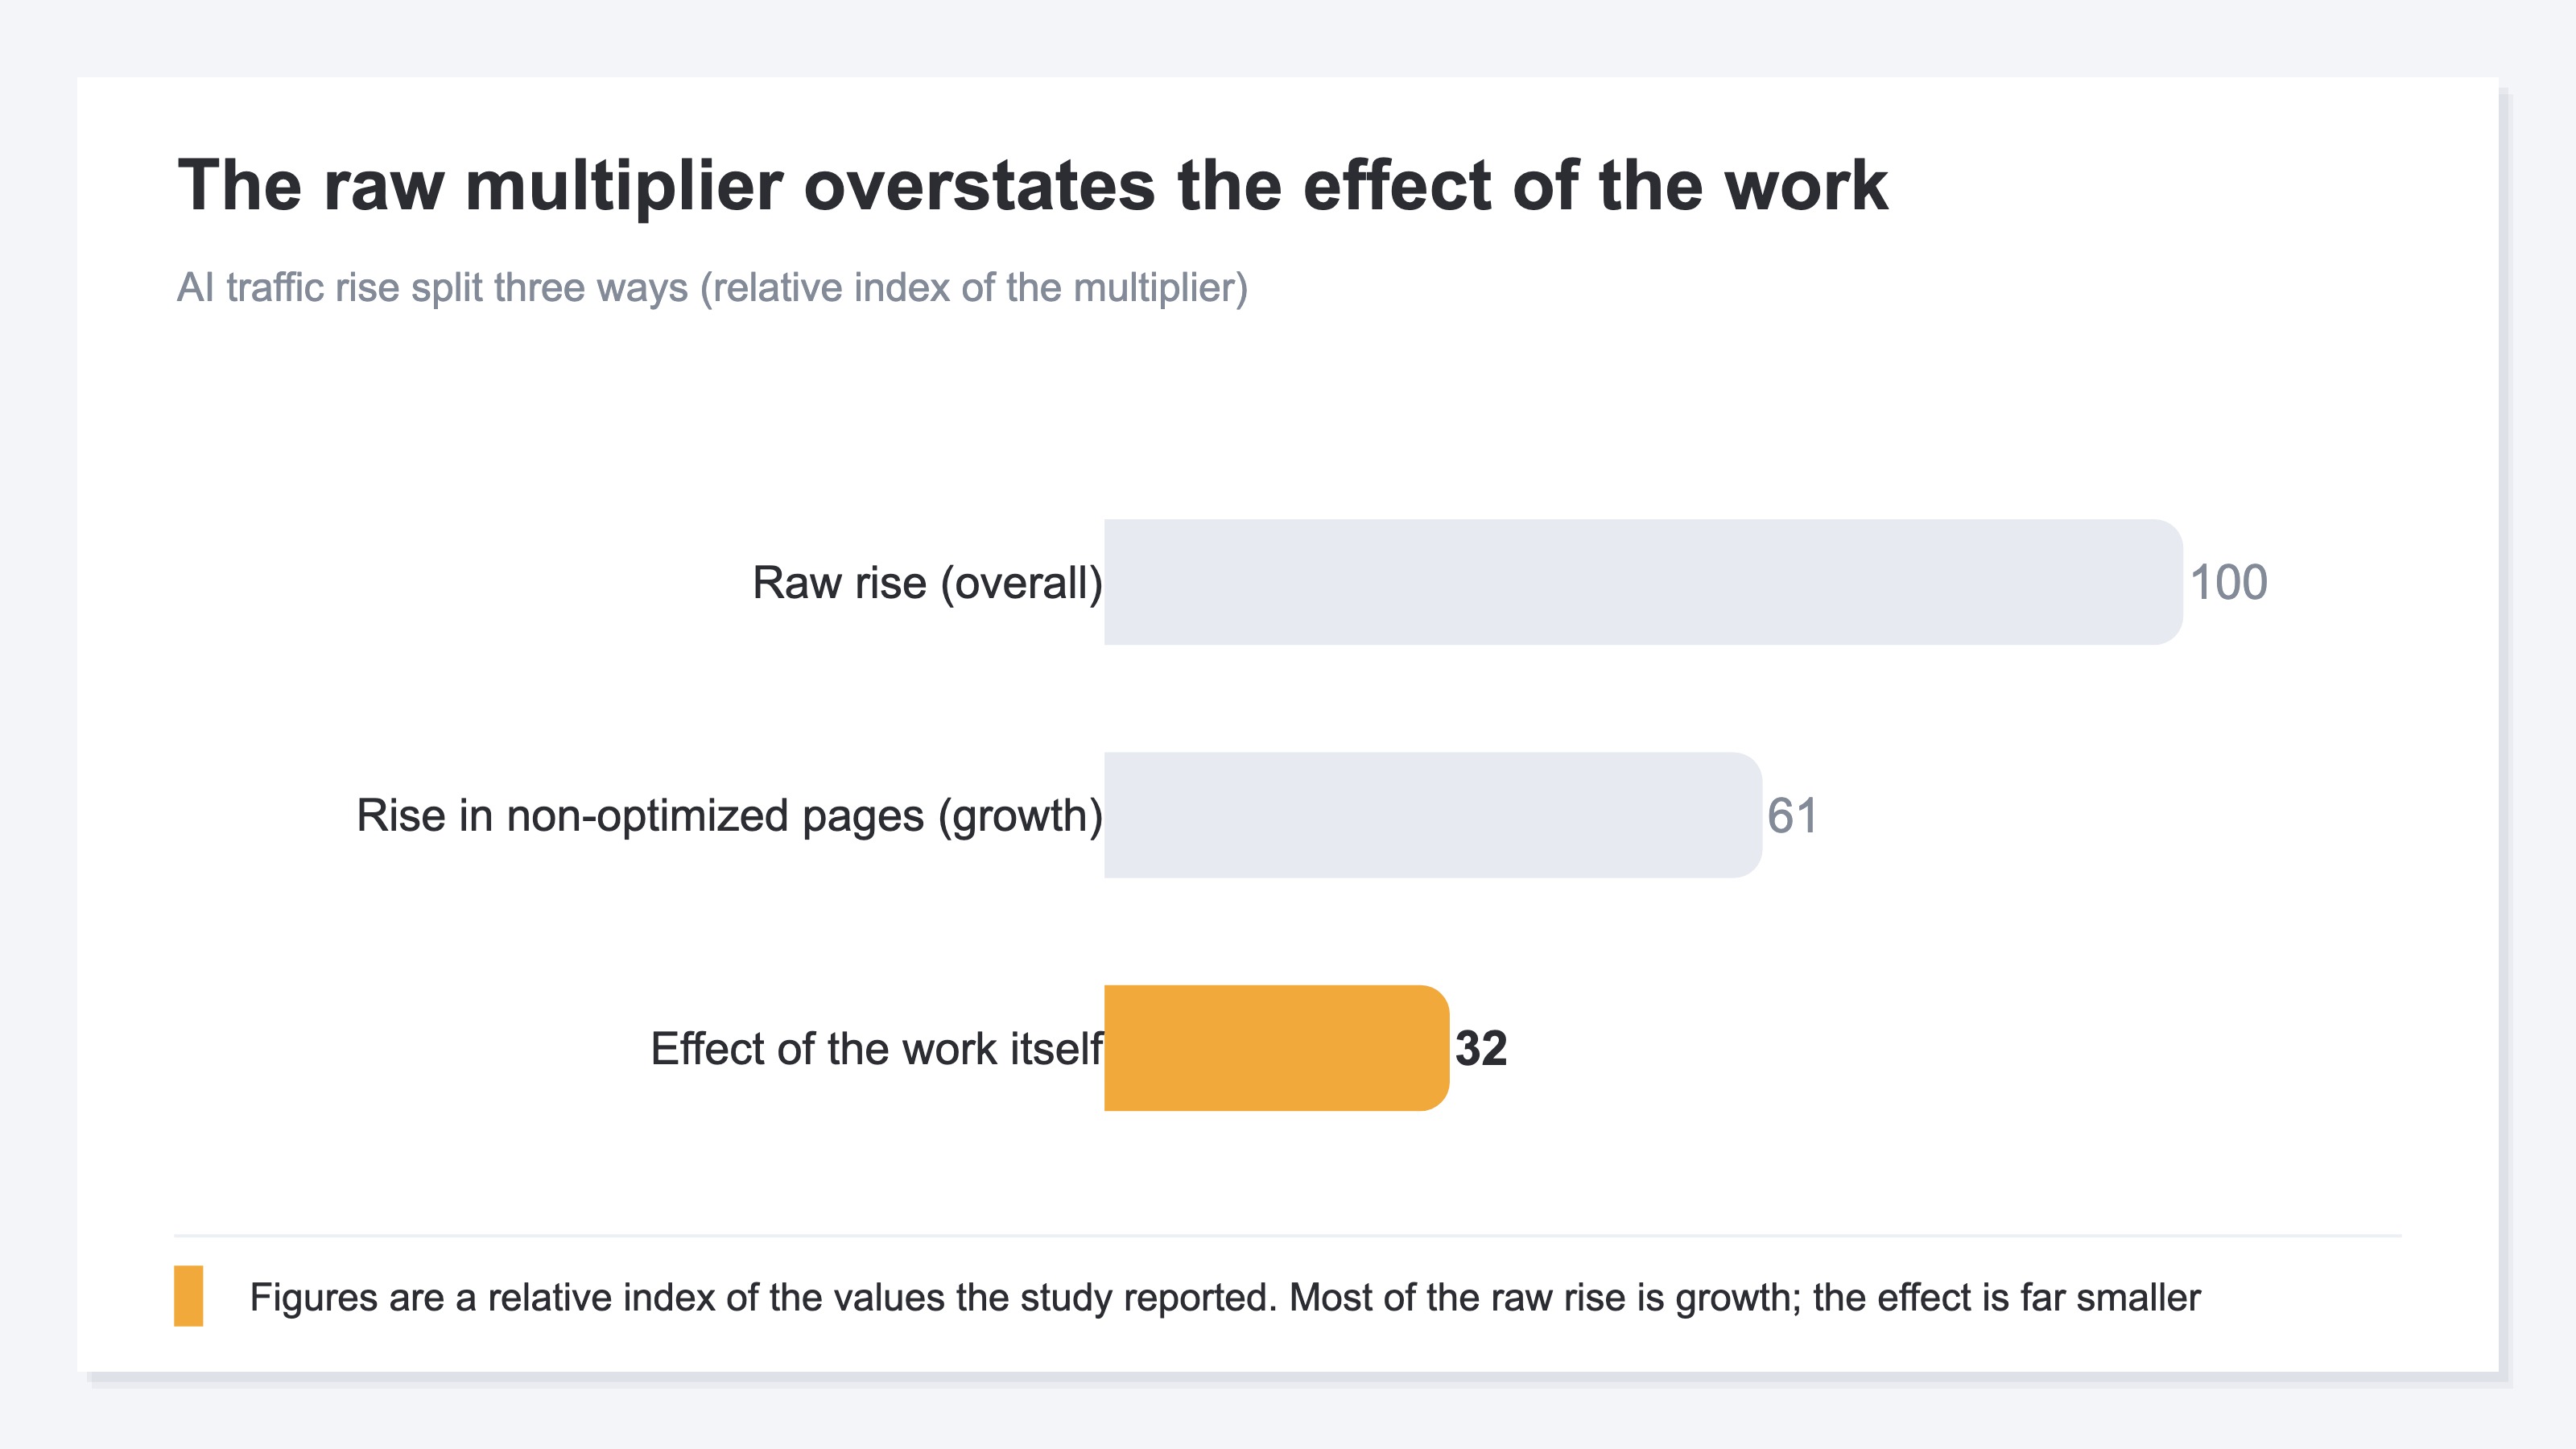
The key here is not to read this as "so the work is useless." 1.82x is a real effect the work genuinely added on top. The problem is that trusting the raw multiplier makes you mistake even ineffective work for "it worked," and misjudge where to invest. That's exactly why you need to read growth and effect separately. The study also ran an extra check on how solid the effect is, and writes cautiously that the result is "suggestive" rather than conclusive — can't be stated as fact, but the direction looks like it worked.
3. Two views that reveal the real gain#
Bottom line: you tell the real gain your work produced two ways — the difference against pages you didn't optimize, and whether the extra traffic actually buys (revenue per session).
The first view is to set a control. Put the rise of the optimized pages next to the rise of the non-optimized pages, and read the difference. If both rose by about the same, that's growth, not effect. If only the optimized pages rose extra, that difference is the real effect. The idea isn't hard: over the same period and conditions, put the work into one side only, and compare.
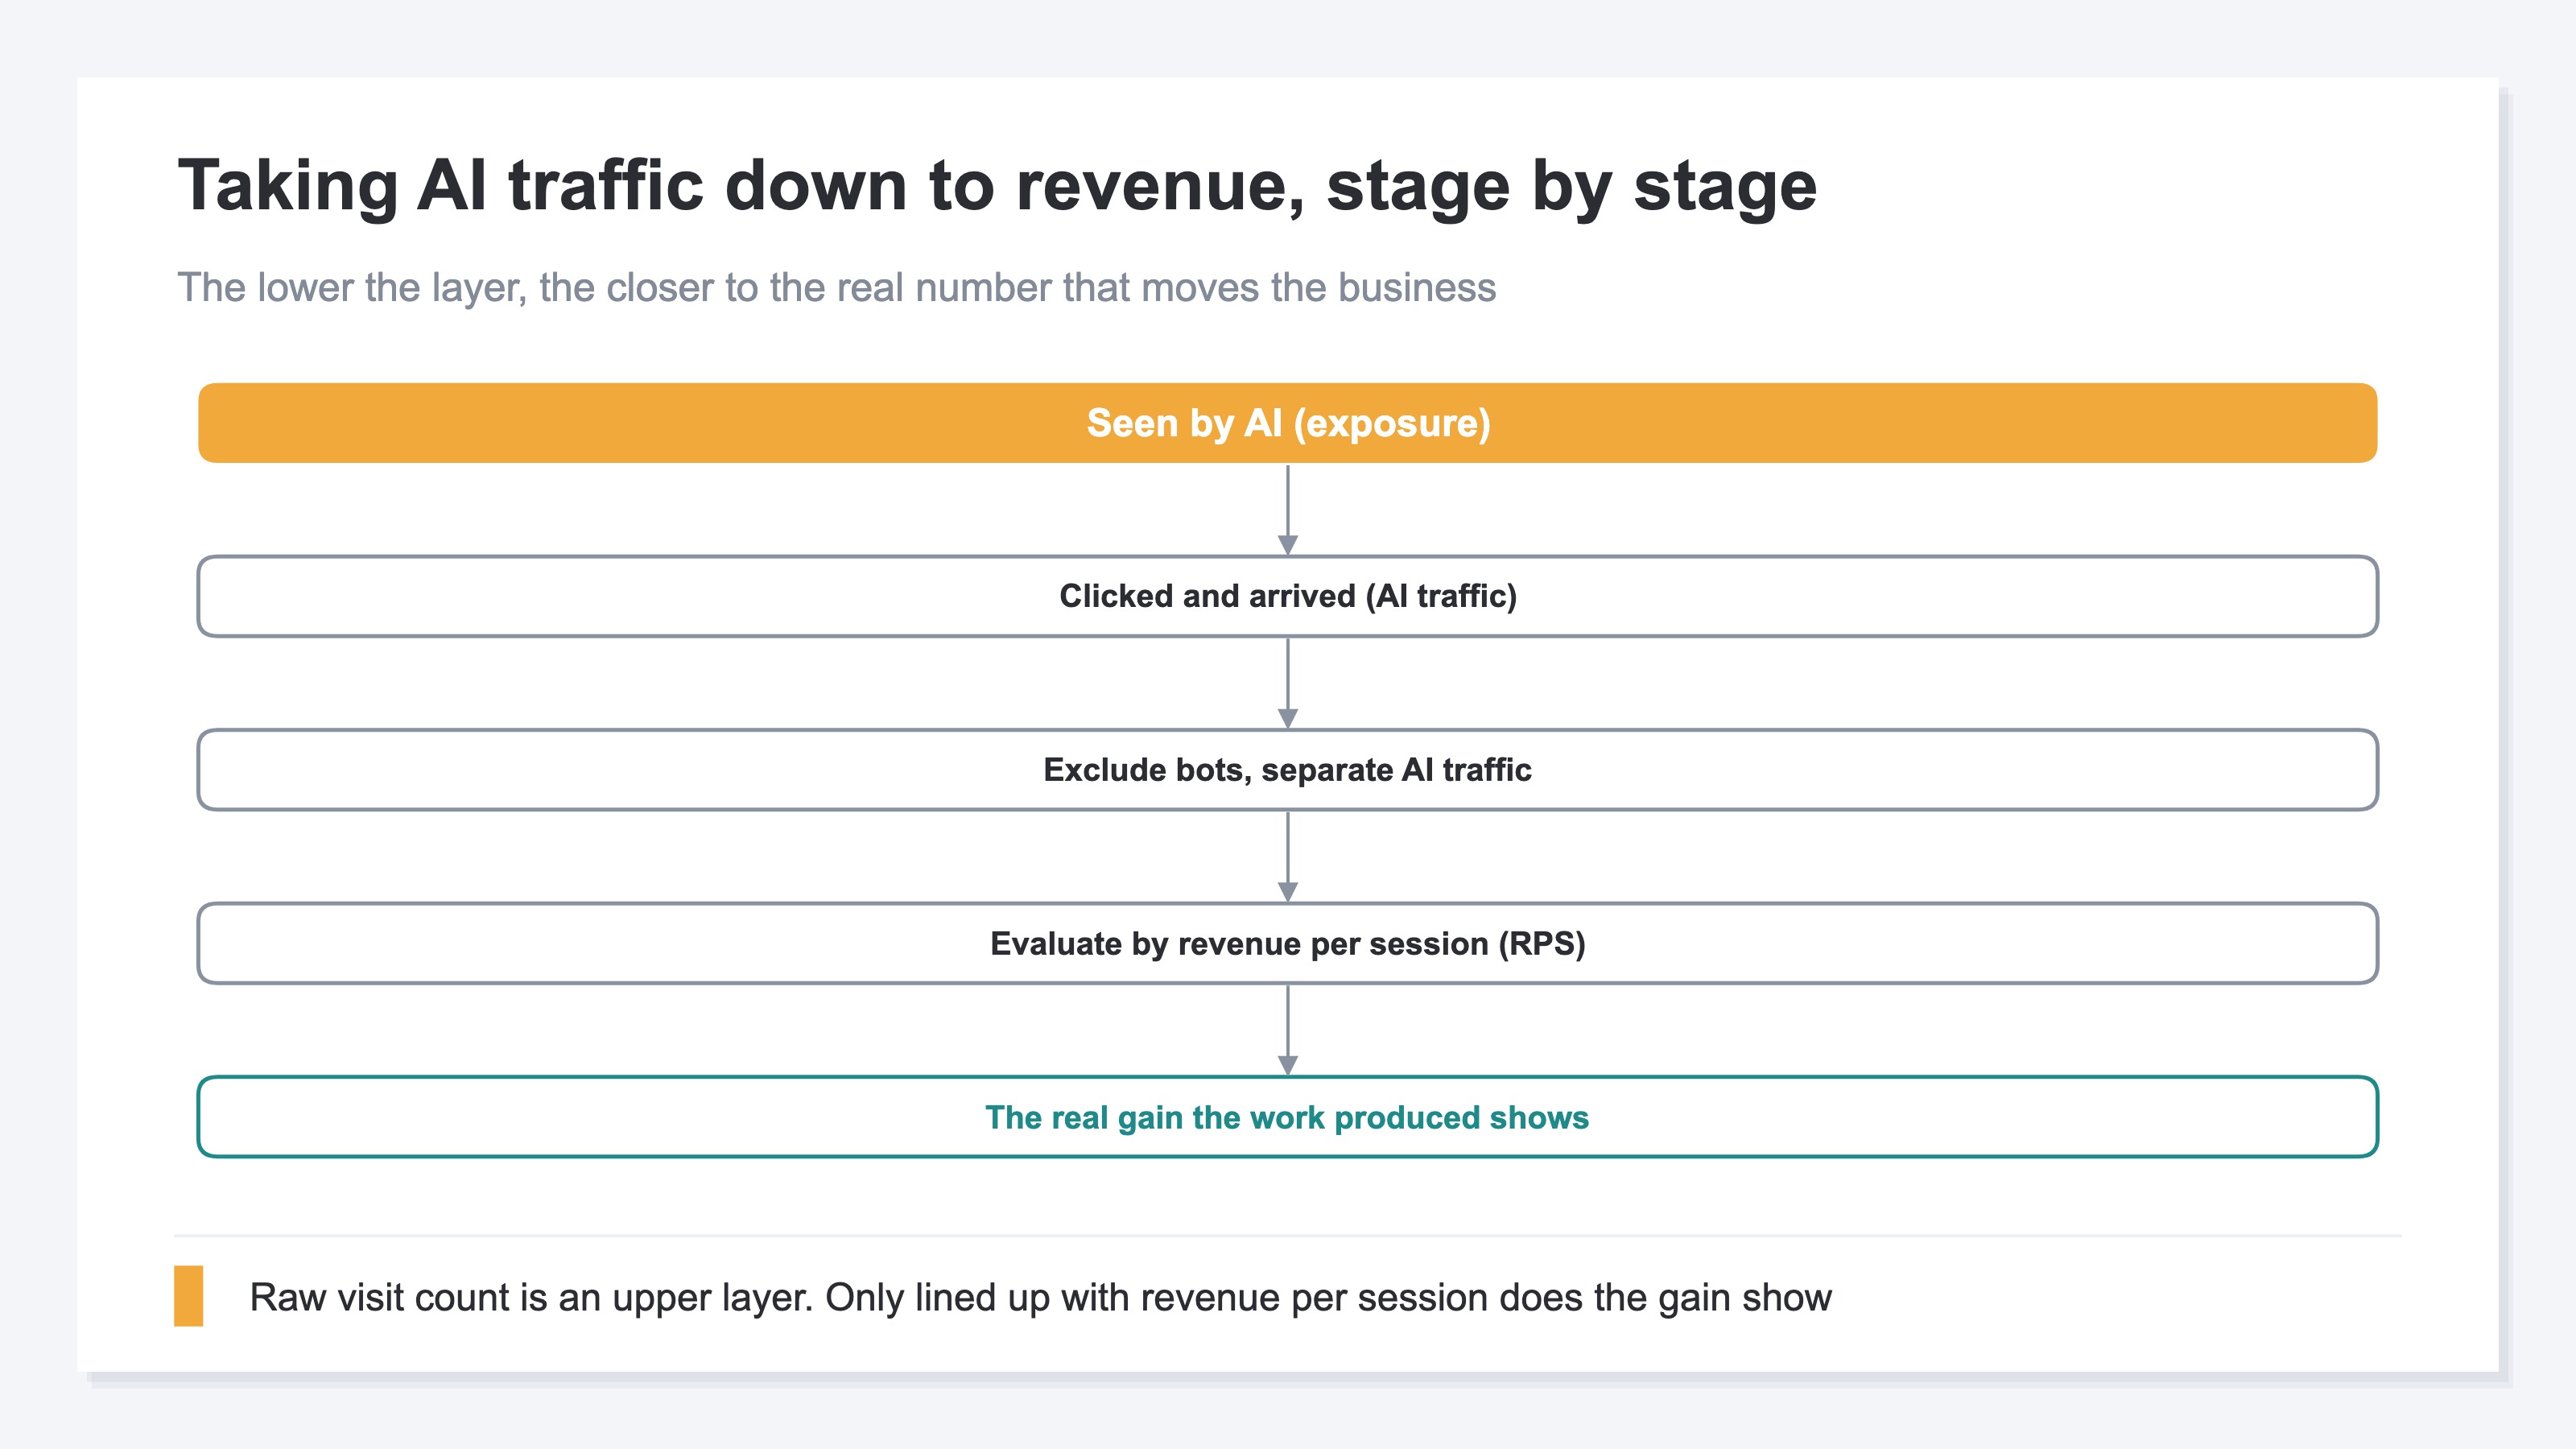
The second view is to read whether the extra traffic turns into revenue. Traffic can rise, but if those visitors don't buy, the gain to the business is near zero. So look at how much AI-driven visitors buy per visit (RPS, Revenue Per Session — revenue per single visit). Only by reading not just visit count but revenue do you see whether the work grew "traffic that buys" or just "traffic that arrives and doesn't buy."
The chart below shows the stages of taking AI traffic down to revenue. As you descend "seen by AI" → "clicked and arrived" → "revenue per session," you get closer to the real number that moves the business. Raw visit count is an upper layer; by itself it doesn't reveal the revenue gain.
Both ideas are simple. But lining up optimized vs. non-optimized — month by month, by channel, by page — and then lining that up with revenue, is genuinely heavy by hand. And the GA4 numbers that feed it get skewed if left alone. The next section looks at that skew and at a way to take it all off your plate.
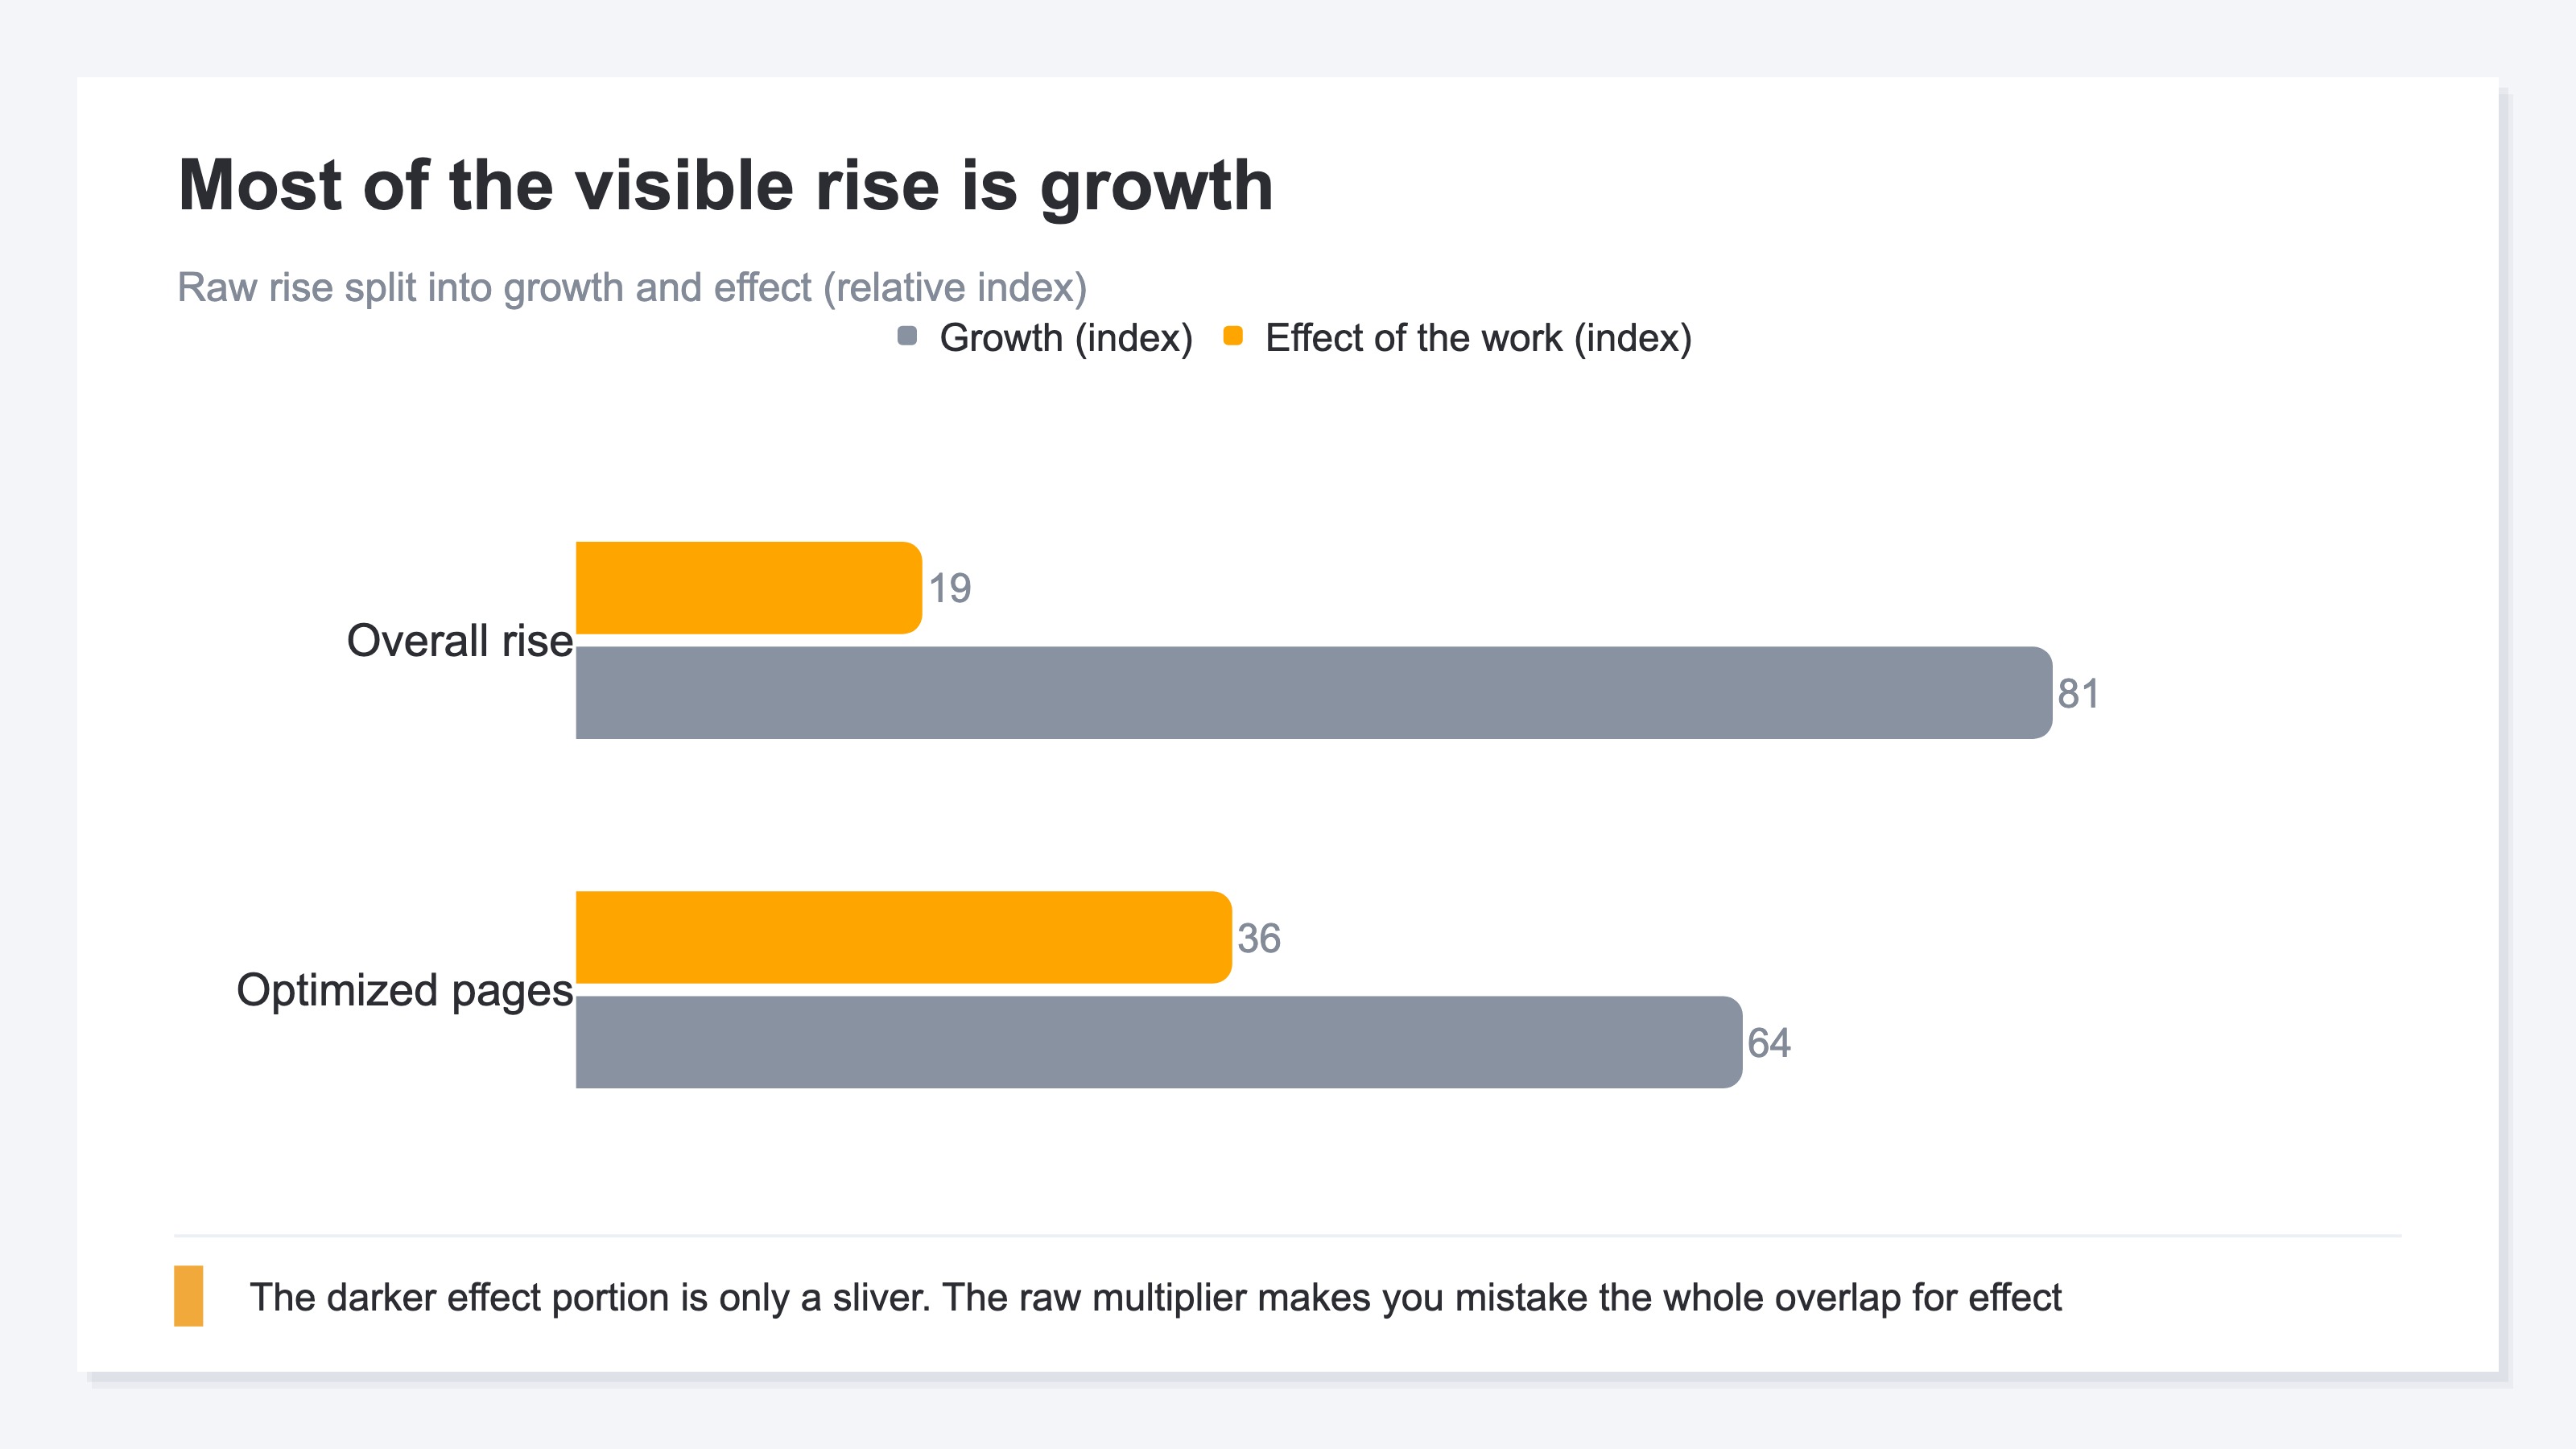
The chart below illustrates the overlap when you split the raw rise into "growth" and "effect." Of the big visible rise, the darker effect portion is only a sliver; the rest, the lighter portion, is growth. Look only at the raw multiplier and you mistake the whole overlap for effect.
RevenueScope helps
By now the idea for telling the real gain is clear: read the difference against a control, and line it up with revenue. But trying to do this in practice, you hit two walls.
One: the raw numbers themselves are skewed. AI traffic includes non-human access (bots). And traffic from ChatGPT or Gemini, without setup, gets lost in "source unknown (Direct)" and can't be separated as AI-driven. If the GA4 numbers feeding you are skewed, both the control difference and the revenue per session come out off. Two: the control comparison and the link to revenue, repeated by page, by channel, by month, are heavy each time by hand. You can try once yourself, but keeping it up is structurally laborious.
RevenueScope takes over both walls. It separates click traffic from AI — bots excluded — by citing engine (ChatGPT, Claude, Perplexity, Gemini, and others) and by page, and lets you compare each one's traffic, revenue per session (RPS), and revenue in one view (figures shown are demo data). You can check not just "how much arrived" but "did the arrivals buy," lined up on the same screen.
| Source | AI traffic | Revenue per session (RPS) | Revenue |
|---|---|---|---|
| Optimized pages (via ChatGPT) | 180 | ¥1,420 | ¥255,600 |
| Non-optimized pages (via ChatGPT) | 168 | ¥430 | ¥72,240 |
| Total (bots excluded) | 348 | ¥940 | ¥327,840 |
The point of this table is that on traffic count, optimized and non-optimized are nearly level (180 vs. 168), yet on revenue per session there's a wide gap. Look at traffic count alone and you might conclude "optimized and non-optimized rose about the same — mostly growth, the work didn't help." But read revenue per session, and the optimized pages buy more than 3x better. The work grew not traffic count but "traffic that buys." Excluding bots, lining up optimized vs. non-optimized, and lining it up with revenue this way, the real gain the raw multiplier hid shows up in numbers.
To be clear: RevenueScope counts only the click traffic that actually arrived and its revenue. It does not measure exposure where your name merely appeared (no click), nor does it academically prove the causal effect of the work. It does not calculate gross margin or inventory either. What RevenueScope takes over is preparing the material — splitting AI traffic by engine and page, bots excluded, and lining it up by revenue per session. Which work to keep is up to you.
FAQ#
Frequently asked questions#
Q. AI traffic grew 5x — and you still can't say it worked?
A. That raw 5x has a large dose of growth mixed in, from AI spreading. The research reports that even non-optimized pages rose by about the same, so the effect of the work itself is far smaller than the raw multiplier. "It grew" is a fact, but to isolate "the part the work produced" you need to read the difference against pages you didn't optimize.
Q. What if I can't set up a control (non-optimized pages)?
A. When a strict control isn't possible, the other view kicks in: read whether the extra traffic actually buys (revenue per session). If traffic rises but revenue per session doesn't, the business gain is thin. Read both traffic count and revenue, by source, and you get close to the real gain.
Q. If GA4 shows "AI traffic is up," can I trust it?
A. Trusting it as-is is risky. AI traffic includes bots, and without setup it can get lost in "source unknown (Direct)." If the raw numbers are skewed, both the gain and the revenue come out off. Only by excluding bots, separating AI traffic, and lining it up with revenue does the real gain show up.
Conclusion#
More AI traffic alone doesn't prove "the optimization worked." Recent research argues most of the rise is explained by growth as AI spread, with the effect of the work itself far smaller. The raw multiplier — how many times bigger than before — mixes growth and effect, so it makes the cause of your work look bigger than it is.
To tell the real gain, there are two views: the difference against pages you didn't optimize, and whether the extra traffic actually buys (revenue per session). Both ideas are simple, but repeating them by hand — month by month, by page, by channel — is heavy, and the GA4 numbers that feed it get skewed by bots and by loss to "source unknown."
That's exactly why it helps to be in a state where you can separate AI traffic with bots excluded, line up optimized vs. non-optimized, and read it down to revenue per session. Don't get swept up by the raw multiplier; tell the real gain in numbers, and you can judge — not by gut — which work to keep.
See which ads actually drive revenue, at a glance
Free up to 5,000 sessions/month, AI analyst included. No credit card required. Up and running in 5 minutes.


![[Research] Why AI Recommends Big Brands: A Single Rating Can Flip It](/_next/image?url=%2Fimages%2Fnews%2Fai-recommends-big-brands.jpg&w=3840&q=75)
![[Research] How Visible Is Your Brand in AI Search? You Can Measure It](/_next/image?url=%2Fimages%2Fnews%2Fai-search-brand-visibility.jpg&w=3840&q=75)