Impressions on your search ads fell, and you changed neither budget nor bids. The pull is to go back over the settings in your own account first, but reversing the order gets you there faster. This article covers how to sort the cause into categories in the order market, competitors, then yourself, and how to decide with revenue whether the drop is worth buying back.
Contents
TL;DR#
-
Check in the order market, competitors, then yourself
Starting from your own settings turns into the long way round in the case where search demand itself is what shrank
-
Impression share and the two lost impression share rates in Google Ads sort the cause into categories
Lost IS (budget), though, can only be viewed at the campaign level
-
Knowing the cause and settling whether to win it back are two different things
Whether the impressions you lost carried revenue is judged by matching them against revenue measured outside the ad platform
1. The Order Is Market, Competitors, Then Your Own Account#
A fall in impressions comes from one of three places: the market side, the competition, or your own side. Fewer people searching at all; more competitors going after the same slots, or the same ones raising their bids; your own budget or ad rank falling short.
On your own side, settings can have changed even when nothing comes to mind. If auto-apply for recommendations is turned on, changes can land without your approval. Google Ads optimization score covers how to run that check.
Even so, start with the market side, where the work is lightest. Checking your own side takes time, while the market side takes a few minutes if you look at organic search impressions. Paid and organic are separate surfaces, but if search demand for the same keywords has shrunk, both move the same way. If impressions in Google Search Console are down over the same period, the market side becomes the stronger candidate. Organic impressions also move with your own ranking positions, though, so this is corroboration rather than proof.
On top of that, the common sense many advertisers carry has a date stamped on it. In February 2021 Google Ads began folding broad match modifier behavior into phrase match, and by July 2021 all languages had moved to the new phrase match behavior. A search that carries the meaning of the keyword you specified is eligible to show your ad[3]. Fencing off exactly what you show on through match type settings belongs to the period before that date. Since then, trying to explain a rise or fall in impressions with keyword settings alone stops adding up more and more often.
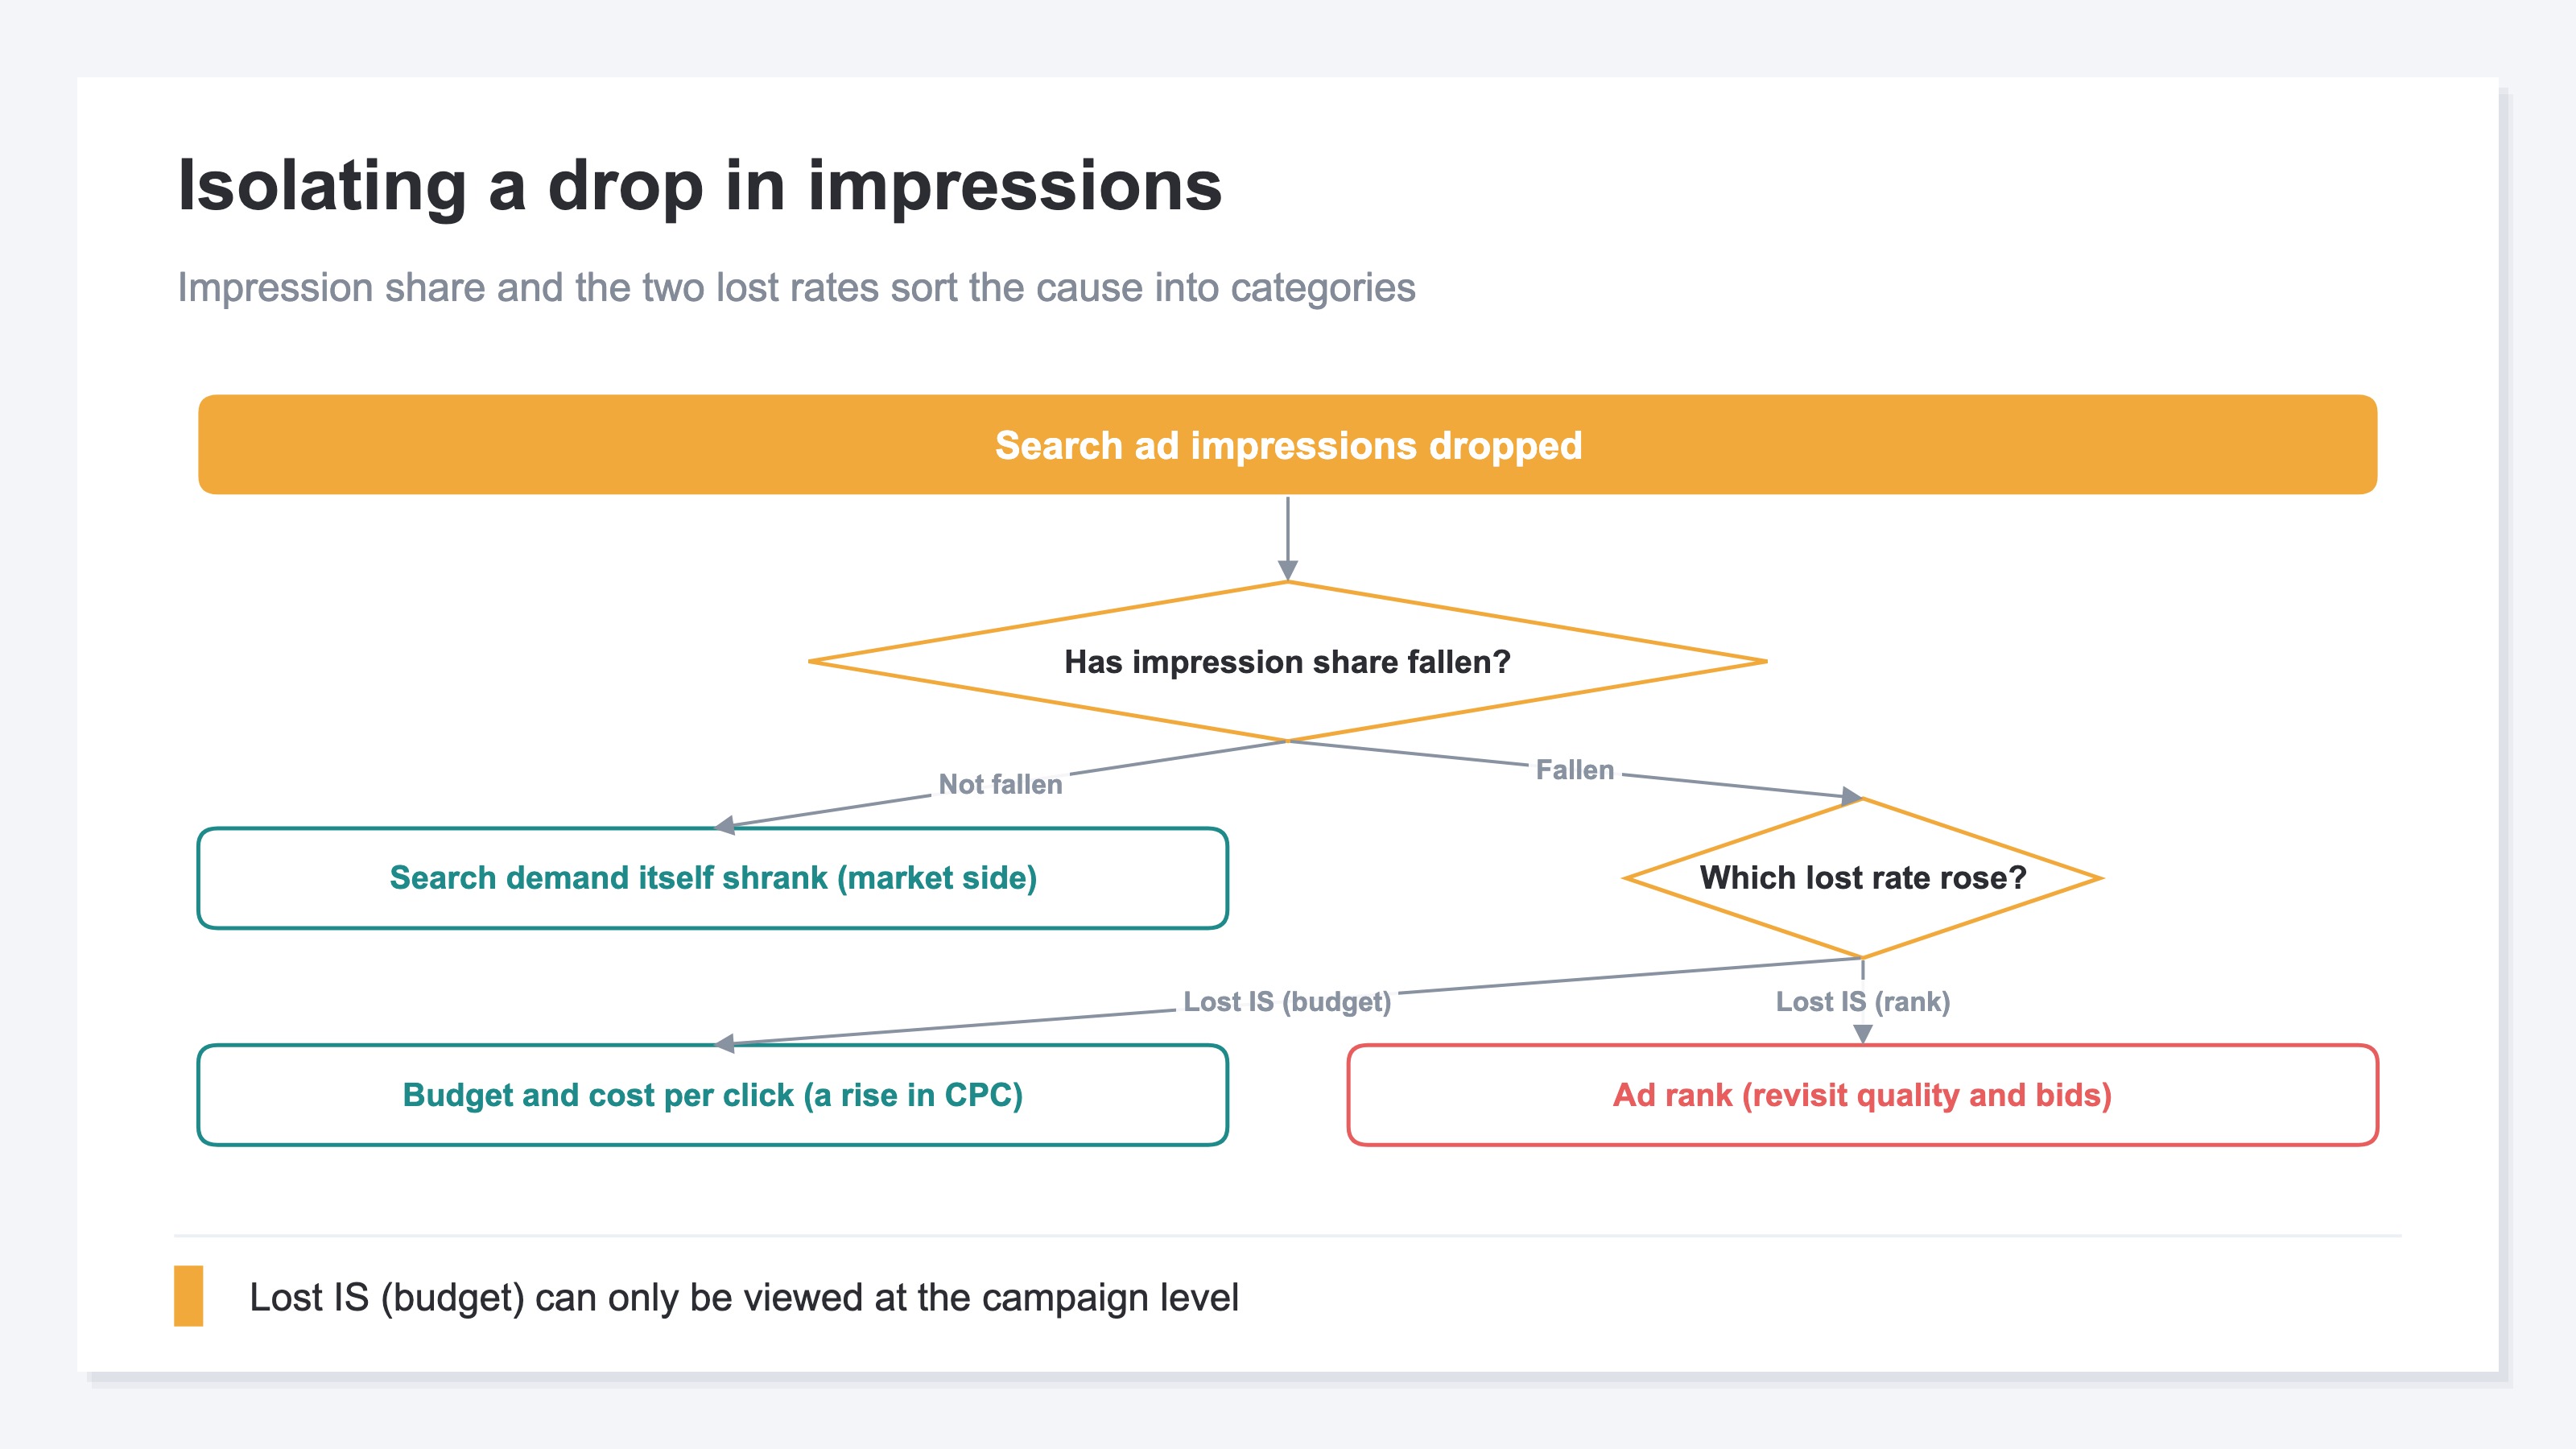
So move the axis you isolate on from keyword settings to the share of the auction you are actually taking.
2. Three Impression Share Metrics That Sort the Cause#
Impression share is the impressions you received divided by the estimated number of impressions you were eligible to receive[1]. It shows how much of the available share you are taking.
Two lost impression share rates sit alongside it. Lost IS (budget) is the share of impressions that went unshown because the budget was too low, and lost IS (rank) is the share that went unshown because ad rank was too low[2]. Read the three together and the cause sorts into categories.
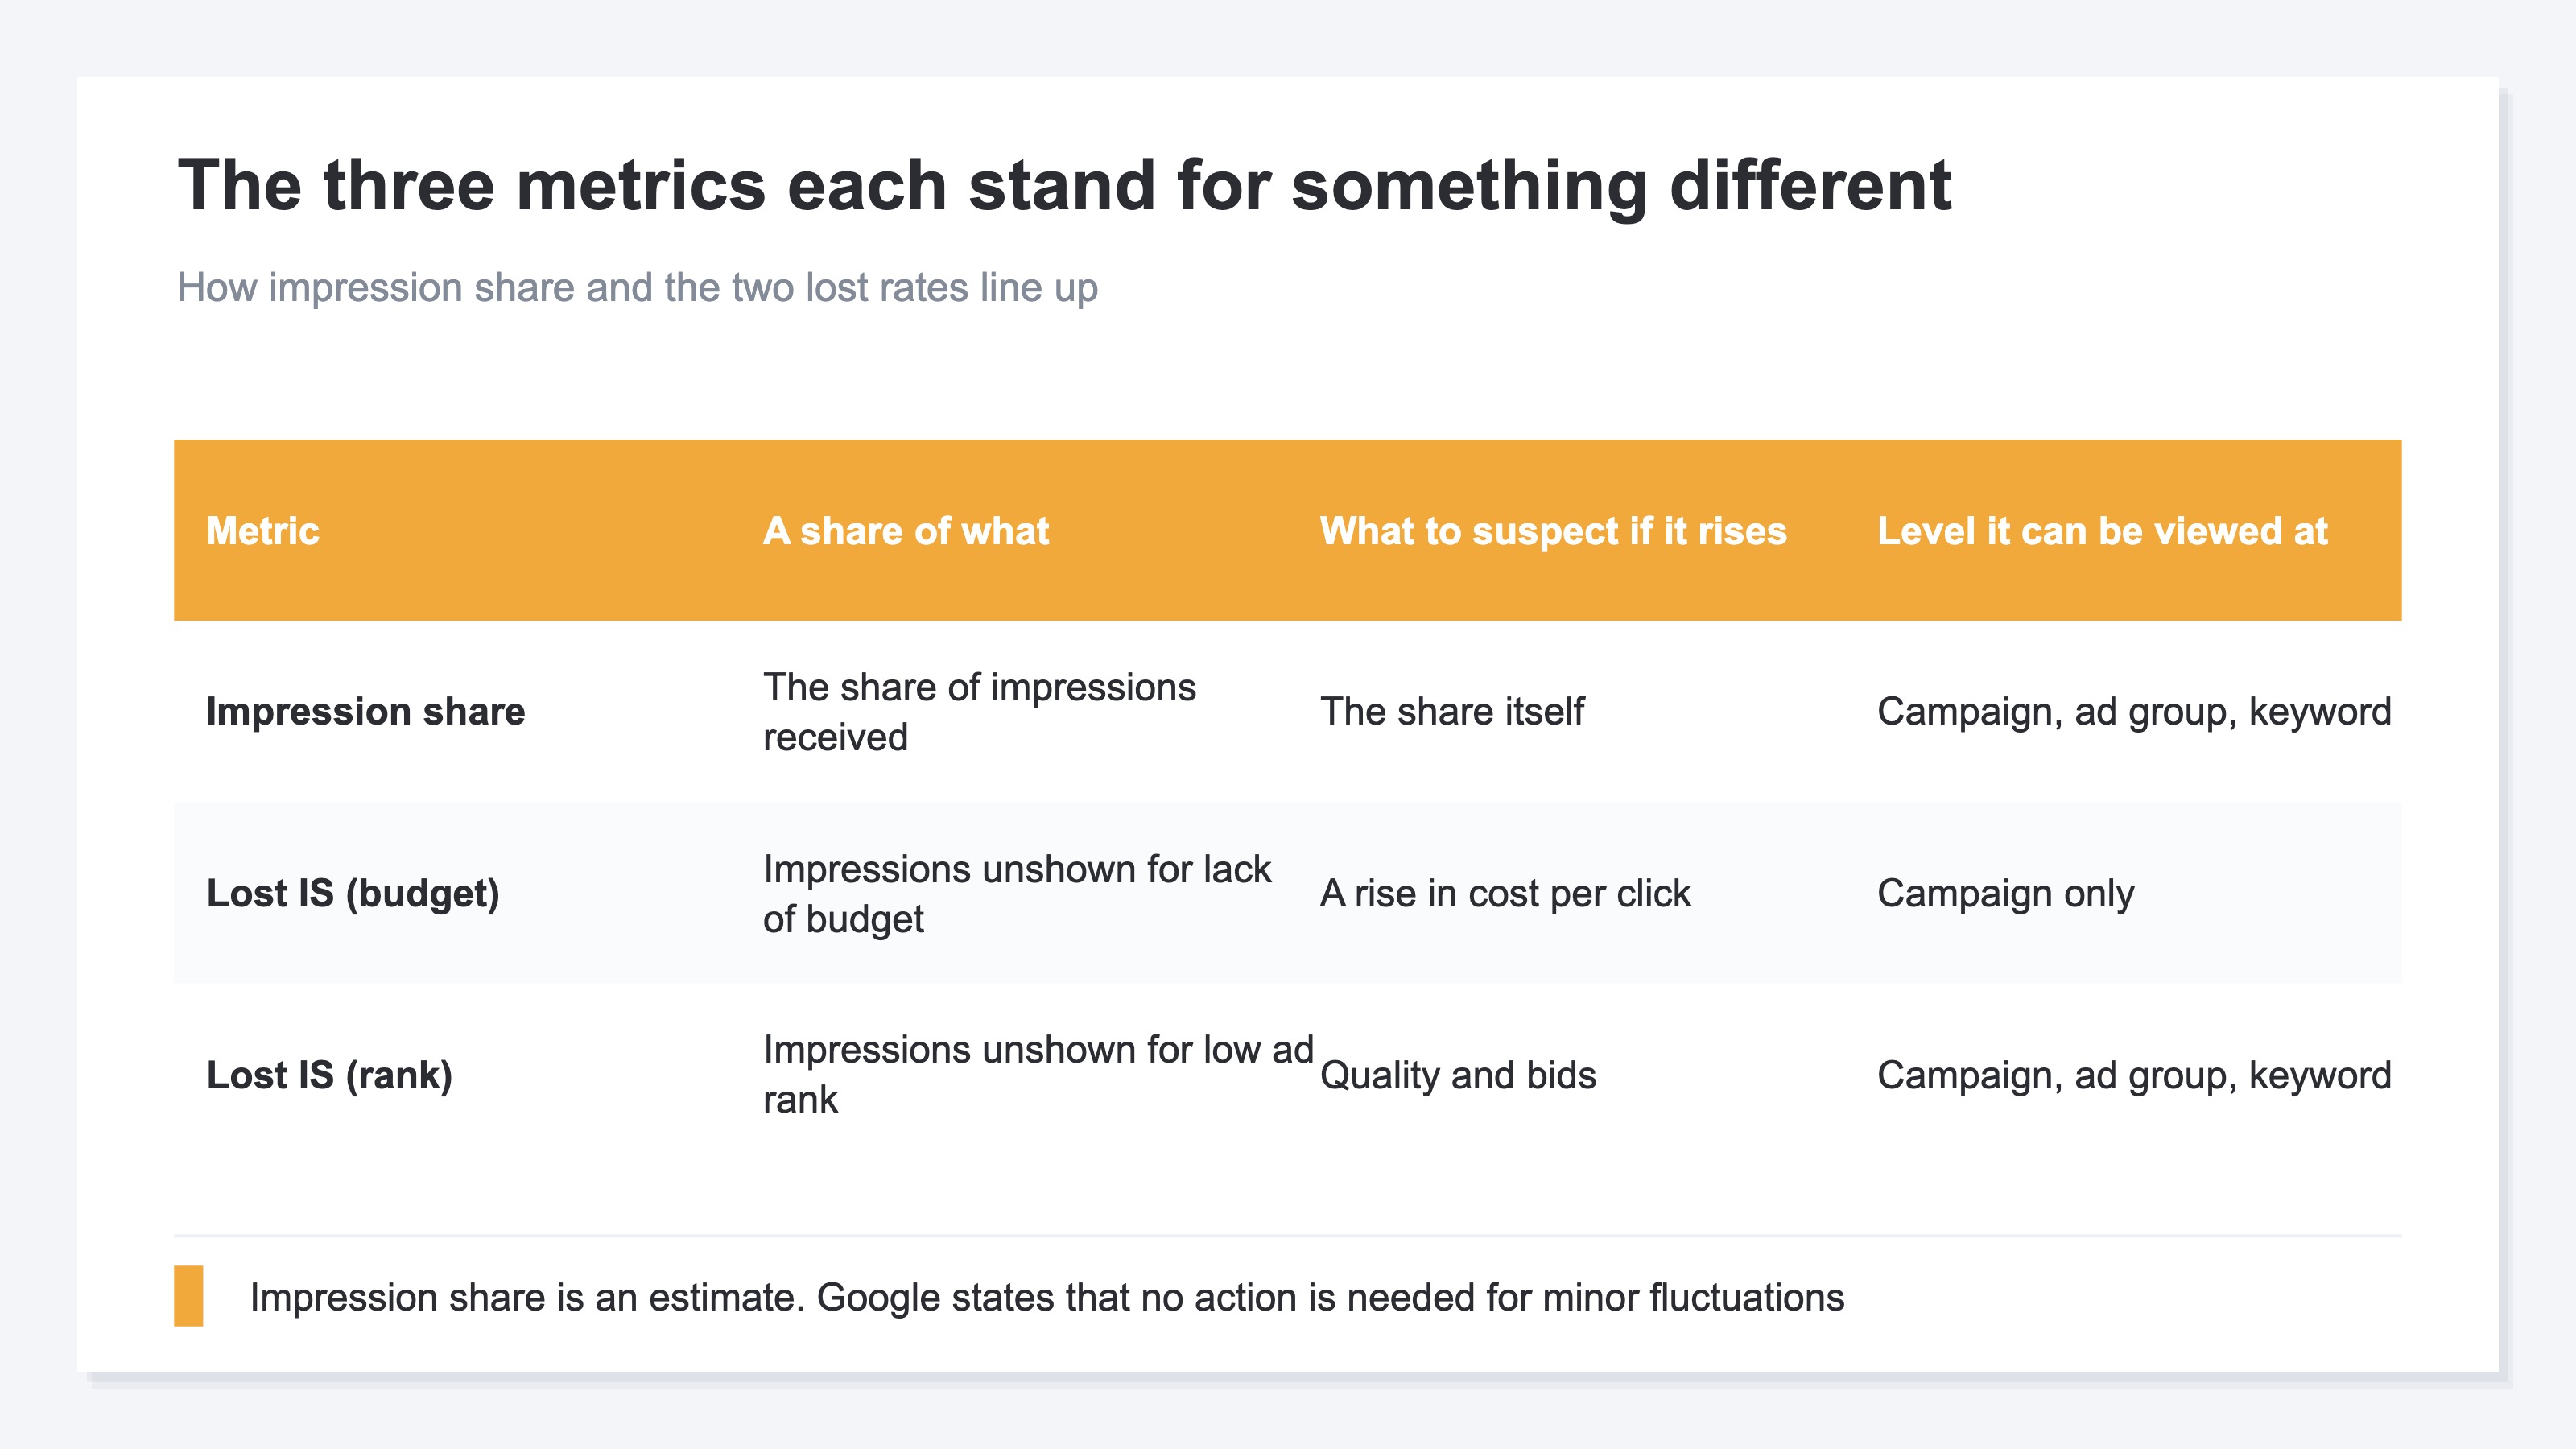
What matters most in the reading is the case where lost IS (budget) has risen while the budget has not moved by a single yen. The same budget now buys fewer impressions, which is a sign that cost per click has gone up. The typical trigger is a competitor lifting their bids. For how a rise in cost per click spreads through the rest of the results, see isolating why ROAS dropped.
There are two limits on using this. The first is that lost IS (budget) can only be viewed at the campaign level, not per keyword[2]. The second is that impression share is an estimate. Google states that no action is needed for minor fluctuations[1]. Touching delivery over a few percentage points of noise disrupts learning instead of helping. Note that what is covered here is Search campaigns. Google's Performance Max reaches a different set of surfaces, so the range a report can show you changes with it. When Performance Max clicks surge covers that difference.
That gets the why of the drop sorted into categories. What remains is the price tag that was attached to the drop.
3. Knowing the Cause Doesn't Settle Whether to Buy It Back#
Impressions are a midway metric. Impressions fall, clicks fall with them, and if those clicks came from people who were never going to buy, revenue does not move.
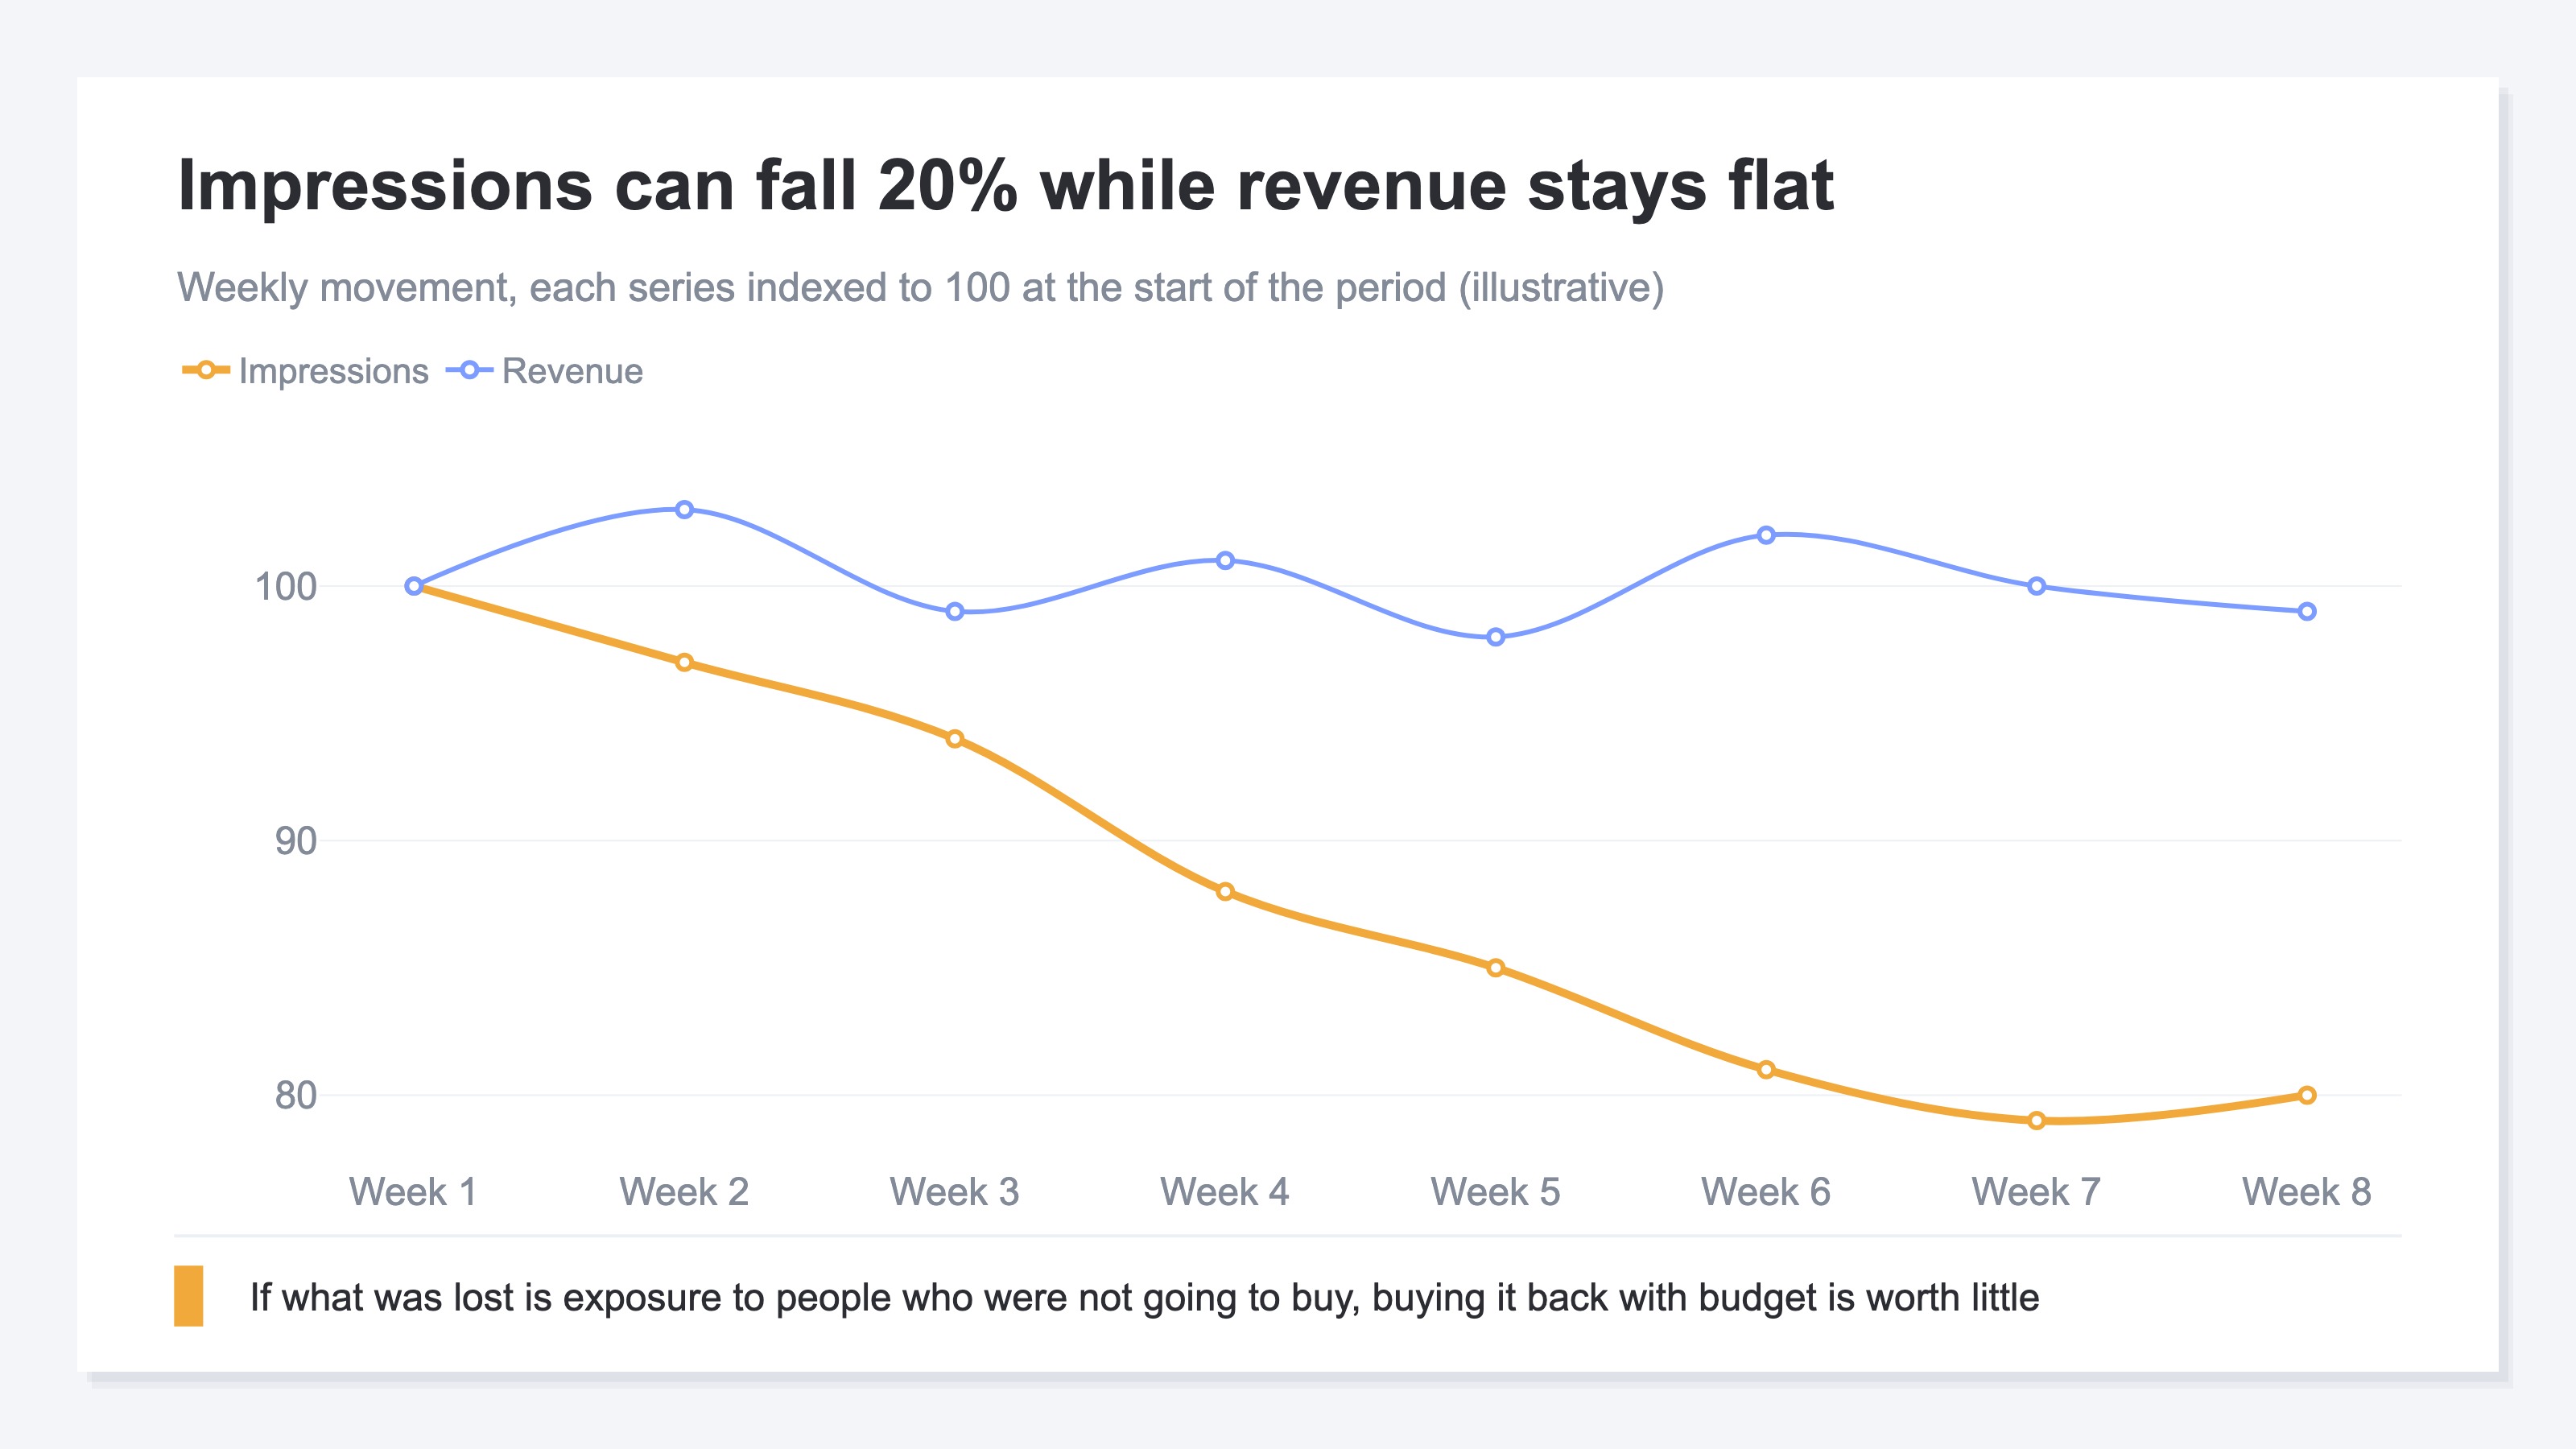
If impressions fall 20% and revenue stays flat, what was lost is exposure to people who were not going to buy. Piling on budget to win that back is worth little. If revenue has fallen by the same amount, those impressions were the ones carrying revenue, so buying them back can be the right call even at a higher cost per click. Which channels to cut the ad budget from covers how to decide which channels to keep.
And that decision needs material the Google Ads interface alone does not hold. The interface tells you where in the auction you lost. What price tag was on that loss only comes out if revenue is measured outside the ad platform. Conversion values reported by the platform are counted under the platform's own definition, a separate series from the revenue booked as orders. What enhanced conversions actually increased goes into that difference in definition itself.
RevenueScope solution
For channels where ad spend has been imported, RevenueScope shows platform-reported impressions and clicks in the same table as the sessions, revenue and RPS measured on your own site.
Impressions and clicks fill in only on the rows for channels with a record of ad spend in that period. Organic search and Direct rows stay blank. Platform-reported figures and first-party measurement are counted in separate series, so the click count and the session count do not match. That mismatch is the correct state, not something to be reconciled. Reading the state of delivery is the job of the Google Ads interface, and RevenueScope does not step into it. What sits here is the step of matching the volume the platform reported against the amount measured on your own site.
The breakdown for channels with imported ad spend, asked in RevenueScope (illustrative)
| Channel | Impressions | Clicks | Sessions | Revenue | RPS |
|---|---|---|---|---|---|
| Google Ads | 41,200 | 1,240 | 1,080 | ¥324,000 | ¥300 |
| Meta | 38,500 | 950 | 820 | ¥123,000 | ¥150 |
| Google search | — | — | 2,600 | ¥546,000 | ¥210 |
| Direct | — | — | 640 | ¥160,000 | ¥250 |
Note: impressions and clicks are the ad platform's reported figures, while sessions and revenue are measured by RevenueScope on your own site. They do not match because the definitions differ. The table above was built to explain the point, and the demo screen is displayed with the sample store's sample data, refreshed daily.
Save this table every month and set the copies side by side, and the row that is highest on RPS changes from month to month. Google Ads leads at ¥300 this month, and in the month after cost per click rises, Google search can come out on top. Move budget off a single snapshot from the month impressions dropped and that changeover never enters the decision. That is the reason for keeping the same table shape every month.
FAQ#
Frequently asked questions#
Q. Should I act on a few percentage points of movement in impression share?
A. Google states that no action is needed for minor fluctuations[1]. As long as it is an estimate, small swings are unavoidable. Judge on whether it keeps falling period after period.
Q. Can I view lost IS (budget) per keyword?
A. No. Lost IS (budget) is a metric that can only be viewed at the campaign level[2]. The one available per keyword is lost IS (rank).
Q. If impressions fall, should I raise bids first?
A. That is an option if lost IS (rank) has risen. But if what has risen is lost IS (budget), the thing to raise is the budget, not the bid. Touch cost per click before the cause is identified and you lose track of which move did the work.
Summary#
When search ad impressions fall, beginning your checks with the settings in your own account is the long way round. Look in the order market, competitors, then yourself, and confirm on the organic side first whether search demand itself has shrunk.
From there, matching impression share against the two lost impression share rates sorts the cause into categories. If lost IS (budget) has risen while the budget has not changed, that is a sign cost per click has gone up. Bear in mind that lost IS (budget) can only be viewed at the campaign level, and that impression share is itself an estimate.
Knowing the cause and settling whether to win it back are two different things. Whether the impressions you lost carried revenue can only be judged once the platform's reported figures and revenue measured on your own site sit in the same table.
See which ads actually drive revenue, at a glance
Free up to 5,000 sessions/month, AI connection included. No credit card required. Up and running in 5 minutes.