
We took the optimization score from 68% to 91%. Even so, revenue came in about the same as last month. What the score rates is how the account is set up, which is a different thing from revenue measured on your own site. Start by checking what the number measures, straight from the official definition.
Contents
TL;DR#
- The official definition calls optimization score "an estimate of how well your Google Ads account is set to perform"[1]. It rates how the account is set, not a tally of revenue results
- 100% means "that your account can perform at its full potential"[1]. But there are two routes there: applying every recommendation, or dismissing them, can each take you to 100%[1]
- The score is calculated in real time from many factors, ranging from your settings to trends in the ads ecosystem[1]. Turn auto-apply on and daily applications stack on top of that[2]
- In one example from fictional Store S, the campaign with the most clicks held 12% of revenue while a campaign with a third of the clicks led at 41%
- Score and revenue measure different things, so neither result decides the other. Fix one changeover date, then compare revenue from that day to today against the same number of days immediately before
1. What Does the Optimization Score Actually Score?#
What the optimization score rates is how the account is set.
Google Ads Help defines it as "an estimate of how well your Google Ads account is set to perform." Scores run from 0-100%, "with 100% meaning that your account can perform at its full potential"[1].
The word to hold onto is "estimate." It is not a tally of results. According to the same help page, the score is calculated in real time from the statistics, the settings, the status of your account and campaigns, the relevant impact of available recommendations, and recent recommendations history[1]. What each of those five covers in detail is not spelled out there.
That does not make the score unrelated to results. The official page states plainly that 100% means the account can perform at its full potential[1]. Nothing there denies the relationship that better settings tend to help performance. What we want to establish is something else: that the score going up and revenue on your own site going up are two things you can confirm independently.
There is a second point about how the number rises. The same help page says your account "can reach an optimization score of 100% by applying or dismissing all recommendations"[1]. Applying moves the score, and so does dismissing. Dismissing is the correct action when you judge that a recommendation doesn't fit your ads, so there is nothing negative about it. But the score alone doesn't tell you whether it rose because you applied or because you dismissed.
Put together: the score is an estimate of how well the account is set, and revenue is a result that happened on the site. They measure different things, so a higher score is not a statement that revenue grew. Reading both is the answer.
2. The Day You Turn On Auto-Apply, the Score Reads Differently#
Your account has a date on which the score changed meaning. It is the day you turned on automatic application of recommendations.
Google Ads Help says that when you turn on "Automatically apply recommendations," the recommendations will apply regularly[2]. With it on, you can review from the queue which recommendations will run on a given day, and what was applied shows up in the "History" tab and on the "Change History" page[2]. Auto-applying doesn't increase your budget, and the setting sits at the account level[2].
What changes at that date is the kind of thing mixed into the number. The optimization score help page says score and available recommendations "can change based on many factors, ranging from your settings to trends in the ads ecosystem," and that the score is calculated in real time[1]. So even before you turn auto-apply on, the number moves without you touching anything. After you turn it on, the daily applications pile on top of that. Either way, the bare fact that the score is higher than last month doesn't explain what did the work.
That is why fixing one changeover date settles the reading. It can be the day you applied recommendations in bulk, or the day you turned auto-apply on. From that day, compare revenue and sessions on your own site over equal-length periods on either side. Put the score's movement and revenue's movement on the same timeline. That is the entry point for translating the number into the language of revenue.
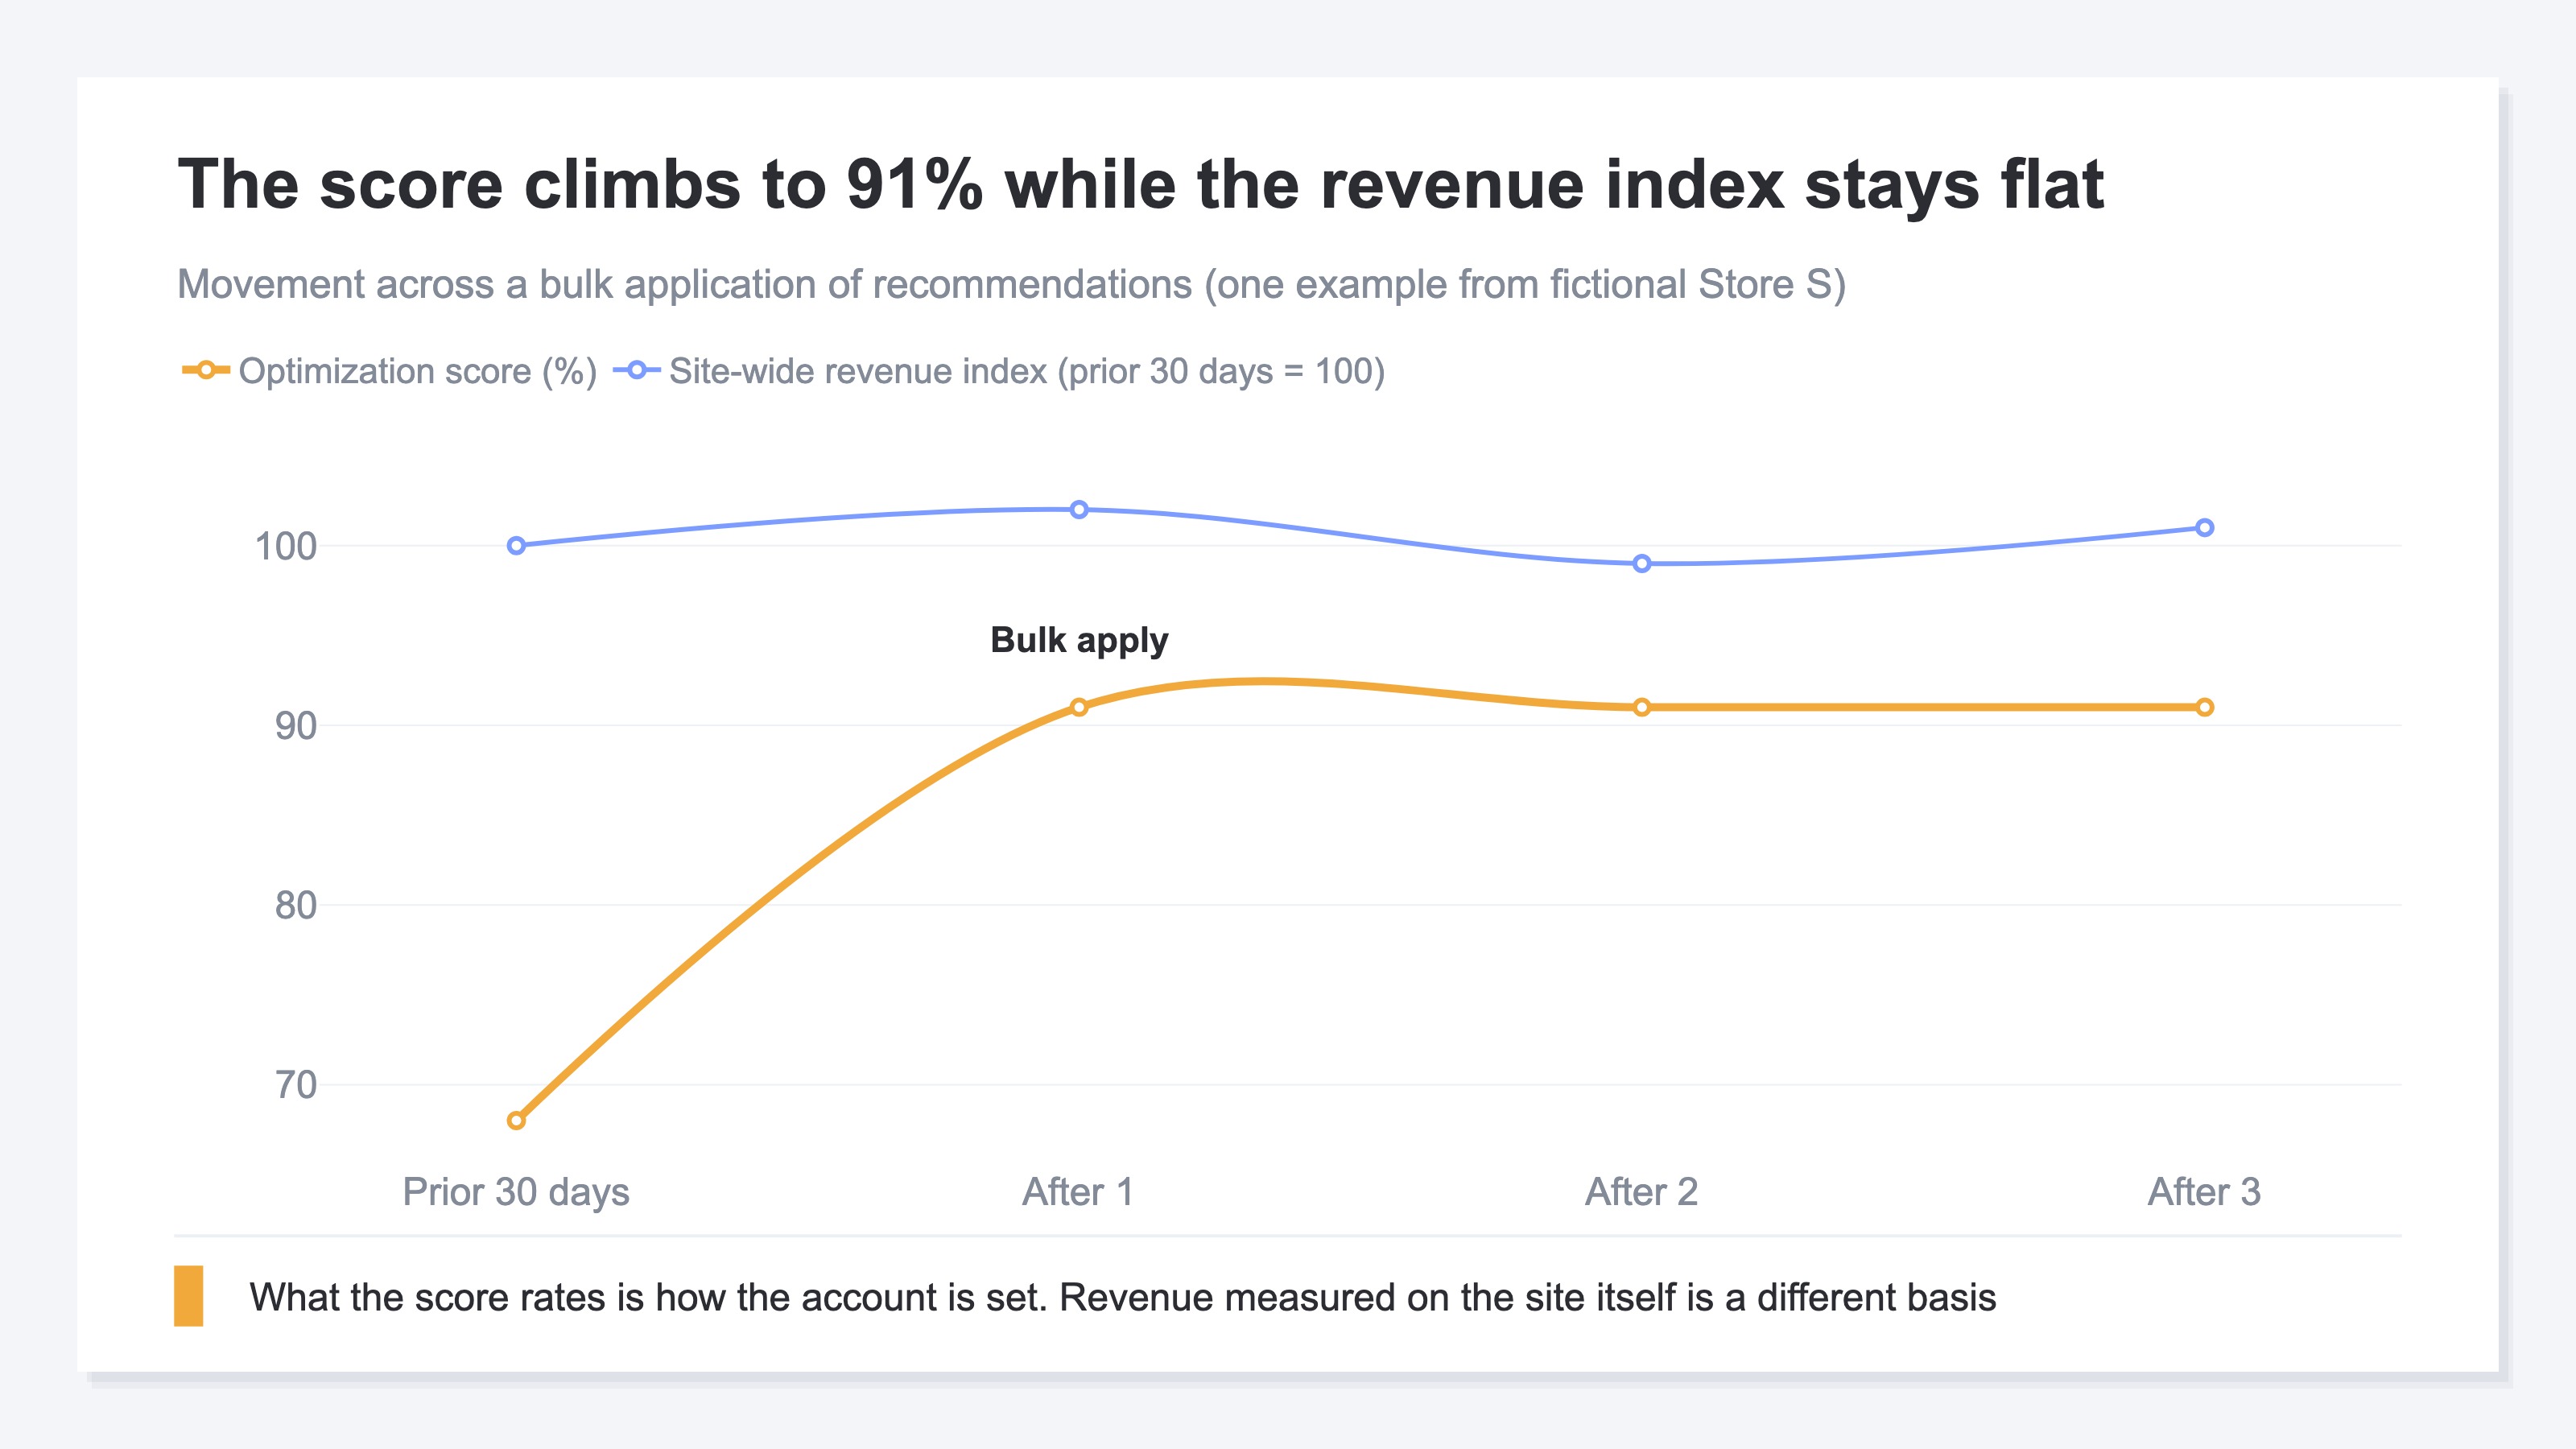
Here is what the example from fictional Store S looks like with the period placed on a timeline. The optimization score steps up from the day of the bulk application, going from 68% to 91%. Over the same period, the site-wide revenue index (the 30 days before the application set to 100) runs 100, 102, 99, 101. The score line climbs, the revenue line is flat.
When this shape shows up, you cannot say the ads failed. You cannot say they succeeded either. What you can say is two facts: the settings got better organized, and revenue didn't change. To move past that, you have to connect which recommendation was applied on which date to how revenue moved around that date.
3. The Campaign With the Most Clicks Isn't the Revenue Leader#
The campaign with the most volume and the campaign producing the most revenue don't always agree.
Here is the example from fictional Store S, comparing clicks and revenue share by campaign.
| Campaign | Clicks | Revenue share |
|---|---|---|
| Search, generic keywords | 4,000 | 12% |
| Shopping | 2,200 | 33% |
| Display | 1,500 | 14% |
| Search, product names | 1,300 | 41% |
The most clicks go to the search campaign on generic keywords, at 4,000 clicks. Its revenue share is 12%. The revenue share leader is the search campaign on product names at 41%. It has 1,300 clicks, about a third of what generic keywords pulls.
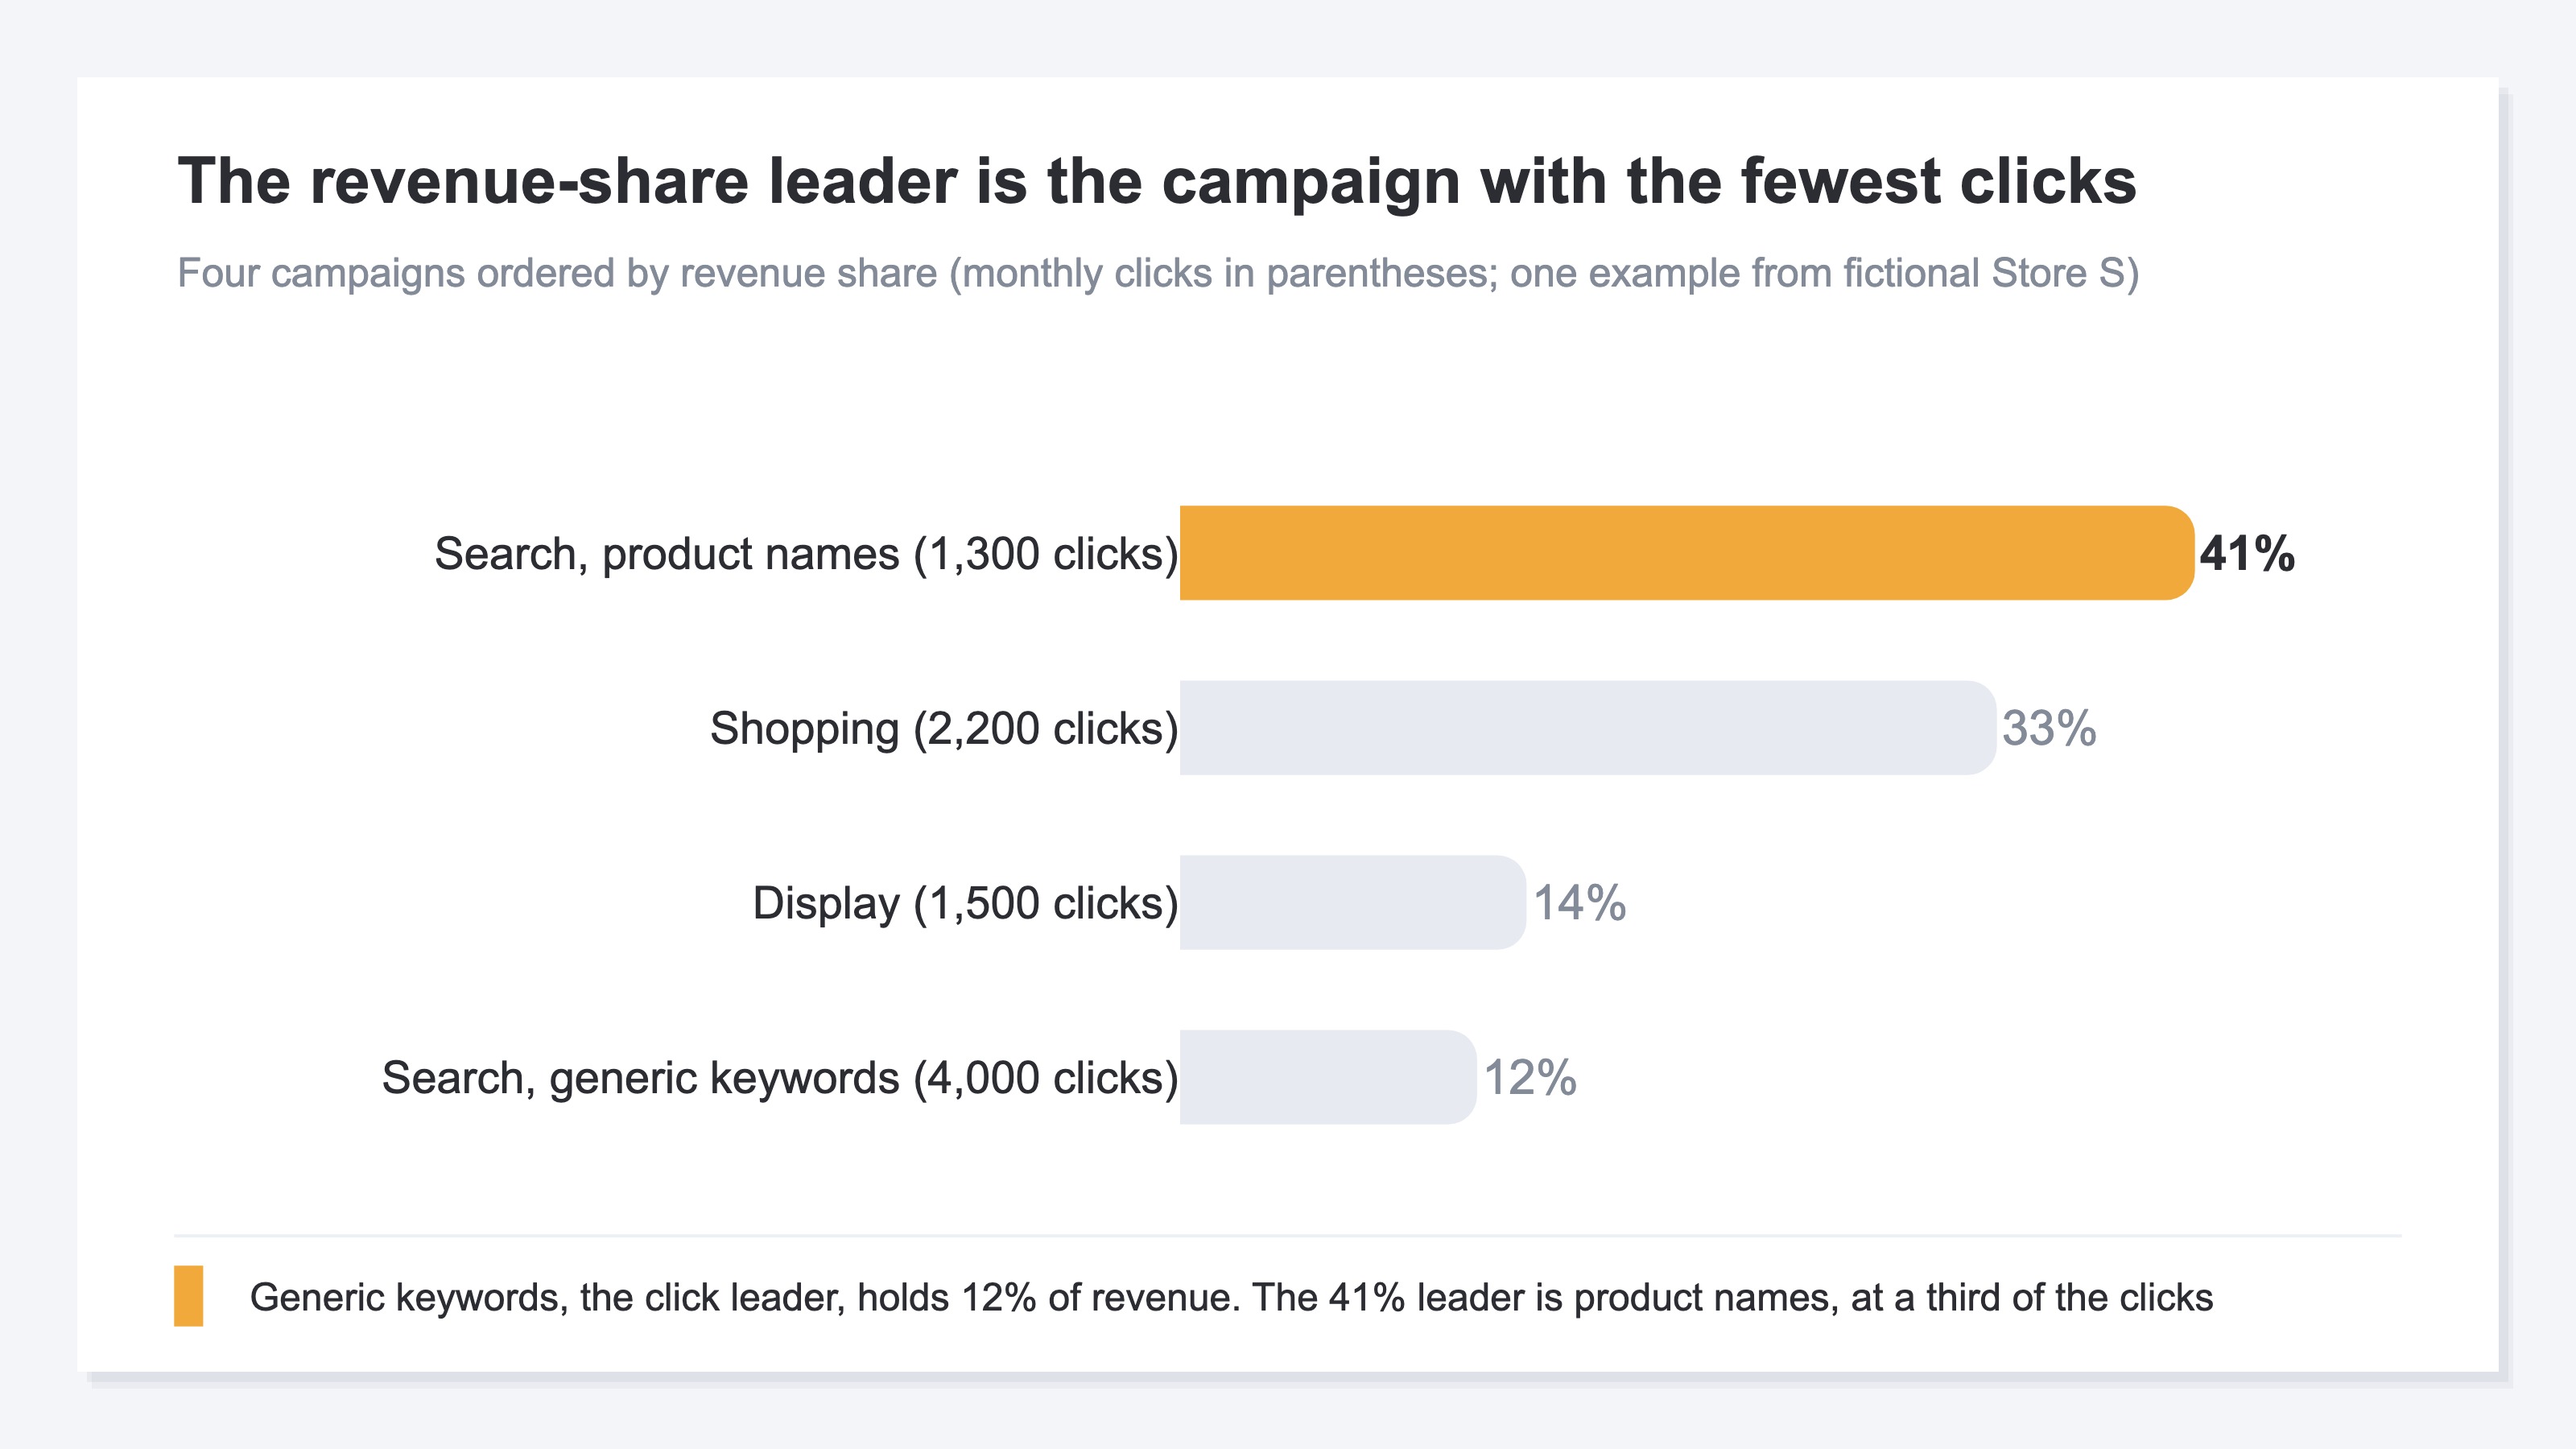
The reason the order flips is that the people typing those keywords are in different states. Generic keywords get typed by visitors who haven't decided what to buy. Product names get typed by visitors who have. The same single click carries a different intent to purchase.
The direction a recommendation pushes you follows from the bid strategy. The optimization score help page carries an example of this. A campaign using "Maximize Clicks" while reporting conversions may see a recommendation to adopt a performance-focused bid strategy such as target CPA[1]. What you have set as the goal changes what gets recommended. That is the mechanism working as designed, and there is nothing odd about it.
Revenue can be part of that goal. The same page says score and recommendations are focused on business objectives such as maximizing conversions or conversion value, and gives the example that with a Target ROAS bid strategy the score is geared towards driving more conversion value[1]. But what gets counted there is conversion value as the ad platform measured it. Which click gets credited, and how far back the counting reaches, follow the platform's own method. That is a different definition from revenue measured independently on your own site, so the numbers won't necessarily agree. Rather than chasing a match, placing an independently measured series alongside gets you to a decision faster. Ad and GA4 CV counts don't match covers the structure of that gap.
For campaigns whose internals aren't disclosed, the place to put the judgment is the same. Instead of dissecting the placement breakdown, decide keep-or-cut on landed revenue. How to judge P-MAX performance works through that approach.
4. Watching Both Score and Revenue Has a Deadline#
You can confirm all of this by hand. But the day for setting the next budget arrives before you finish confirming.
The procedure itself is settled. When you apply a recommendation, note the date. The "Change History" page keeps a record of what was applied, so the date is there to pick up[2]. From that day, compare revenue and sessions on your own site by campaign over equal-length periods on either side. That's all of it.
The problem is how many days you have for the work. With auto-apply on, applications run regularly[2]. Recommendations are only applied when they're relevant, so some get applied frequently while others never are automatically[2]. Records pile up regardless. Note each date one at a time, open the ad platform's console and the site's revenue data separately, line the periods up by hand, and reconcile how the campaign names are written. Cross a month boundary and last month has to be tallied again on its own.
The deadline doesn't wait either. Next month's budget is set at the start of the month. If an agency runs the account for you, the monthly reporting date is fixed too. You don't set the budget once the verification finishes; the verification has to be finished by the day you set the budget. Your agency's monthly report covers how to receive that reporting.
One more thing: a deadline makes averages tempting. Roll the whole account into a single value and the campaigns that grew and the campaigns that fell cancel each other out, and the relationship between score and revenue disappears. Average ROAS can't decide your ad budget covers why the split is needed.
The day for setting the budget comes around every month. In a month where the tallying falls behind, matching score against revenue is the first thing to drop.
RevenueScope solution
RevenueScope compares before and after the application on a basis separate from the ad platform's console. That basis is revenue measured on your own site. Specify a period running from the application date to today, and the same number of days immediately before it lines up alongside. Revenue measurement starts from a single tag placed on the site, so there is nothing to tally again each time.
Sessions, revenue and RPS (revenue per session — how much a single visit earned) are shown for each channel on the same screen. Visits judged to be automated are excluded from the metrics, and the number excluded is shown too.
Connect RevenueScope to ChatGPT or Claude and the AI reads your store's data directly to answer. Beyond specifying a period there is nothing to set up, and no SQL to write. Ask "from the bulk application date to today, versus the same number of days immediately before, how did revenue change?" and the answer comes back in the form below. Written out for fictional Store S, site-wide, 30 days after the application:
| Period | Sessions | Revenue | RPS |
|---|---|---|---|
| The 30 days before | 12,000 | ¥3,000,000 | ¥250 |
| The 30 days after | 15,000 | ¥3,060,000 | ¥204 |
Note: the screen behind the button reads the sample store's sample data, refreshed daily. The table above is a teaching example built on fictional Store S, so the screen shows a different period and different amounts.
Sessions grew 25% and revenue grew only 2%. RPS fell from ¥250 to ¥204. Over the same period in which the optimization score rose to 91%, what a single visit earned had gone down. Having the settings score and the revenue measurement on one timeline to read against each other is the starting point for deciding what to keep.
Open the channel breakdown and revenue, RPS, AOV and CVR are shown by utm_campaign. AOV is order value (revenue per order) and CVR is the conversion rate (the share of sessions that ended in a purchase). If you tag campaigns separately, generic keywords and product names appear as separate rows.
For periods where ad spend has been entered through the form or imported from CSV, ROAS — revenue measured on your own site divided by ad spend — is calculated for each channel. For periods with no ad spend imported, that metric isn't shown; there you compare what a session earns using RPS. Revenue whose entry point couldn't be identified is shown as unattributed.
The next move is to fix one changeover date and compare from there to today against the same number of days immediately before. If RPS fell over the period in which the score rose, that settles the order in which to revisit the recommendations.
FAQ#
Frequently asked questions#
Q. Should we be aiming for an optimization score of 100%?
A. There is nothing wrong with aiming for it. Officially, 100% means "that your account can perform at its full potential"[1]. But there are two routes there, applying and dismissing[1], so the number alone can't explain what is behind it. Alongside the work of raising the score, check how revenue measured on your own site moved over the same period.
Q. Can we reconcile the platform's conversion count with revenue on our own site?
A. The counting is done by different parties, so you can't make the numbers agree. You can place them side by side. For channels with ad spend entered, RevenueScope shows the platform's impressions, clicks and platform-measured conversions in the same table as revenue measured on your own site. It doesn't run automatic reconciliation to force a match. The use is to place them over the same period and check whether either basis flags the same thing for review.
Q. If revenue is growing, is it fine to leave a low score alone?
A. Not leave it alone — read the recommendations one at a time and decide each. Recommendations that don't fit your ads can be dismissed[1]. The material for that decision is how revenue and RPS moved around the date you applied. Put the height of the score itself up as the goal and that material never gets collected.
Q. If we stop the ads, will the relationship between score and revenue become clear?
A. Partly clear, partly not. The revenue from the stopped portion doesn't necessarily vanish, because some of it shifts to branded search and direct. What happens to revenue if you stop ads covers how to measure ad dependence. Stopping delivery in order to verify the score comes later in the order of work.
Summary#
Here is all of this in the form you use to decide. What the optimization score rates is how the account is set[1], and revenue is a result that happened on your own site. The conversion value the score is geared towards is also a figure the ad platform measured[1]. The bases differ, so the size of the rise in the score doesn't tell you how revenue moved.
The score doesn't tell you why it rose, either. There are two ways to raise it, applying and dismissing, and either can reach 100%[1]. The score moves in real time without you touching anything[1], and with auto-apply on, the daily applications stack on top[2]. The fact that it is higher than last month is not material for choosing the next move.
The reading goes in this order. Fix one changeover date. Compare revenue and sessions on your own site from that day to today against the same number of days immediately before. Split by campaign and check whether the volume leader and the revenue leader are the same campaign. Keep observing the score as you were. All you are adding is the measured revenue placed next to it.
The "Change History" page holds the date on which recommendations were last applied in bulk. Specify the number of days from that date to today as your period, and compare revenue and sessions on your own site against the same number of days immediately before. If the rise in the score and the movement in revenue don't line up, what you need to revisit before setting next month's budget is right there.
See which ads actually drive revenue, at a glance
Free up to 5,000 sessions/month, AI connection included. No credit card required. Up and running in 5 minutes.