Run P-MAX and the conversions come in. On paper it's working. But ask what exactly worked to produce this result, and you can't quite explain it — a scene anyone who runs ads knows well. The placements, the assets that worked — most of it stays hidden from your side, and only the result numbers come back.
Here's the conclusion first. What's inside P-MAX — which asset on which surface worked how much — isn't fully disclosed even by Google. So no matter how much time you spend dissecting the internals, your decision barely moves forward. What decides whether performance is good or bad isn't the internals; it's the exit — how much revenue that campaign ultimately produced, compared on a single yardstick of revenue per visit. This article lays out why the internals stay hidden, then walks through how to reach a decision by exit-side landed revenue efficiency instead of chasing the internals.
Table of contents
TL;DR#
-
The P-MAX internals are never fully disclosed
One campaign serves across every Google surface — Search, YouTube, Display, and more — and Google itself doesn't reveal which asset on which surface worked. So being unable to explain "what's working" is only natural
-
Dissecting the black box won't move your decision forward
Channel reports made part of it visible, but the surface-by-surface breakdown and search terms carry many limits and stay partial. The more time you spend dissecting, the more the budget decision that matters gets pushed back
-
Judge at the exit
What decides good or bad isn't the internals but how much revenue the campaign ultimately produced. Compare channels on a single yardstick of revenue per session (RPS), and a different face appears than the ROAS the platform's dashboard shows
-
Platform ROAS and landed revenue efficiency diverge
Even with a high platform ROAS, the efficiency of the real landed revenue can be low. Base your judgment on the exit numbers rather than the internals, and you can decide where to shift budget next
1. Why P-MAX can't explain what's working#
Bottom line: P-MAX serves one campaign across every Google surface — Search, YouTube, Display, Discover, Gmail, Maps, and more. AI handles the allocation and optimization automatically, and which asset on which surface worked how much is mostly invisible from your side. Being unable to explain it isn't a shortfall on the operator's part; it's because that's how it's designed.
With traditional campaigns you could follow the numbers surface by surface — search as search, display as display. P-MAX erases those boundaries and lets AI serve across surfaces to maximize results. The operator hands over assets and a goal; where and how to show them is left to the AI. The effort drops, but in return the breakdown of "where it worked" moves out of reach. The conversion result comes back, yet the path that produced it is invisible. This is the real source of the unease specific to P-MAX.
The problem is assuming this unease can be solved by "looking deeper inside." As the next section shows, no matter how far you pry the internals open, they never open all the way to what your decision needs.
2. Dissecting the black box won't move your decision forward#
Bottom line: Recently, channel performance reports and placement reports have made part of the serving surfaces visible. But the surface-by-surface breakdown and the actual search terms carry many limits — it's only partial disclosure. The deeper you dig here, the more time melts away, and the budget decision that matters gets pushed back.
It's true you can see more inside than before. You can grasp the outline of which surfaces got the most delivery and where things appeared. But it never reaches the granularity of "this asset, on this search term, produced this much revenue." And precisely because it's partially visible, you feel that just a little more prying will reveal everything, so you keep shuttling between reports. All the while, the real question — should I put next month's budget into this campaign — stays up in the air.
The same kind of getting-lost happens when you try to describe the whole by summing multiple platforms' ROAS into one. Adding up each platform's self-reported values doesn't give you the efficiency of the whole business (Why summing platform ROAS overstates efficiency). However precisely you chase the internals, as long as the base of your decision is "the numbers the platform reported," you can't move past it. So change the axis. Look not at the internals, but at the exit.
3. Judge at the exit: landed revenue efficiency by channel#
Bottom line: Move the axis of judgment from "internals" to "exit." The exit is how much revenue that channel ultimately produced. Compare channels on a single yardstick of revenue per session (RPS — Revenue Per Session), and a different ranking appears than the ROAS the platform's dashboard shows.
Platform ROAS is the conversion value the platform claims "happened because of my ad," divided by ad spend. It's not bad, but the revenue behind that claim and the revenue that actually landed on your site are different things. So even when P-MAX's dashboard ROAS is high, once you level it against the real landed revenue, the efficiency can come out low. What works here is a view that places every channel on the same "revenue per visit." Rather than platform ROAS — a yardstick that differs company by company — compare on the common exit of revenue that landed on your own site.
Looking at the exit reveals one more important reality: "unattributed" revenue tied to no channel. If you treat revenue that landed without a traceable last touch as nonexistent, your channel evaluation drifts from reality. Hold the unattributed share openly, as a percentage, and you avoid over- or under-crediting the contribution of each channel, P-MAX included (The truth about revenue tied to no channel). On top of that, overlay revenue efficiency with saturation and you can judge whether a channel still has room to grow or has already hit its ceiling.
Move budget on average ROAS alone and you'll miss this difference in saturation (Why average ROAS can't set your budget). "Where to shift next" — which dissecting the internals never reached — finally comes within reach through the exit numbers.
RevenueScope solution
Bottom line: RevenueScope lines up every channel, P-MAX included, on one screen by exit-side landed revenue efficiency. Instead of ROAS that differs platform by platform, it places revenue per session (RPS), landed revenue, and unattributed on the same yardstick — so without dissecting the internals, you can judge by revenue whether a campaign is truly working.
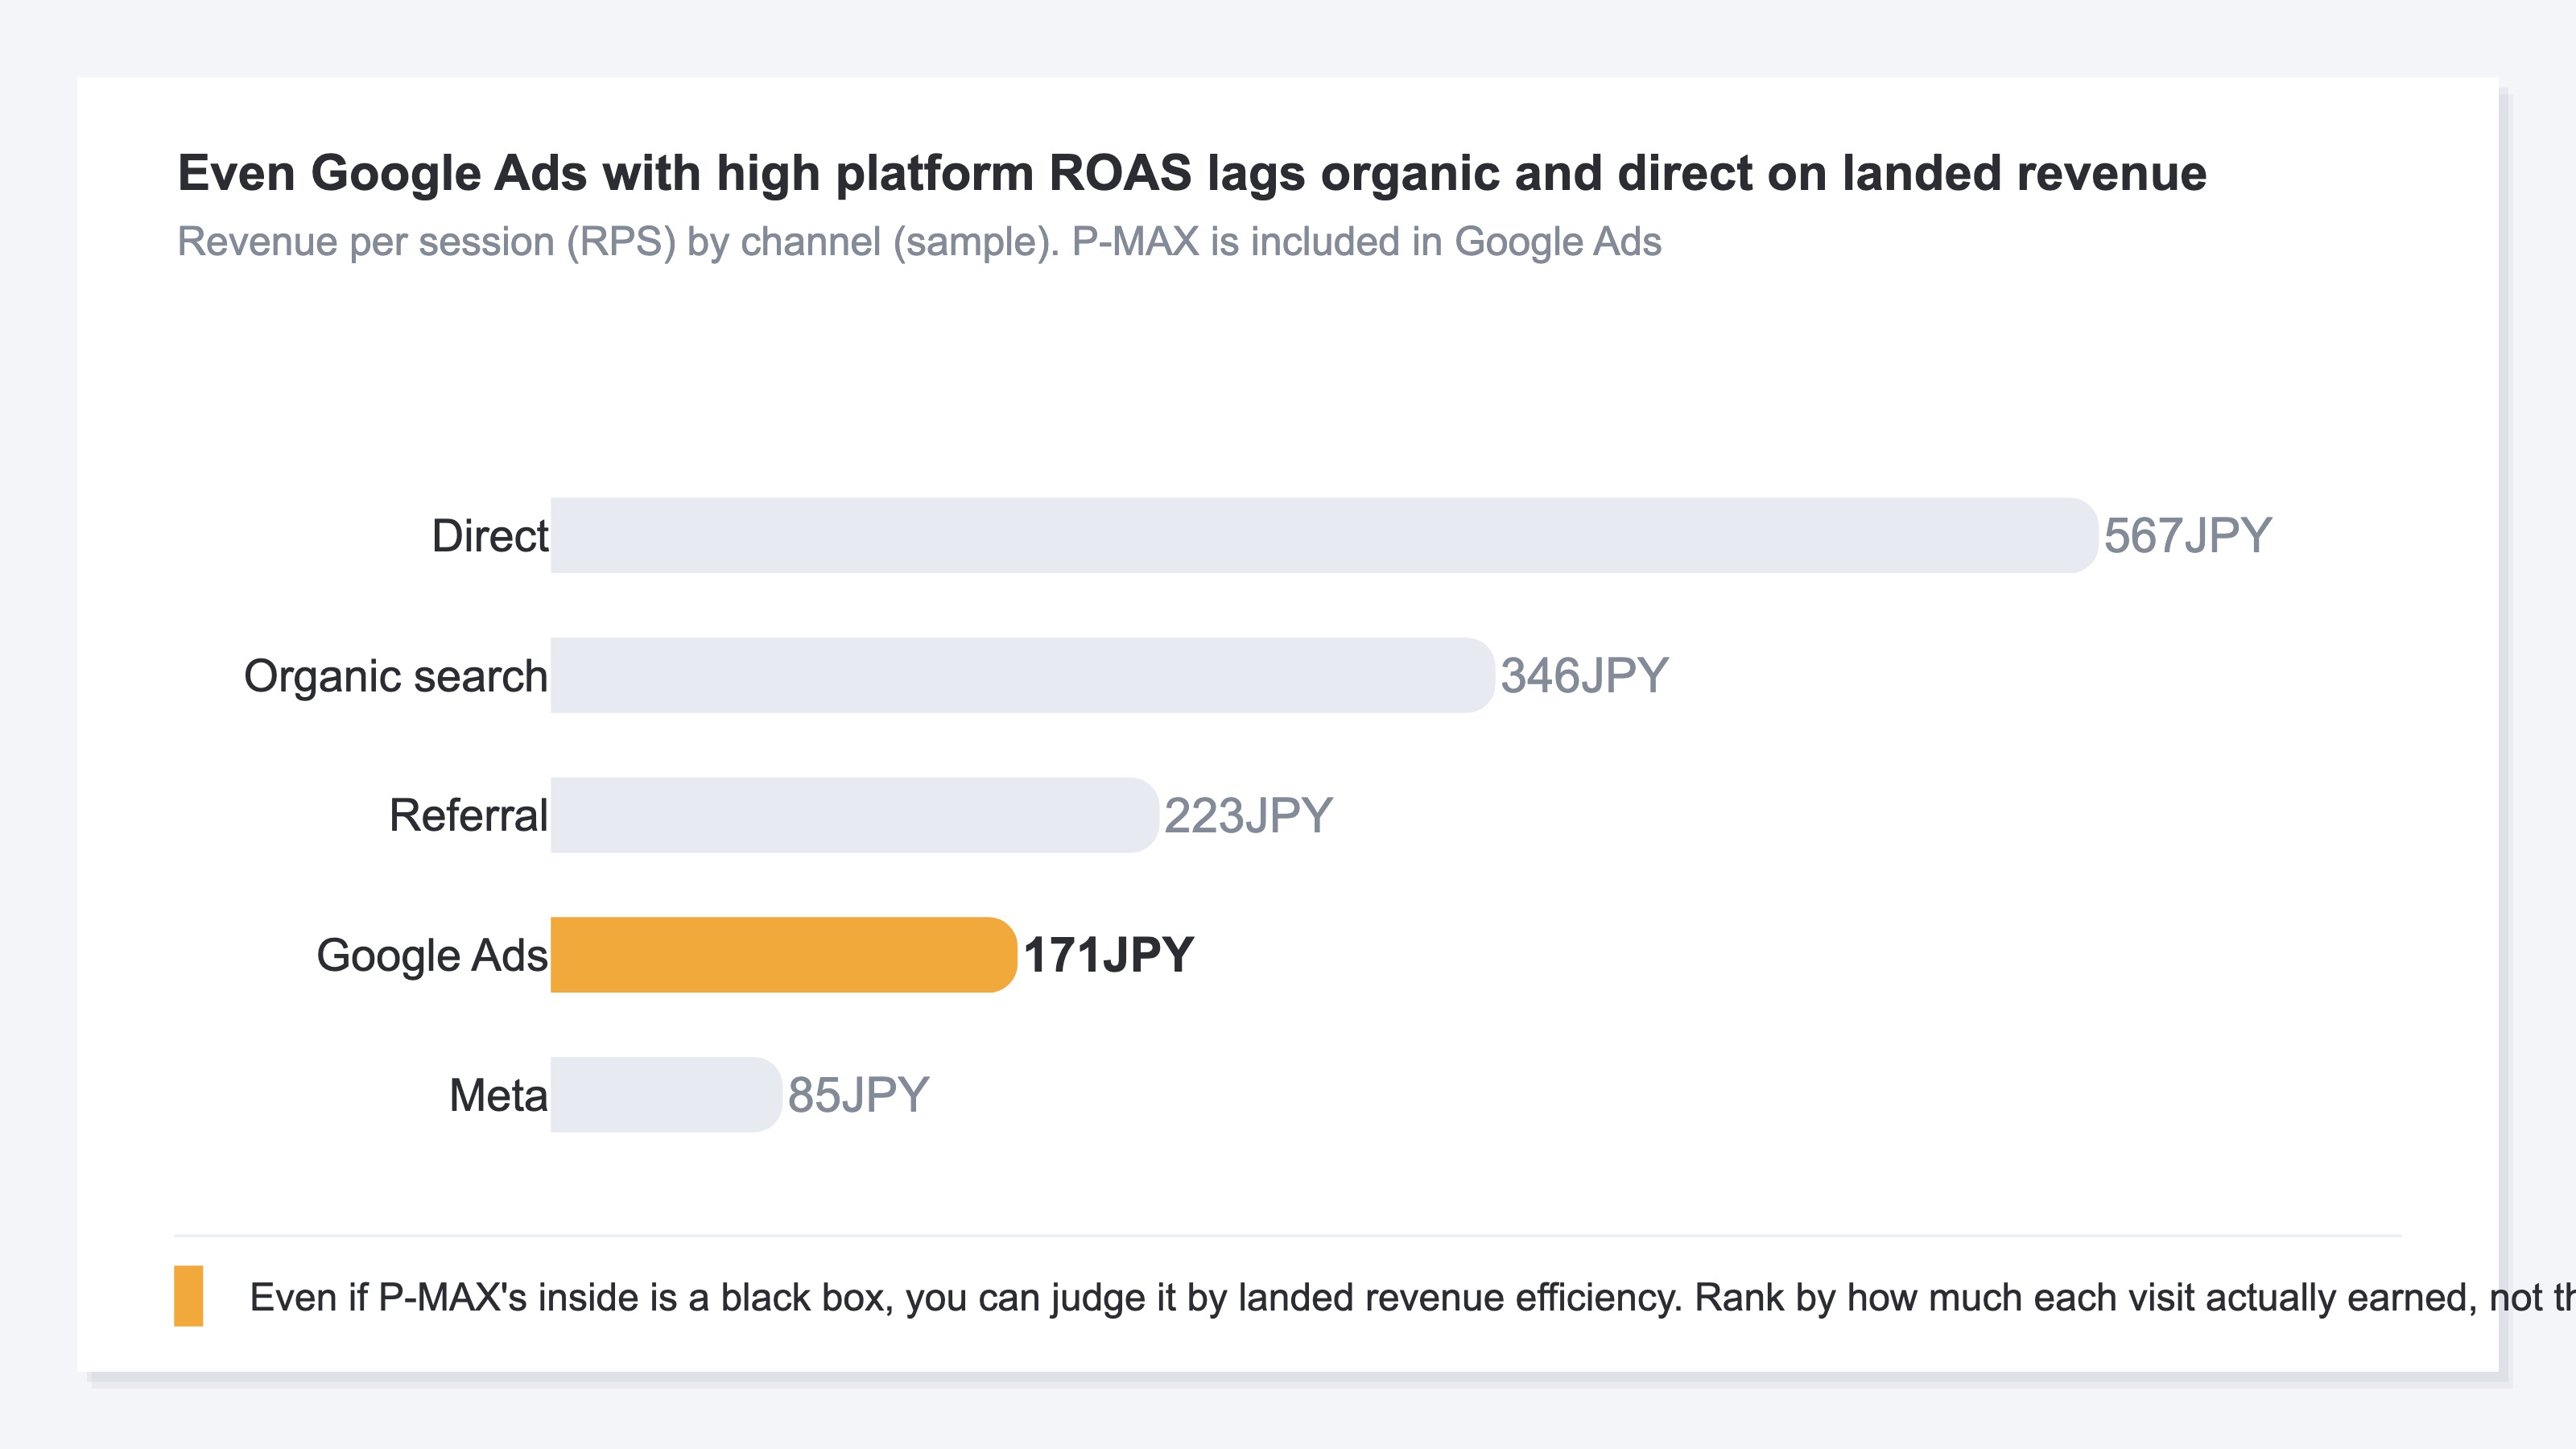
For example, on the sample-data fiction site (a demo ecommerce store), leveling paid Google Ads against other channels at the exit returns the following.
| Channel | Sessions | Revenue per visit |
|---|---|---|
| Google Ads (incl. P-MAX) | 162 | ¥171 |
| Meta | 183 | ¥85 |
| Organic Search (Google) | 371 | ¥346 |
| Direct | 219 | ¥566 |
Even if Google Ads looks strong on the platform's own dashboard ROAS, its landed revenue per visit is ¥171 — far short of organic search's ¥346 or direct's ¥566. Without chasing the internal breakdown, the lineup of revenue on this one screen supports the judgment that it may look good on the platform but lag in exit-side revenue efficiency. Which channel gets next month's budget is decided by this exit lineup, not by the internals.
What RevenueScope shows is, at its core, a comparison of efficiency anchored in landed revenue. It doesn't dissect which asset inside P-MAX worked, nor does it produce accounting/CRM-side figures like gross margin or LTV. Leave dissecting the internals to Google, and make the decision at the exit — its role is to hand you those exit numbers on a single yardstick.
FAQ#
Q. Should I ignore the P-MAX internals entirely?
A. Not entirely. Inspecting big skews via the channel performance report and the like is useful. The point is just that you can't hand your decision fully to it. Refer to the internals, but make the final good-or-bad call on exit-side landed revenue efficiency — splitting the roles that way is realistic.
Q. If the platform ROAS is high, isn't it performing?
A. Platform ROAS is a number each platform self-reports, and the revenue behind that claim differs from the revenue that actually landed. Even with a high dashboard ROAS, landed revenue per visit can come out lower. So rather than ROAS that differs platform by platform, you need to compare on a common exit (The numbers to check before cutting an ad that feels like it isn't working).
Q. Isn't the agency's report enough?
A. Agency reports, too, tend to rest on platform-reported values. Only by checking them against the revenue that landed on your own site do you learn whether the report's numbers match reality (Checking agency reports against your own data).
Summary#
P-MAX can't explain "what's working" because it's designed that way. Fixate on dissecting the internals and they never open all the way to what your decision needs — only time melts away. Change the axis. What decides good or bad isn't the internals but the exit — how much revenue the campaign ultimately produced, compared on revenue per visit. If the exit efficiency is low even when platform ROAS is high, rethink the budget you shift in. Leave the internals to Google and make the call on your own exit numbers. This is the shortest path to not being jerked around by the black box.
See which ads actually drive revenue, at a glance
Free up to 5,000 sessions/month, AI connection included. No credit card required. Up and running in 5 minutes.