ROAS ran at 400% through last month and came in at 280% this month. Nothing changed in the budget or the creative, and nobody can say why it fell. The first instinct in that moment is to pause the campaigns, but there is something to confirm before you do. ROAS is a result, so no amount of staring at the ratio itself will locate the cause.
Contents
TL;DR#
- ROAS breaks into three parts: CPC (cost per click), CVR (purchase rate) and average order value. If ROAS fell, the cause sits in one of those three
- The same "ROAS is down by a fifth" means two different things. When CPC is the cause and when CVR is the cause, the place you make the fix is somewhere else entirely
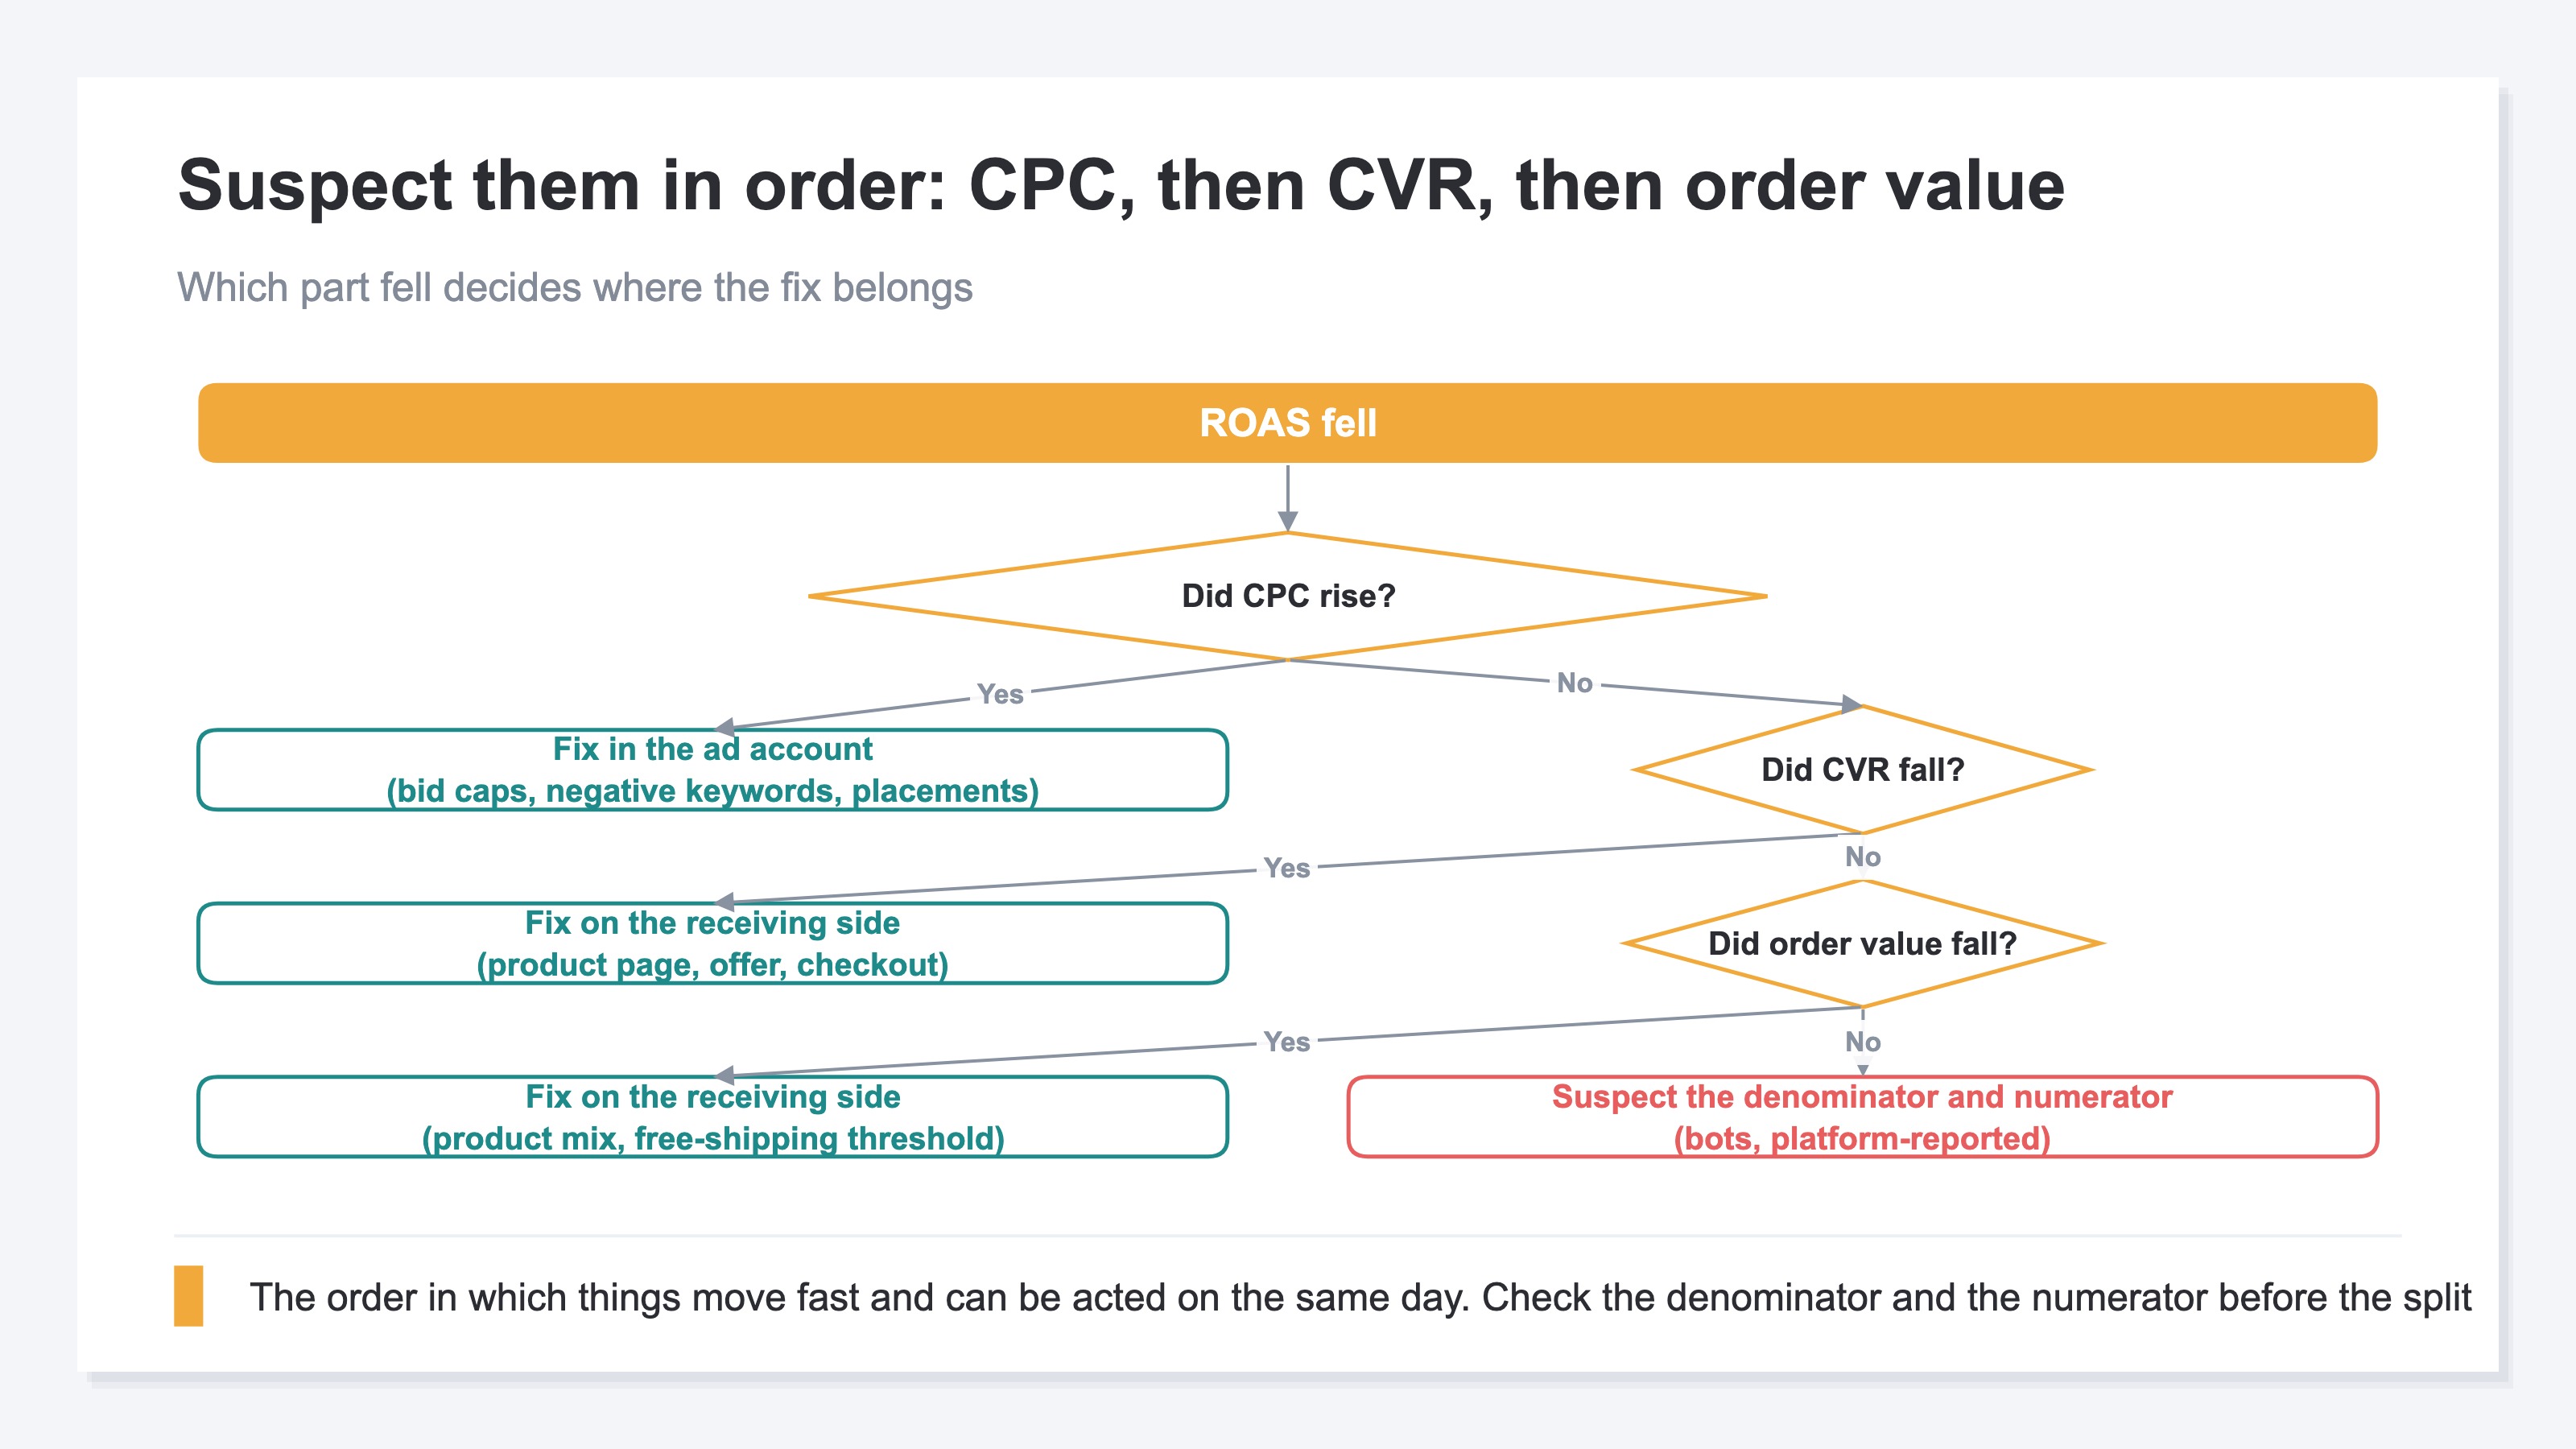
- The order to suspect them is CPC, then CVR, then AOV. That is the order in which things move fast and can be acted on the same day
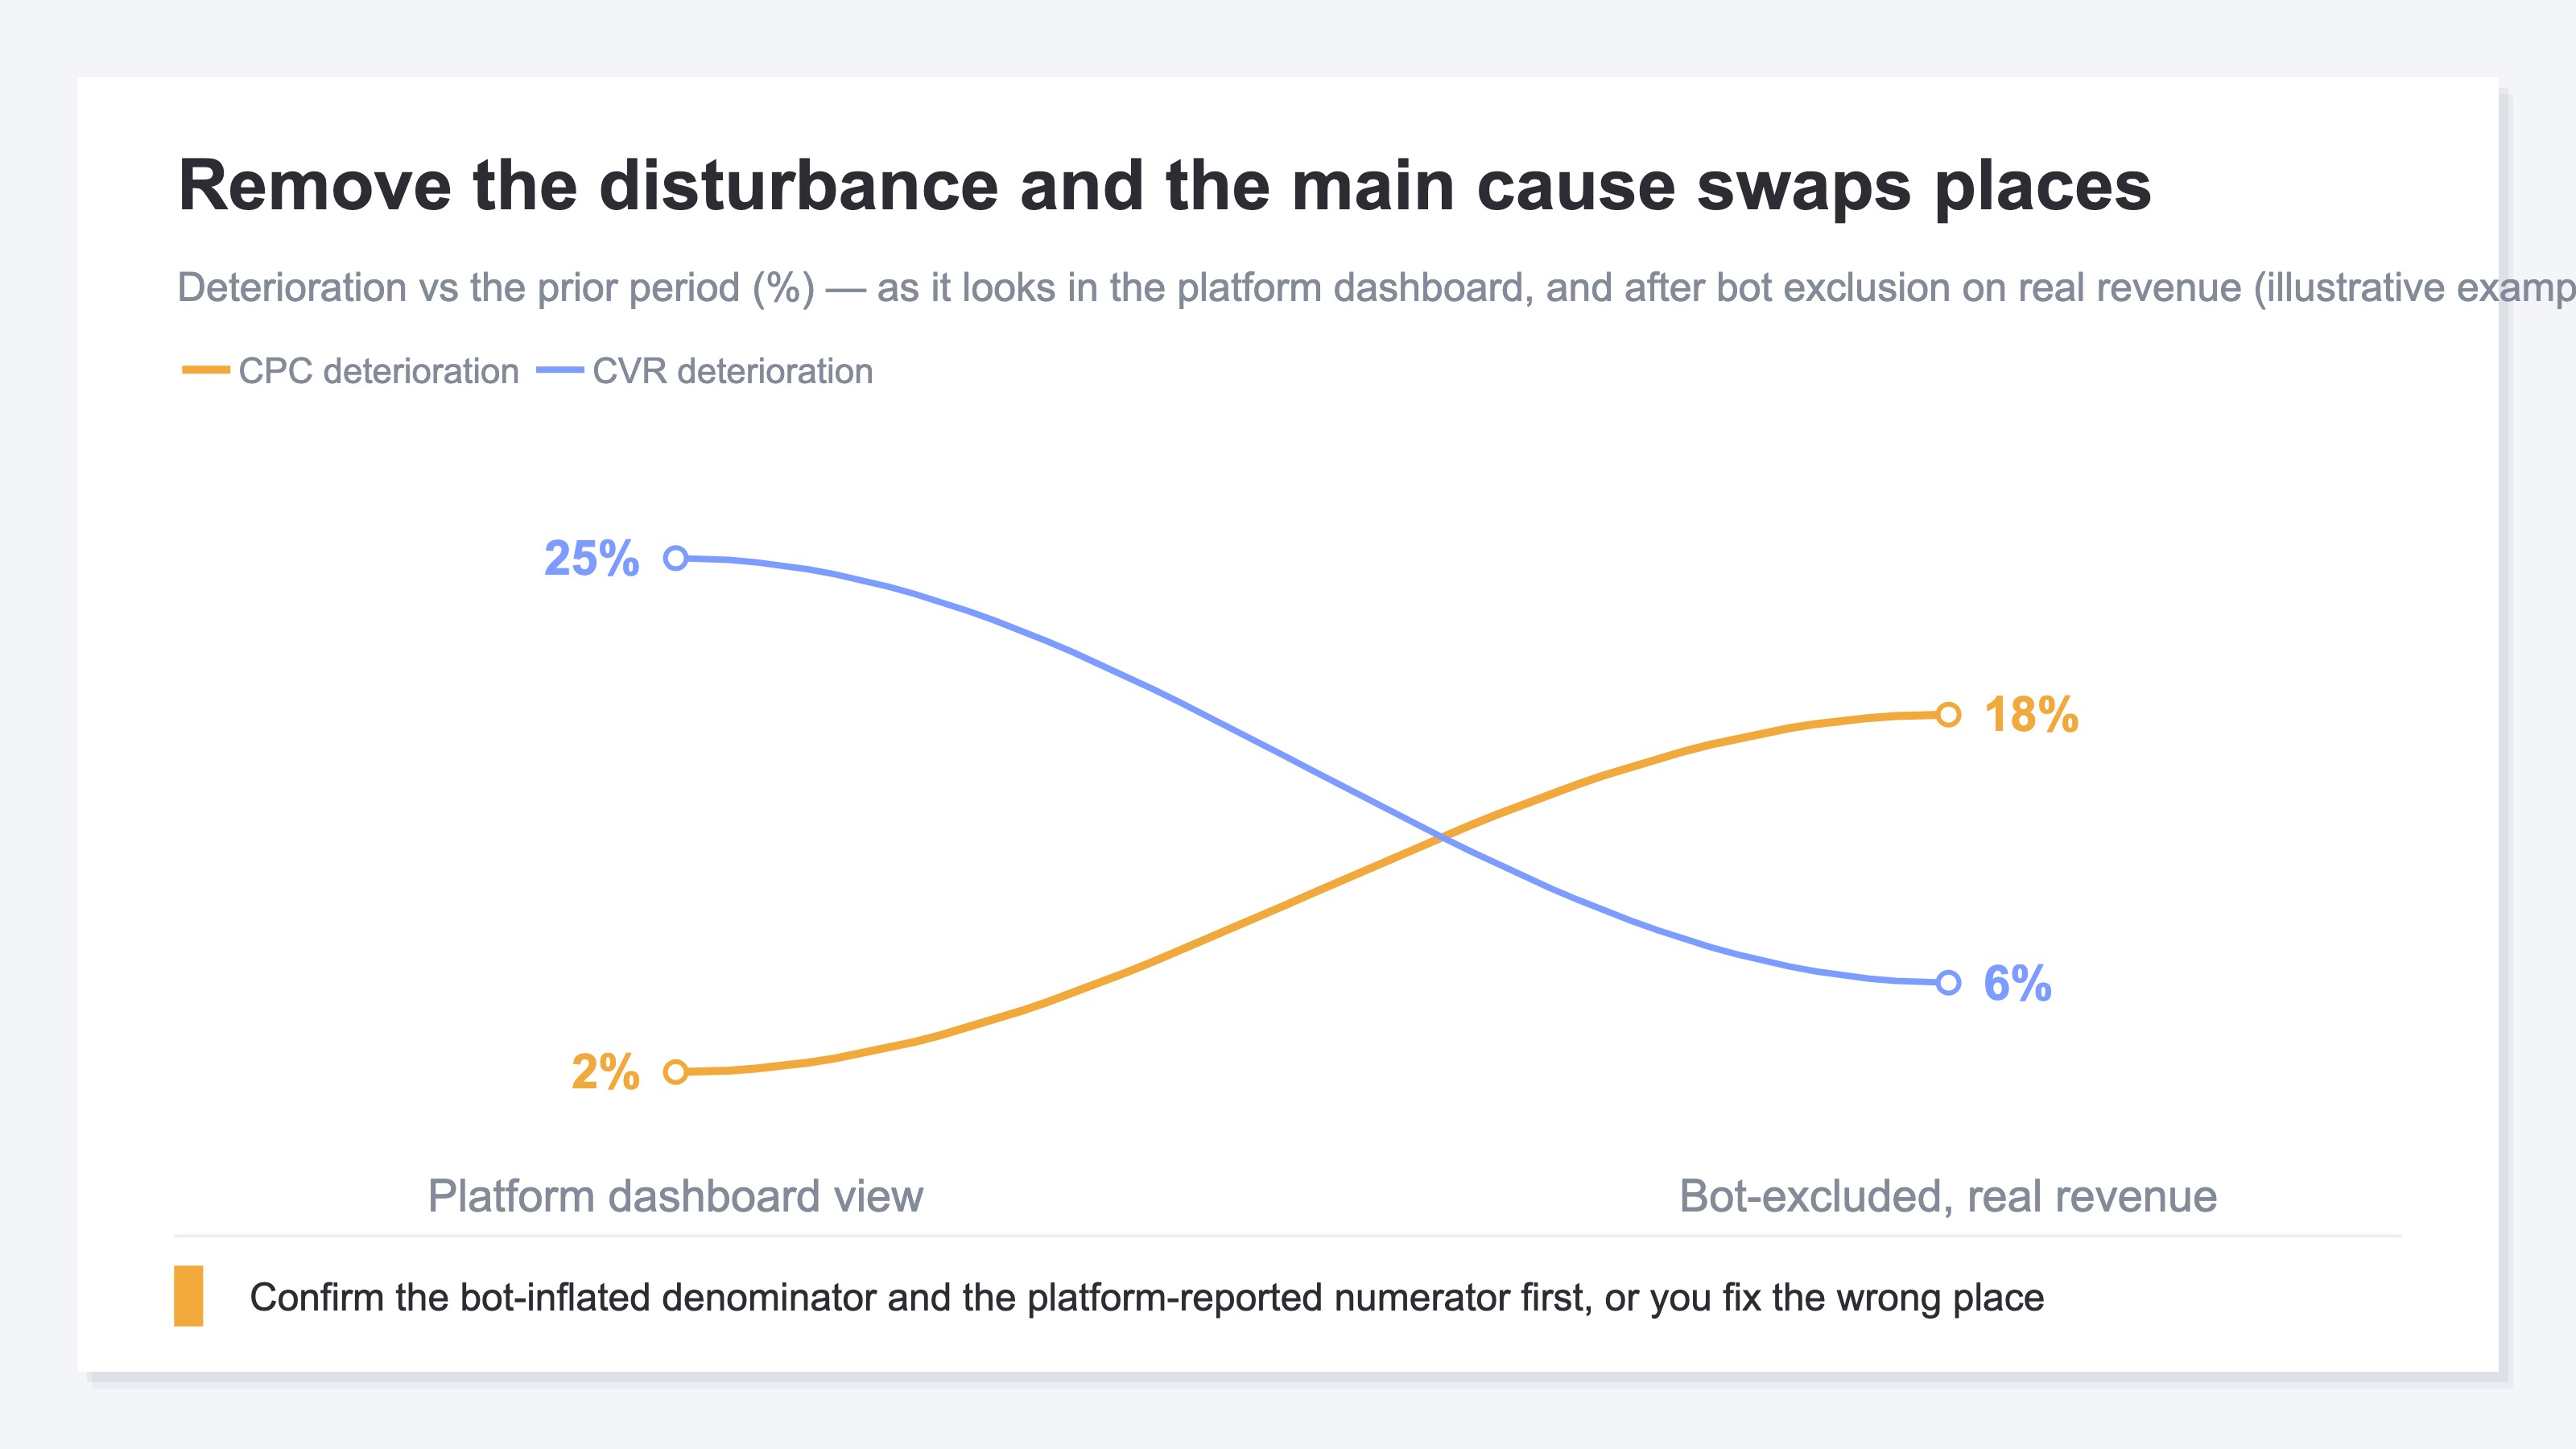
- Before you split anything into three, confirm the denominator (clicks) and the numerator (revenue). Once bots and platform-reported conversions are mixed in, the conclusion of the diagnosis flips
1. ROAS Is a Result: The Parts Are CPC, CVR and AOV#
ROAS is the result of three things multiplied together, so the ratio on its own does not tell you what to do.
ROAS (return on ad spend) is revenue from ads divided by ad spend. What ROAS is and how it is calculated covers the definition itself. What matters here is that the ratio is not an independent metric — it is a number computed out of three others.
Revenue from ads is set by clicks × CVR × average order value. Ad spend is set by clicks × CPC. Cancel the clicks that appear on both sides and ROAS reduces to CVR × average order value ÷ CPC. If ROAS fell, then either CPC rose, CVR fell, or average order value fell. There is no fourth option.
The same size of drop can mean the opposite thing#
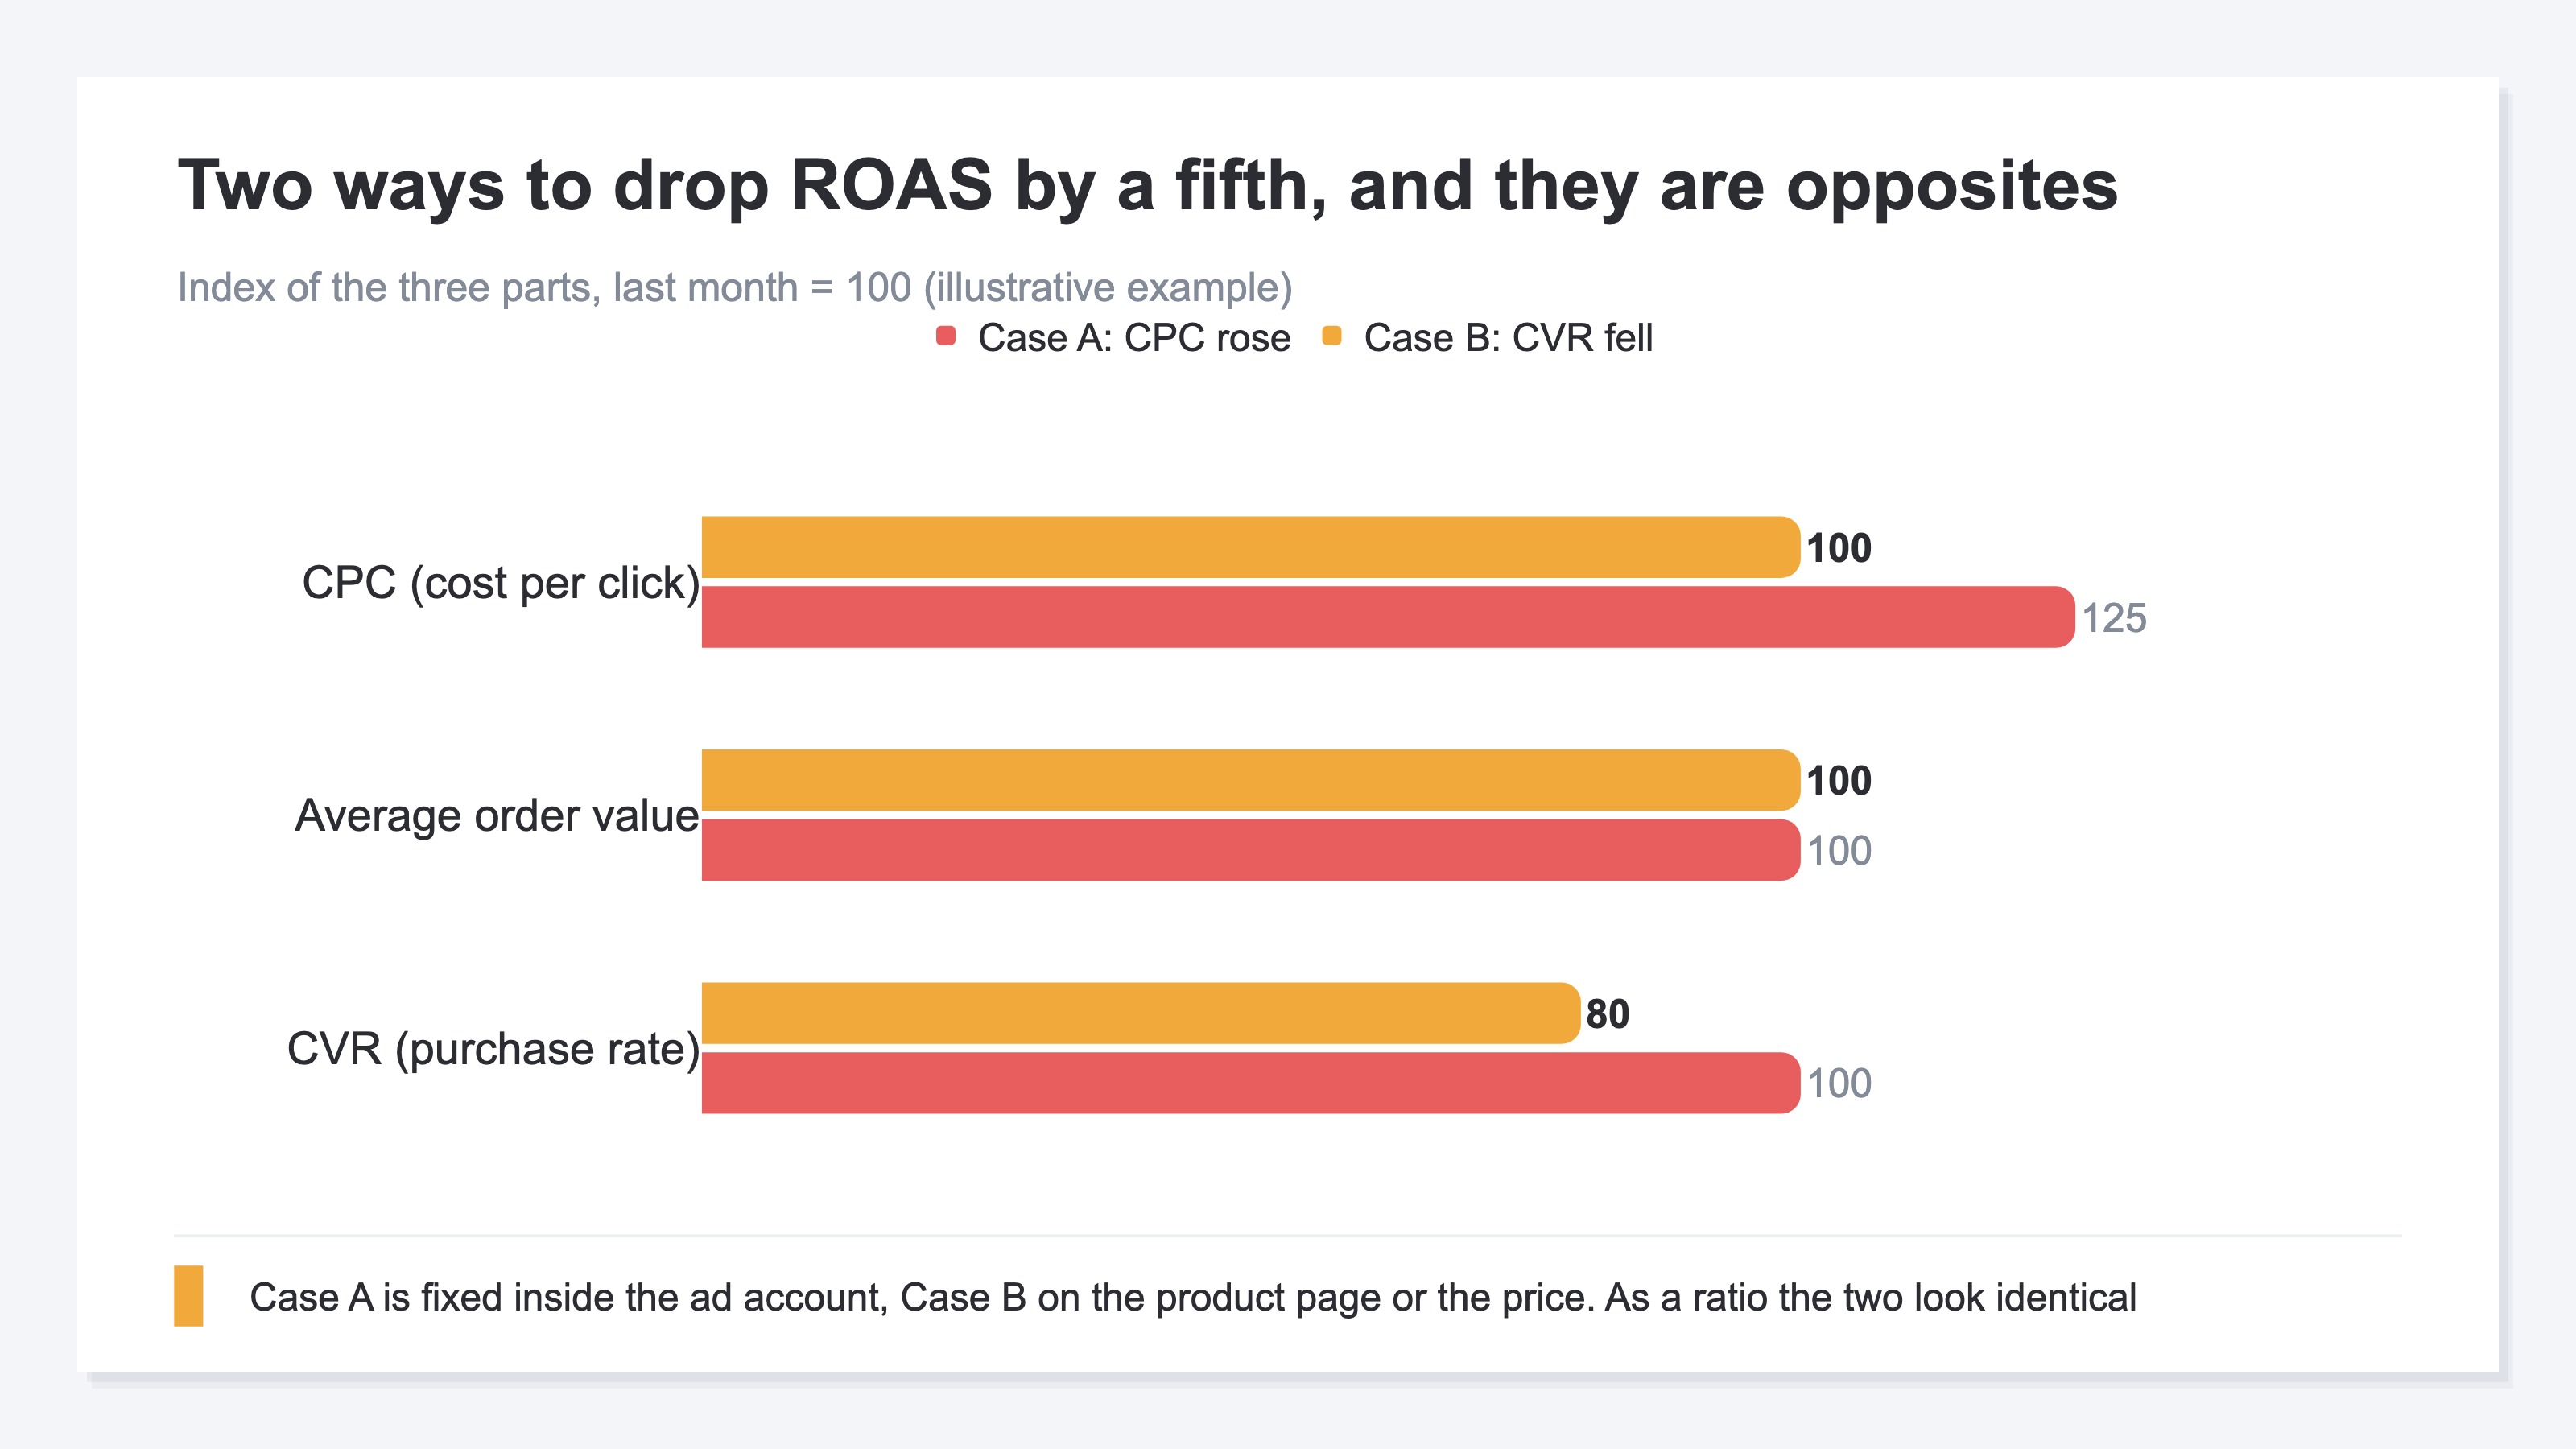
"ROAS is down by a fifth" carries two meanings. One is that CPC rose by a fifth and the cost of buying traffic got worse. The other is that CPC held flat while CVR fell by a fifth, so the visitors you bought stopped buying. As a ratio the two drops look identical, but the first is something you settle inside the ad account and the second is a question about product pages and pricing. As long as you handle it as a ratio, the two stay indistinguishable.
One number for the whole site cannot be split#
The other thing to watch is the unit you split on. Compute a single ROAS for the whole site and one channel getting worse gets cancelled out by another channel doing well. A drop of a fifth overall can be one channel halving while another grows. That is why the split is done channel by channel. Why average ROAS cannot decide your ad budget works through the same premise.
2. The Order to Suspect Them: CPC, Then CVR, Then AOV#
Rather than looking at all three at once, confirm them in the order CPC, then CVR, then average order value. That is the order in which they move fast and are easy to act on.
Why CPC comes first#
CPC is decided in an auction, so it can rise the following week purely because competitors bid more, with nothing changed on your side. With automated bidding that works to a target ROAS, bids are adjusted automatically according to the target you set and the results the system expects[1]. Because it moves fast, it comes up first among the candidate causes. CPC is also something you can act on the same day, by revising bid caps or adding negative keywords. CVR and average order value live on the receiving side, so even after you fix them the effect takes time to show.
What is happening when CPC rises#
The typical patterns are competitors bidding harder, seasonal peaks lifting prices, or the campaign widening its keywords and placements (the places ads are shown) until it starts appearing in more expensive inventory. The moves available are bid caps, negative keywords and narrowing placements, and all of them close inside the ad account. Cheap placements can also grow and pull in cheap clicks, but that does not mean the clicks turn into revenue. The cheap click trap and what RPS reveals covers that mechanism in detail.
What is happening when CVR falls#
If CPC is flat and ROAS is still down, CVR is next. This splits into cases where the mix of traffic changed and cases where the receiving side changed. The first is when placements and keywords were widened until the campaign started collecting people with little intent to buy. The second is more concrete: the week shipping went back to being paid, cart abandonment alone jumped. Product page changes, stockouts and price revisions sit in the same column. The most common reason people leave a cart right before buying is extra shipping costs and fees, cited by 40% of shoppers[2]. The moves available are product pages, offers and checkout, and all of them sit outside the ads.
What is happening when average order value falls#
That leaves average order value. If the amount per order has shrunk, suspect sales and discounts, fewer multi-item orders, or traffic skewing toward cheaper products. What you reach for is the product mix and the free-shipping threshold. These, too, sit outside the ads.
Because the three put the fix in three different places, pausing campaigns before deciding which one fell leaves the cause standing. And if revenue is trending down across the whole site rather than only through ads, the starting point changes. In that case, begin from how to pinpoint why ecommerce revenue dropped.
3. Check the Denominator and the Numerator First#
If the clicks in the denominator and the revenue in the numerator are disturbed, the conclusion of the three-way split flips. Confirm those two before you split any numbers.
A disturbed denominator means bots and invalid clicks#
One thing to settle first is what the denominator actually is. The "clicks" that ad spend is divided by are the ones the platform charged for, while the "sessions" that form the denominator of CVR are counted on your own site. The two do not agree.
Google detects automated clicks and unintended duplicate clicks as invalid clicks and removes them from your costs[3]. Analytics has its own mechanism for excluding known bots — automated programs rather than people[4]. Even so, some slip through. When bots or measurement gaps inflate sessions alone, visits that were never going to buy enter the denominator, so CVR reads lower than reality. In the other direction, computing CPC from site-side sessions instead of the clicks the platform charged for makes the cost of traffic look cheaper than it is.
Split three ways in that state and the diagnosis comes back as "cost per click is fine but CVR got worse." In reality the problem is not the receiving side — it is the denominator you are counting. Act on the product page in the belief that conclusion is true and the numbers will not come back. How ad spend leaks into bots, seen channel by channel covers how to confirm how much is mixed in per channel.
A disturbed numerator means platform-reported conversions#
What a platform's dashboard returns is the conversions that platform judged to be the result of its own ads. If one buyer touched ads on several platforms, each of them counts that purchase as its own result. Google Ads itself points to transaction IDs as the way to keep the same transaction from being counted twice[5]. The confusion of seeing conversion counts and CVR sitting right there in the dashboard, then failing to reconcile them against real revenue at month end, starts here.
To the extent that purchases came after touching several platforms, a ROAS with platform-reported values in the numerator reads higher than reality. You notice a decline late, and by the time you do the gap has widened. So the numerator of ROAS goes to real revenue measured on your own site. Why summing platform ROAS overstates it works through how far the sum overstates, with a numeric example. Here we stay on one question: how that inflation flips which part gets named as the main cause.
When both mix, the diagnosis flips#
When these two mix at the same time, the answer from the three-way split reverses. The purchase rate reads lower than reality and ROAS reads higher, so a case where the cost of buying traffic actually got worse gets misread as "the receiving side is bad." Tightening bids and seeing nothing improve is what that looks like. Confirm these two before you split any numbers.
The split itself is addition and division. The heavy part is the repetition. Ad spend, revenue, clicks, purchase rate and average order value have to be gathered for every channel and compared against the preceding period of the same length, and that has to be assembled every month across every channel.
RevenueScope solution
RevenueScope supplies the data this separation needs. Enter ad spend through a form or upload it by CSV, and ROAS per channel is computed as "the real revenue RevenueScope measured ÷ ad spend." The numerator is revenue that actually occurred on the site, not the conversion value a platform reported. Revenue, sessions, RPS and the number of bot exclusions line up per channel on the same screen, so for the channel whose ROAS fell you can decide whether to start from the cost side or the receiving side.
RPS is revenue per session, which is the purchase rate and the average order value multiplied together. So if RPS also fell for the channel whose ROAS fell, the cause is the receiving side; if RPS held flat, it is the ad spend it took to bring in one session. That figure comes from dividing the ad spend on the same screen by the session count. Pinning down whether it was the purchase rate or the average order value that fell can wait until this separation is done. RevenueScope supplies, in the same shape every month, the material for the decision that comes before it: which of the two to pin down.
Asking an AI assistant through MCP returns this#
| Channel | Period | Ad spend | Sessions | Revenue | RPS | ROAS |
|---|---|---|---|---|---|---|
| Google Ads | Last month | ¥240,000 | 2,400 | ¥960,000 | ¥400 | 400% |
| Google Ads | This month | ¥320,000 | 2,240 | ¥896,000 | ¥400 | 280% |
| Last month | ¥180,000 | 3,000 | ¥540,000 | ¥180 | 300% | |
| This month | ¥180,000 | 3,000 | ¥378,000 | ¥126 | 210% | |
| LINE | Last month | ¥60,000 | 900 | ¥270,000 | ¥300 | 450% |
| LINE | This month | ¥60,000 | 880 | ¥264,000 | ¥300 | 440% |
An illustrative ROAS diagnosis using sample data for a fictional site.
What stands out in this case is that Google Ads and Instagram lost ROAS by similar amounts while the contents are opposites. Google Ads holds RPS at ¥400, unchanged. Nothing about how it sells got worse; the ad spend it took to bring in one session rose from ¥100 to ¥143, and that is what took ROAS from 400% to 280%. The place to act is bid caps and negative keywords. Instagram is the reverse: ad spend and sessions are the same as last month, while RPS went from ¥180 to ¥126, a drop of three tenths. The cost of buying traffic did not change, so the cause is the receiving side. The same "ROAS got worse" puts the next fix in opposite places.
Bot exclusion is the share of site-side visits removed as automated programs; it does not inspect the clicks the platform charged for. Instagram's bot exclusion sat at 5% both last month and this month, so RPS falling by three tenths is not visits being inflated. On the receiving side, how it sells genuinely got worse.
FAQ#
Frequently asked questions#
Q. When ROAS drops, should the first move be to pause the ads?
A. Before pausing, confirm which metric fell. If CPC merely rose, bid caps or negative keywords can sometimes bring it back. If CVR is down, pausing leaves the problem on the receiving side untouched. And for products where days pass between the visit and the purchase, revenue can keep falling for a while after you pause.
Q. Is it wrong to use the ROAS shown in the platform's dashboard?
A. Platform numbers are useful for adjusting bids inside that platform. But the numerator is platform-reported conversions, so purchases that touched several platforms get counted more than once and the figure reads higher than real revenue. For ROAS you invest on, putting real revenue measured on your own site in the numerator is the reliable choice.
Q. What do I do when CPC and average order value got worse at the same time?
A. Compare all three against the prior period and start with whichever affected the ROAS drop most. CPC and average order value put the fix in different places, so touching both at once means you cannot separate afterwards which one worked. Make one change, compare against the preceding period of the same length, then move to the next.
Q. Why does ROAS fall even though CPC is going down?
A. It happens when cheap placements and search keywords grow and the share of traffic that never converts rises with them. Clicks go up and CPC comes down, but CVR falls further, so ROAS gets worse. Bots mixed into the count produce the same shape, so confirm it on figures taken after bot exclusion.
Summary#
ROAS is a result, so looking at the ratio itself will not tell you what to do. The cause of a drop sits in one of three parts — CPC, CVR and average order value — and which one fell decides whether the fix belongs to the ads or to the pages that receive the traffic. The order to suspect them is CPC, then CVR, then average order value. And before that, confirm a denominator inflated by bots and a numerator inflated by platform-reported conversions. Start by picking one channel whose ROAS recently fell and working out its CPC, CVR and average order value against the prior period.
See which ads actually drive revenue, at a glance
Free up to 5,000 sessions/month, AI analyst included. No credit card required. Up and running in 5 minutes.
References#
- [1] Google Ads Help "About Target ROAS bidding" (2026)
- [2] Baymard Institute "50 Cart Abandonment Rate Statistics" (2026)
- [3] Google Ads Help "Invalid clicks: Definition" (2026)
- [4] Google Analytics Help "Known bot-traffic exclusion" (2026)
- [5] Google Ads Help "Use a transaction ID to minimize duplicate conversions" (2026)