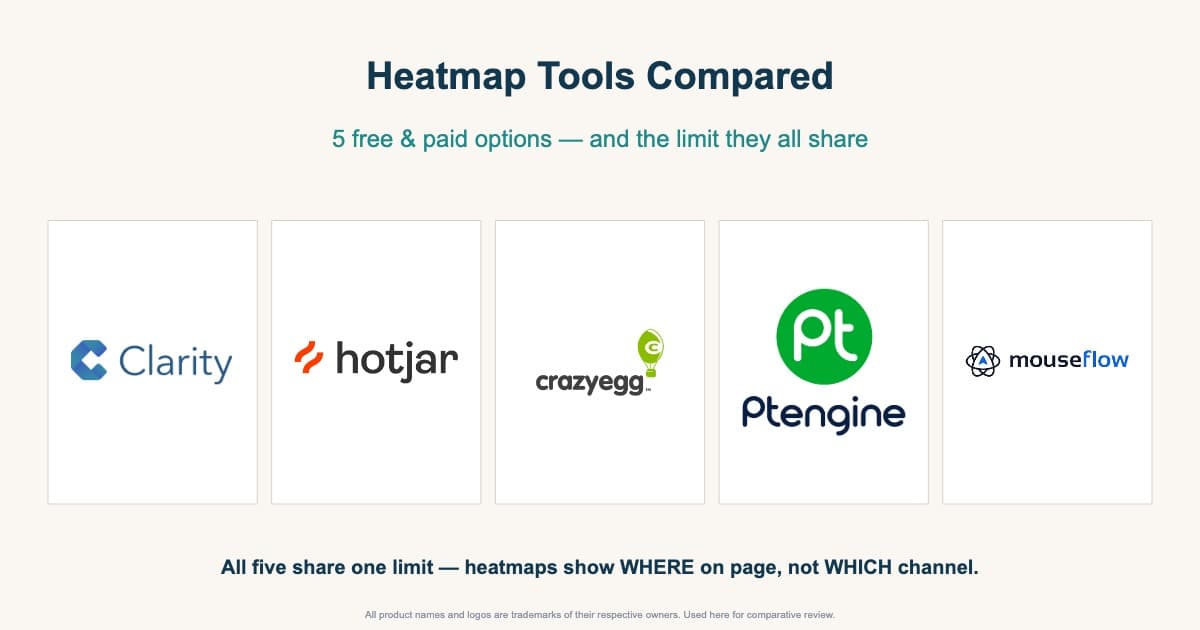
"Will installing a heatmap grow our revenue?" It is one of the most common questions ecommerce operators ask. The honest answer: heatmaps are excellent at finding where on the page you're losing revenue, but they will not tell you which traffic source delivered the buyer. This article compares the five major heatmap tools — Microsoft Clarity, Hotjar, Crazy Egg, Mouseflow, Ptengine — on features, pricing, and how to choose, and ends with the structural limit none of them solve.
Table of contents
- What Heatmaps Show, and What They Don't
- Comparing the Five Tools and How to Choose
- The Limit All Five Share — Revenue by Channel
RevenueScope solution / FAQ / Summary / References / Related articles
TL;DR#
-
Two free tools dominate
Microsoft Clarity (unlimited sessions, free forever) and Hotjar Free (200k sessions/month, 1-month retention). Different strengths; many teams run both
-
Three paid tools differentiate by use case
Hotjar Pro for per-zone revenue analytics, Crazy Egg for built-in A/B testing, Mouseflow for form analytics and friction detection. Pricing ranges from $25 to $599/month
-
All five share a structural blind spot
They show what happens on the page, not which traffic source delivered the revenue. Channel-level efficiency (RPS, AOV, ROAS) lives in a separate layer
1. What Heatmaps Show, and What They Don't#
Bottom line: heatmaps show in-page behavior. "Which traffic source delivered the buyer" is a different axis of information entirely.
Heatmap tools visualize in-page user behavior: clicks, scroll depth, mouse movement, form-field interaction, rage clicks. They excel at one job — pointing to the location where users get stuck.
What EC budget decisions need instead — deciding which traffic source deserves more ad spend — is a different axis: "which visitors, arriving from where, actually spent how much."
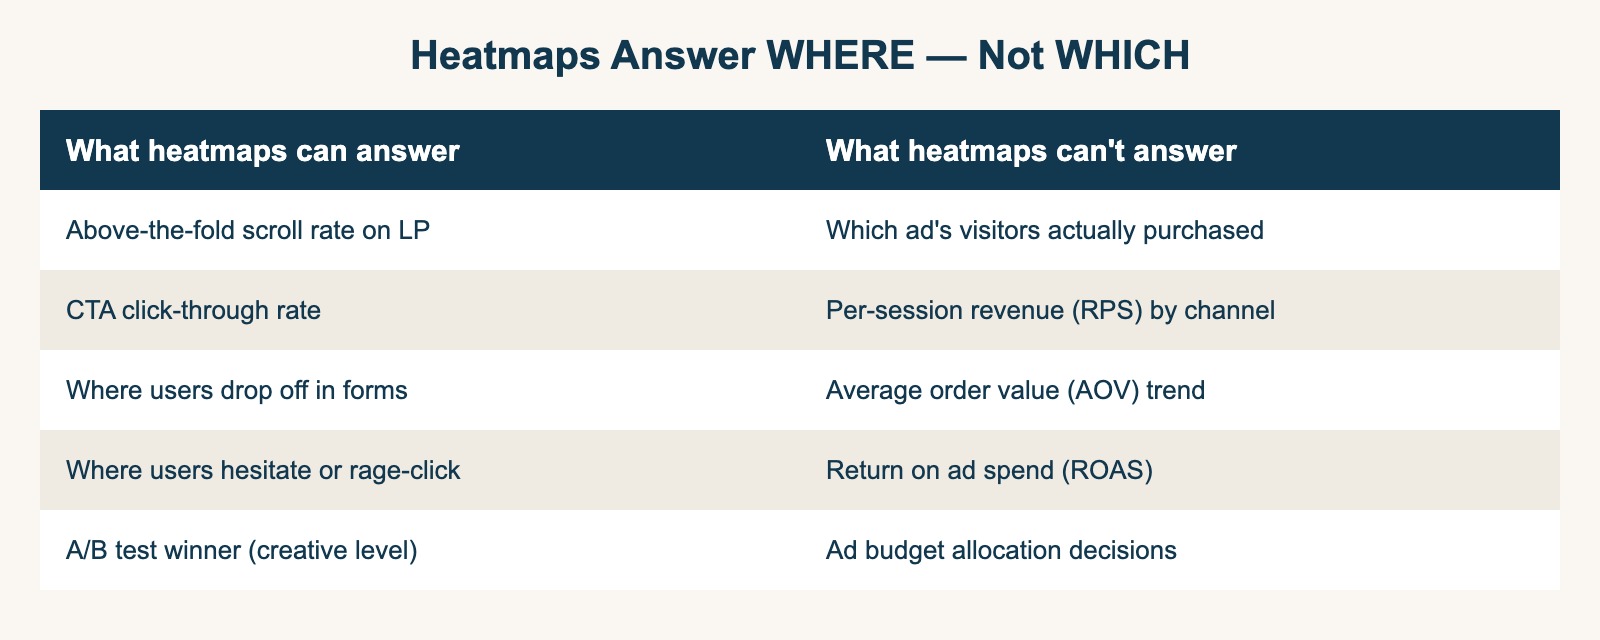
Web analytics data splits into three axes. First is the spatial axis (where on the page users moved), second the temporal axis (in what order), and third the source axis (which channel they arrived from). Heatmaps are strong on the first two. The third — and especially revenue by source — sits outside a heatmap's design.
Fixing this WHERE on page vs. WHICH channel split in your head first makes the five-way comparison below click. A number like revenue per session (RPS) only becomes meaningful once it is broken out by source — and that is exactly what a heatmap cannot produce. See RPS (revenue per session) explained for the basics.
2. Comparing the Five Tools and How to Choose#
Bottom line: the free layer is a two-way pick — Microsoft Clarity or Hotjar Free. The three paid tools are chosen by the problem you need to solve. Pricing spans $25–$599/month.
The five main options compared on features, pricing, and retention:
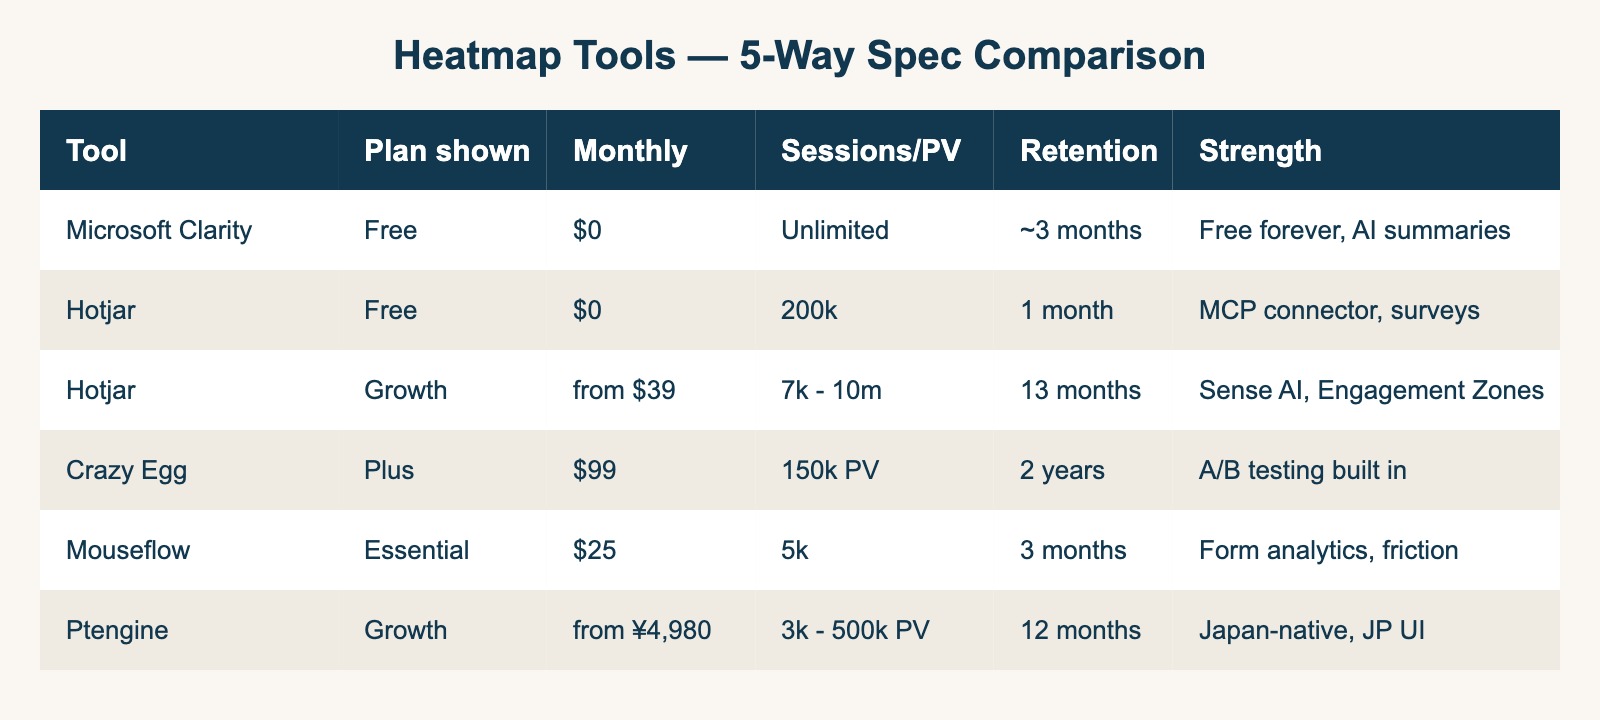
Primary use case per tool (Hotjar joined the Contentsquare group in 2026[2]):
- Microsoft Clarity — install-by-default free baseline; no traffic ceiling, no cost even at high PV[1]
- Hotjar Free — small-to-mid sites that want surveys or LLM (MCP) access at zero cost[3]
- Hotjar Paid — Pro's "Zone-based Heatmaps with Revenue metrics" attributes revenue to on-page zones[3]
- Crazy Egg — Plus ($99) bundles A/B testing with heatmaps — a single tool for LP CTA optimization[4]
- Mouseflow — Essential ($25) unlocks Friction Insights and Form Analytics, pinpointing where checkout drops[5]
- Ptengine — fully Japanese UI, plus a unified platform combining Insight (analytics) and Experience (A/B + personalization)[6]
Ptengine is the only PV-metered tool. If your site averages 5 PV/session, 100k sessions ≈ 500k PV, which lands in the upper plans[6][7].
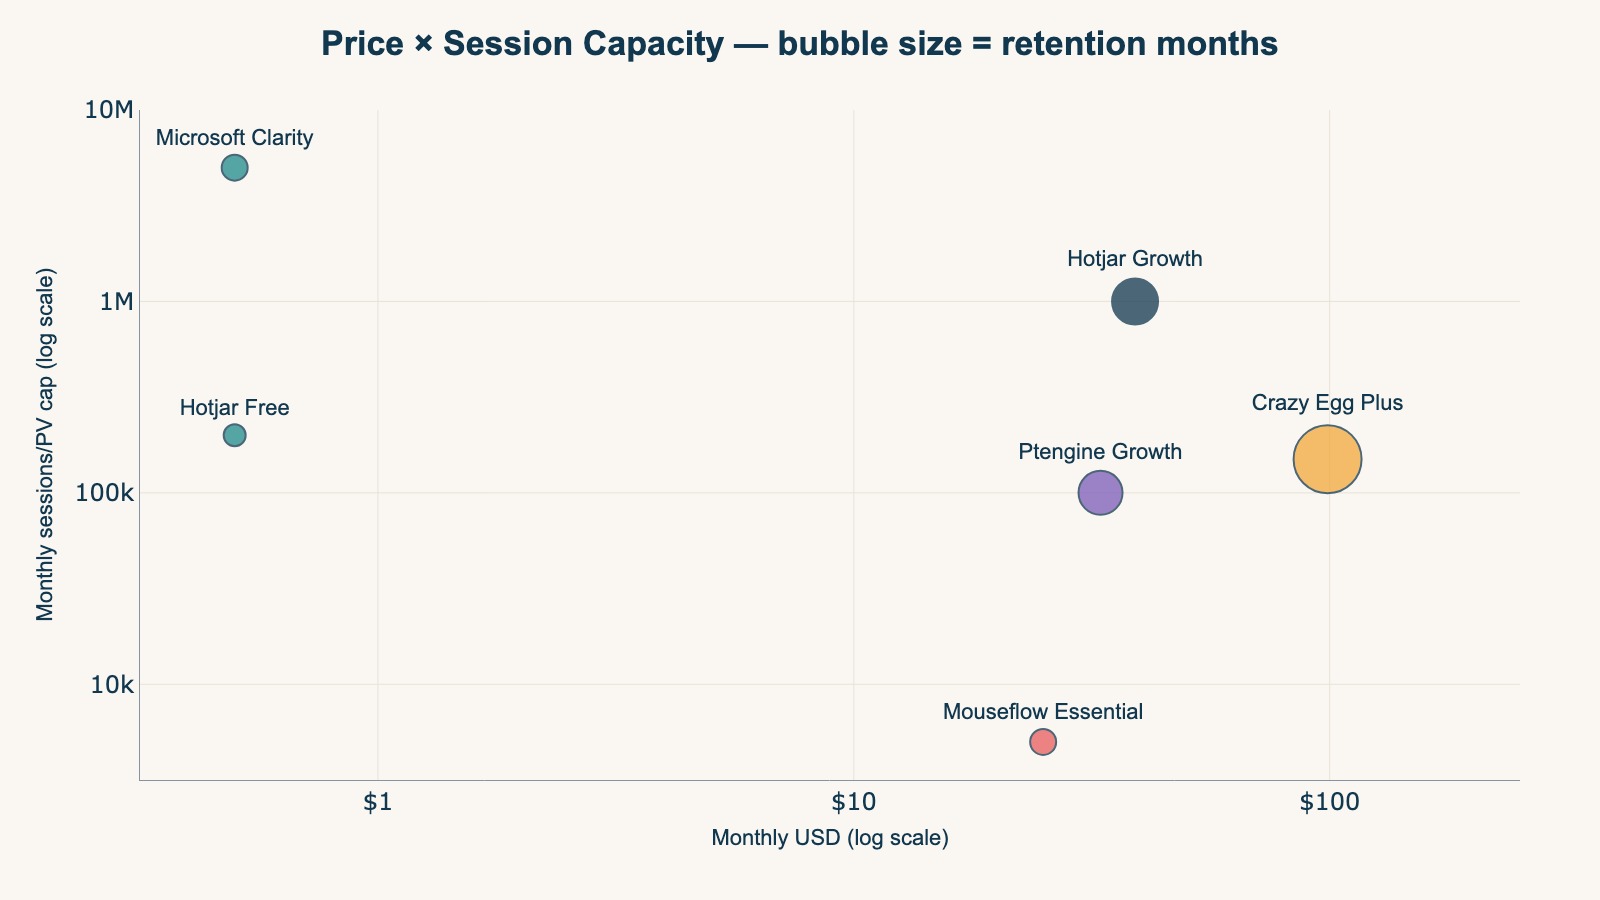
Which one you pick comes down to the job you need done. Lining up price against traffic capacity narrows it to a single tool for most sites.
| Your situation | Pick |
|---|---|
| Zero budget, traffic over 200k sessions/mo | Microsoft Clarity (free, unlimited) |
| Zero budget, ≤200k sessions, want surveys | Hotjar Free + Microsoft Clarity in parallel |
| Under $30/mo, fixing checkout drop-off | Mouseflow Essential ($25) |
| Under $100/mo, want A/B testing built in | Crazy Egg Plus ($99) |
| Want per-zone revenue analytics | Hotjar Pro (contact sales) |
| Japan-only operations, JP UI required | Ptengine Growth (from ¥4,980) |
Free tools like Microsoft Clarity and Hotjar Free already show in-page movement well enough. But whichever you pick, the in-page view is where these tools stop. How much revenue each traffic source produced is outside every one of them, free or paid.
3. The Limit All Five Share — Revenue by Channel#
Bottom line: the blind spot every one of the five shares is that they don't show revenue efficiency by traffic source. For budget allocation, this one job goes to a separate tool.
After comparing all five, the structural truth becomes obvious: every heatmap tool answers "what happened inside this page." None answers "which traffic source delivered the buyer."
| Axis | Heatmaps answer | Heatmaps don't answer |
|---|---|---|
| Spatial (in-page) | Where on the LP did users drop off? | — |
| Temporal (sequence) | How did the user navigate the flow? | — |
| Source (where from) | — | Which ad's visitors actually converted? |
Worth noting: even Hotjar Pro's "Zone-based Heatmaps with Revenue metrics" — the most advanced revenue feature in the category — measures revenue per page zone, not per traffic source. Google Ads ROAS, Meta Ads RPS, organic search AOV: none of them appear in a heatmap report[3]. Same word "Revenue," different axis.
The three metrics ecommerce ad-budget decisions actually depend on:
- AOV (Average Order Value) = Revenue / Orders
- RPS (Revenue Per Session) = Revenue / Sessions
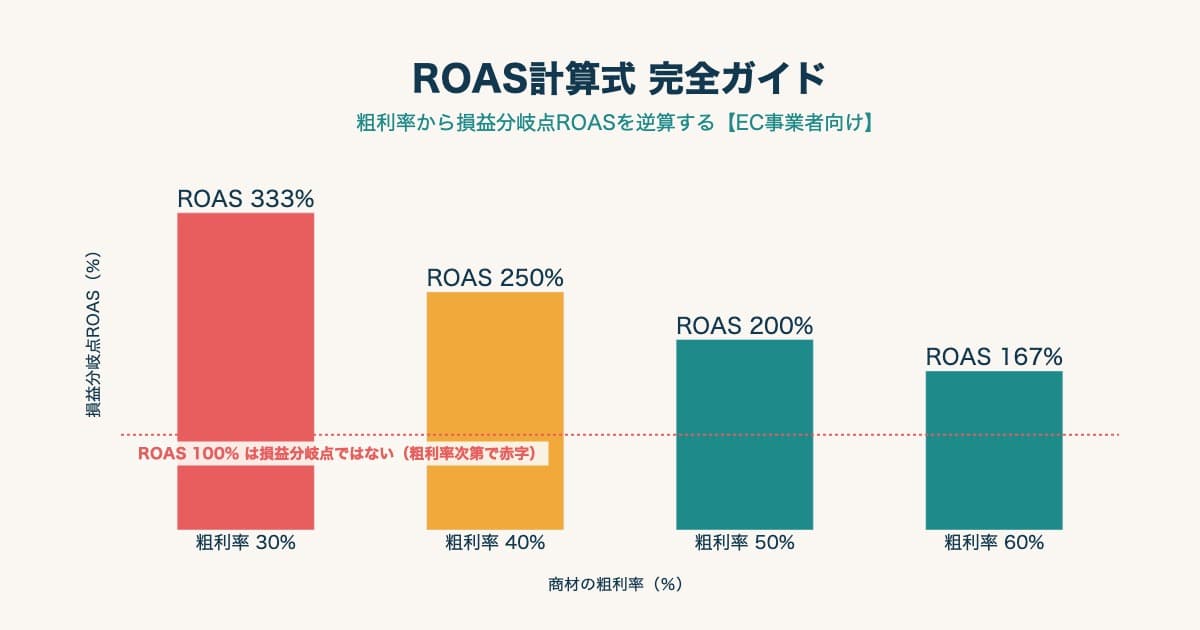
- ROAS (Return On Ad Spend) = Revenue / Ad Spend
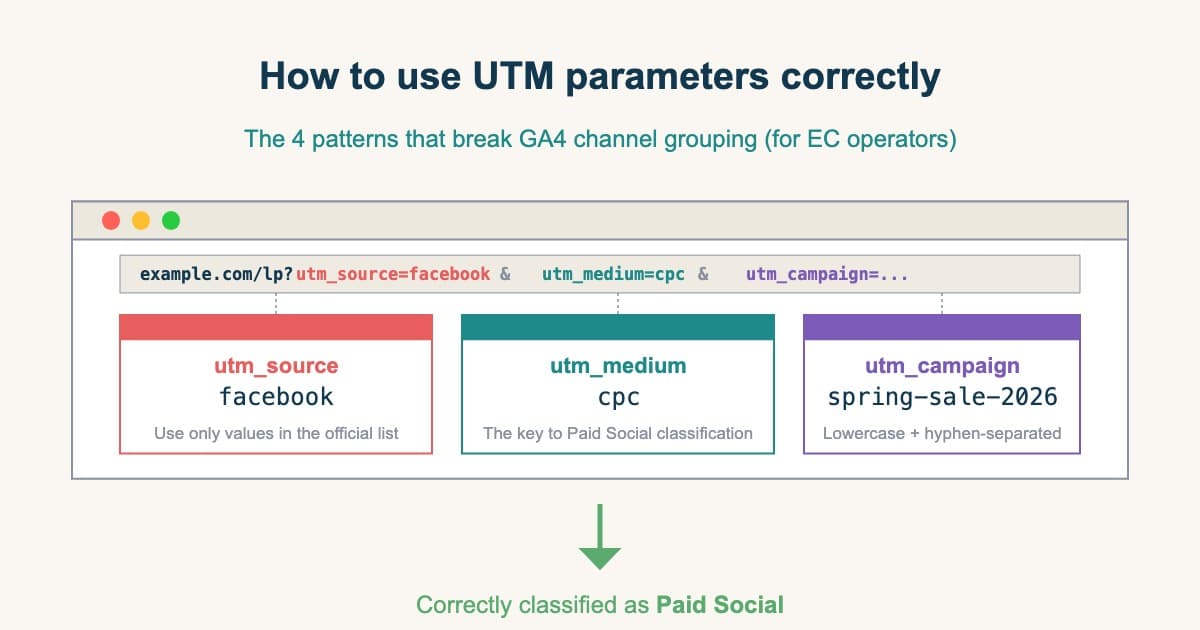
These are only decision-useful when broken down by channel, by UTM, by landing page. "Meta Ads sessions have an RPS of $1.50 vs. Google Search at $4.50" is the kind of comparison a heatmap will never produce. For how to read revenue efficiency by channel see the channel revenue view; for the ROAS basics see the complete ROAS guide.
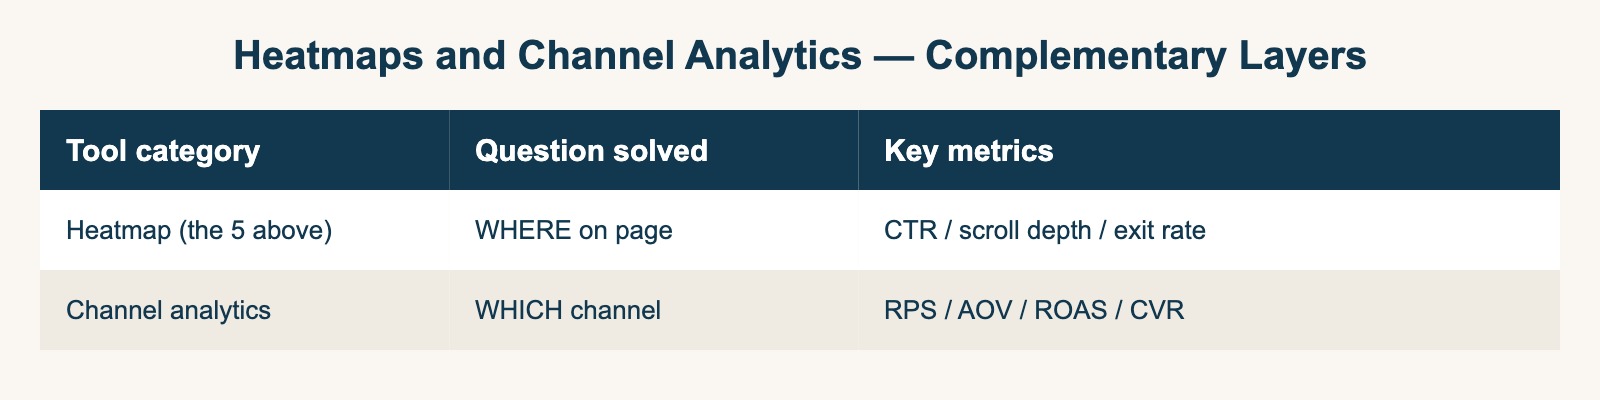
Moving a CTA up to cut LP drop-off by 30% is heatmap work. Killing Meta Ads to redirect spend into Google Ads and lifting overall ROAS from 180% to 240% is channel-analytics work. And which ad delivered the final push toward the sale changes with the model you choose — see the last-click trap. Both axes are needed; they just live in different tools.
RevenueScope solution
Bottom line: against the "in-page movement" a heatmap shows, RevenueScope shows "which traffic source generates how much revenue." The next budget-allocation move only becomes decidable here.
Even after you have chosen among the five tools, you hit the same wall last: the in-page fixes are visible, but the material for deciding which source to keep and which to cut never lands in your hands. Producing per-channel RPS, AOV, and ROAS means unifying UTMs, excluding bots, and normalizing every channel to the same conditions — a weekly preprocessing job. The concept is simple; keeping it up by hand is heavy work, and GA4's standard reports have no place for it structurally.
RevenueScope solves this. It lines up per-channel revenue, revenue per session (RPS), and sessions on one screen — alongside site-wide average order value (AOV) and conversion rate (CVR) — pairing the heatmap's "in-page" view with a "traffic-source" view. For sources with ad spend connected, it can also output measured ROAS and a budget-allocation draft (display uses demo data).
FAQ#
Q. Should I install Microsoft Clarity or Hotjar Free first?
A. Start with Microsoft Clarity. There is no traffic cap, no cost, and no expiration[1]. Add Hotjar Free later if you need surveys or MCP/LLM access[3].
Q. Does Hotjar Pro's "Zone-based Revenue" replace channel analytics?
A. No — different axes. Zone-based Revenue measures which page elements contribute to revenue, while channel analytics measures which traffic source delivered the buyer[3]. They complement each other; neither replaces the other.
Q. What is unique about Ptengine besides the Japanese UI?
A. Ptengine combines analytics ("Insight") with experimentation and personalization ("Experience") on a single platform[6]. Western tools typically split this into separate products. The trade-off: PV-based metering means your effective cost depends on average pages-per-session.
Q. Should I install all five?
A. You'll drown in duplicated data and tool fatigue. The realistic stack: Microsoft Clarity (always on, free) + one goal-driven paid tool + one channel analytics layer is the working combination for most ecommerce teams.
Wrap-up#
- Free tier — Microsoft Clarity (unlimited, long retention) vs. Hotjar Free (200k cap, surveys included)
- Paid tier — goal-driven choice: per-zone revenue = Hotjar Pro, A/B testing = Crazy Egg, form analytics = Mouseflow
- Ptengine wins for Japan-local teams needing native-language UI and a unified analytics + experimentation platform
- The shared blind spot — channel-level revenue requires a separate analytics layer; heatmaps and channel analytics are complementary
Use the heatmap for "where," channel analytics for "where from." Only with both axes in place does ecommerce revenue improve with any repeatability.
See which ads actually drive revenue, at a glance
Free up to 5,000 sessions/month, AI connection included. No credit card required. Up and running in 5 minutes.
References#
- [1] Microsoft "Microsoft Clarity Official Site" (2026)
- [2] Hotjar "Hotjar is now part of the Contentsquare group" (2026)
- [3] Contentsquare "Hotjar Pricing — Experience Analytics plans" (2026)
- [4] Crazy Egg "Pricing — Starter / Plus / Pro / Enterprise" (2026)
- [5] Mouseflow "Pricing — Free / Essential / Advanced / Premium / Enterprise" (2026)
- [6] Ptengine "Pricing — Free / Growth / Premium" (2026)
- [7] ITreview "Ptengine pricing data" (2026)