The one page where you report each month's revenue to management or your boss. Try to fit every number you can see, and it lands less, not more. Leadership isn't after a list of metrics — they want answers to three questions: "did we profit," "what worked," and "what's next." This guide walks through what to put on a normal month's one-page revenue report, and what to cut.
This article is written from the reporter's side — the marketing or ecommerce person who hands numbers to leadership. How to pick the metrics you track day to day is covered in the five KPIs to track in ecommerce; the screen you watch daily is in revenue dashboard design; the special review right after a sale is in the post-sale revenue review. Separate from those, this article focuses on the single page you hand leadership for a normal month.
Table of Contents
TL;DR#
-
Leadership wants answers to three questions, not a list of metrics
Did we profit / what worked / what's next. Any number that answers none of these doesn't belong on the page
-
For "did we profit," show RPS quality and the period comparison, not just total revenue
Adding revenue per session (RPS) and period-over-period lets you separate "sold a lot" from "made money"
-
"What worked" only becomes visible split by channel
Average everything and the channels that worked blend with the ones that didn't, so you can't decide the next move
-
A page that doesn't land is usually too many metrics, no comparison, totals only, or bot inflation
The idea is simple; what's heavy is aligning numbers across channels every month, computing the comparison, and folding it onto one page
1. Why more metrics land less#
What management and your boss want from a report isn't a list of metrics. It's the answers to three questions: did we profit, what worked, and what do we do next.
When you build a monthly report, it's tempting to load every number you can see — impressions, clicks, video views. Lining them up at least looks thorough. But the more numbers you add, the more those three answers get buried inside them and fail to land.
The trouble is that organizations often haven't decided upfront what counts as success. With no agreement, the report drifts into impressions, clicks, and video views lined up just because they're there. And the people who never open a dashboard are often the ones with the strongest opinions about color palettes and KPI definitions. Sometimes the boss wants viral, eye-catching numbers that don't match the real result at all.
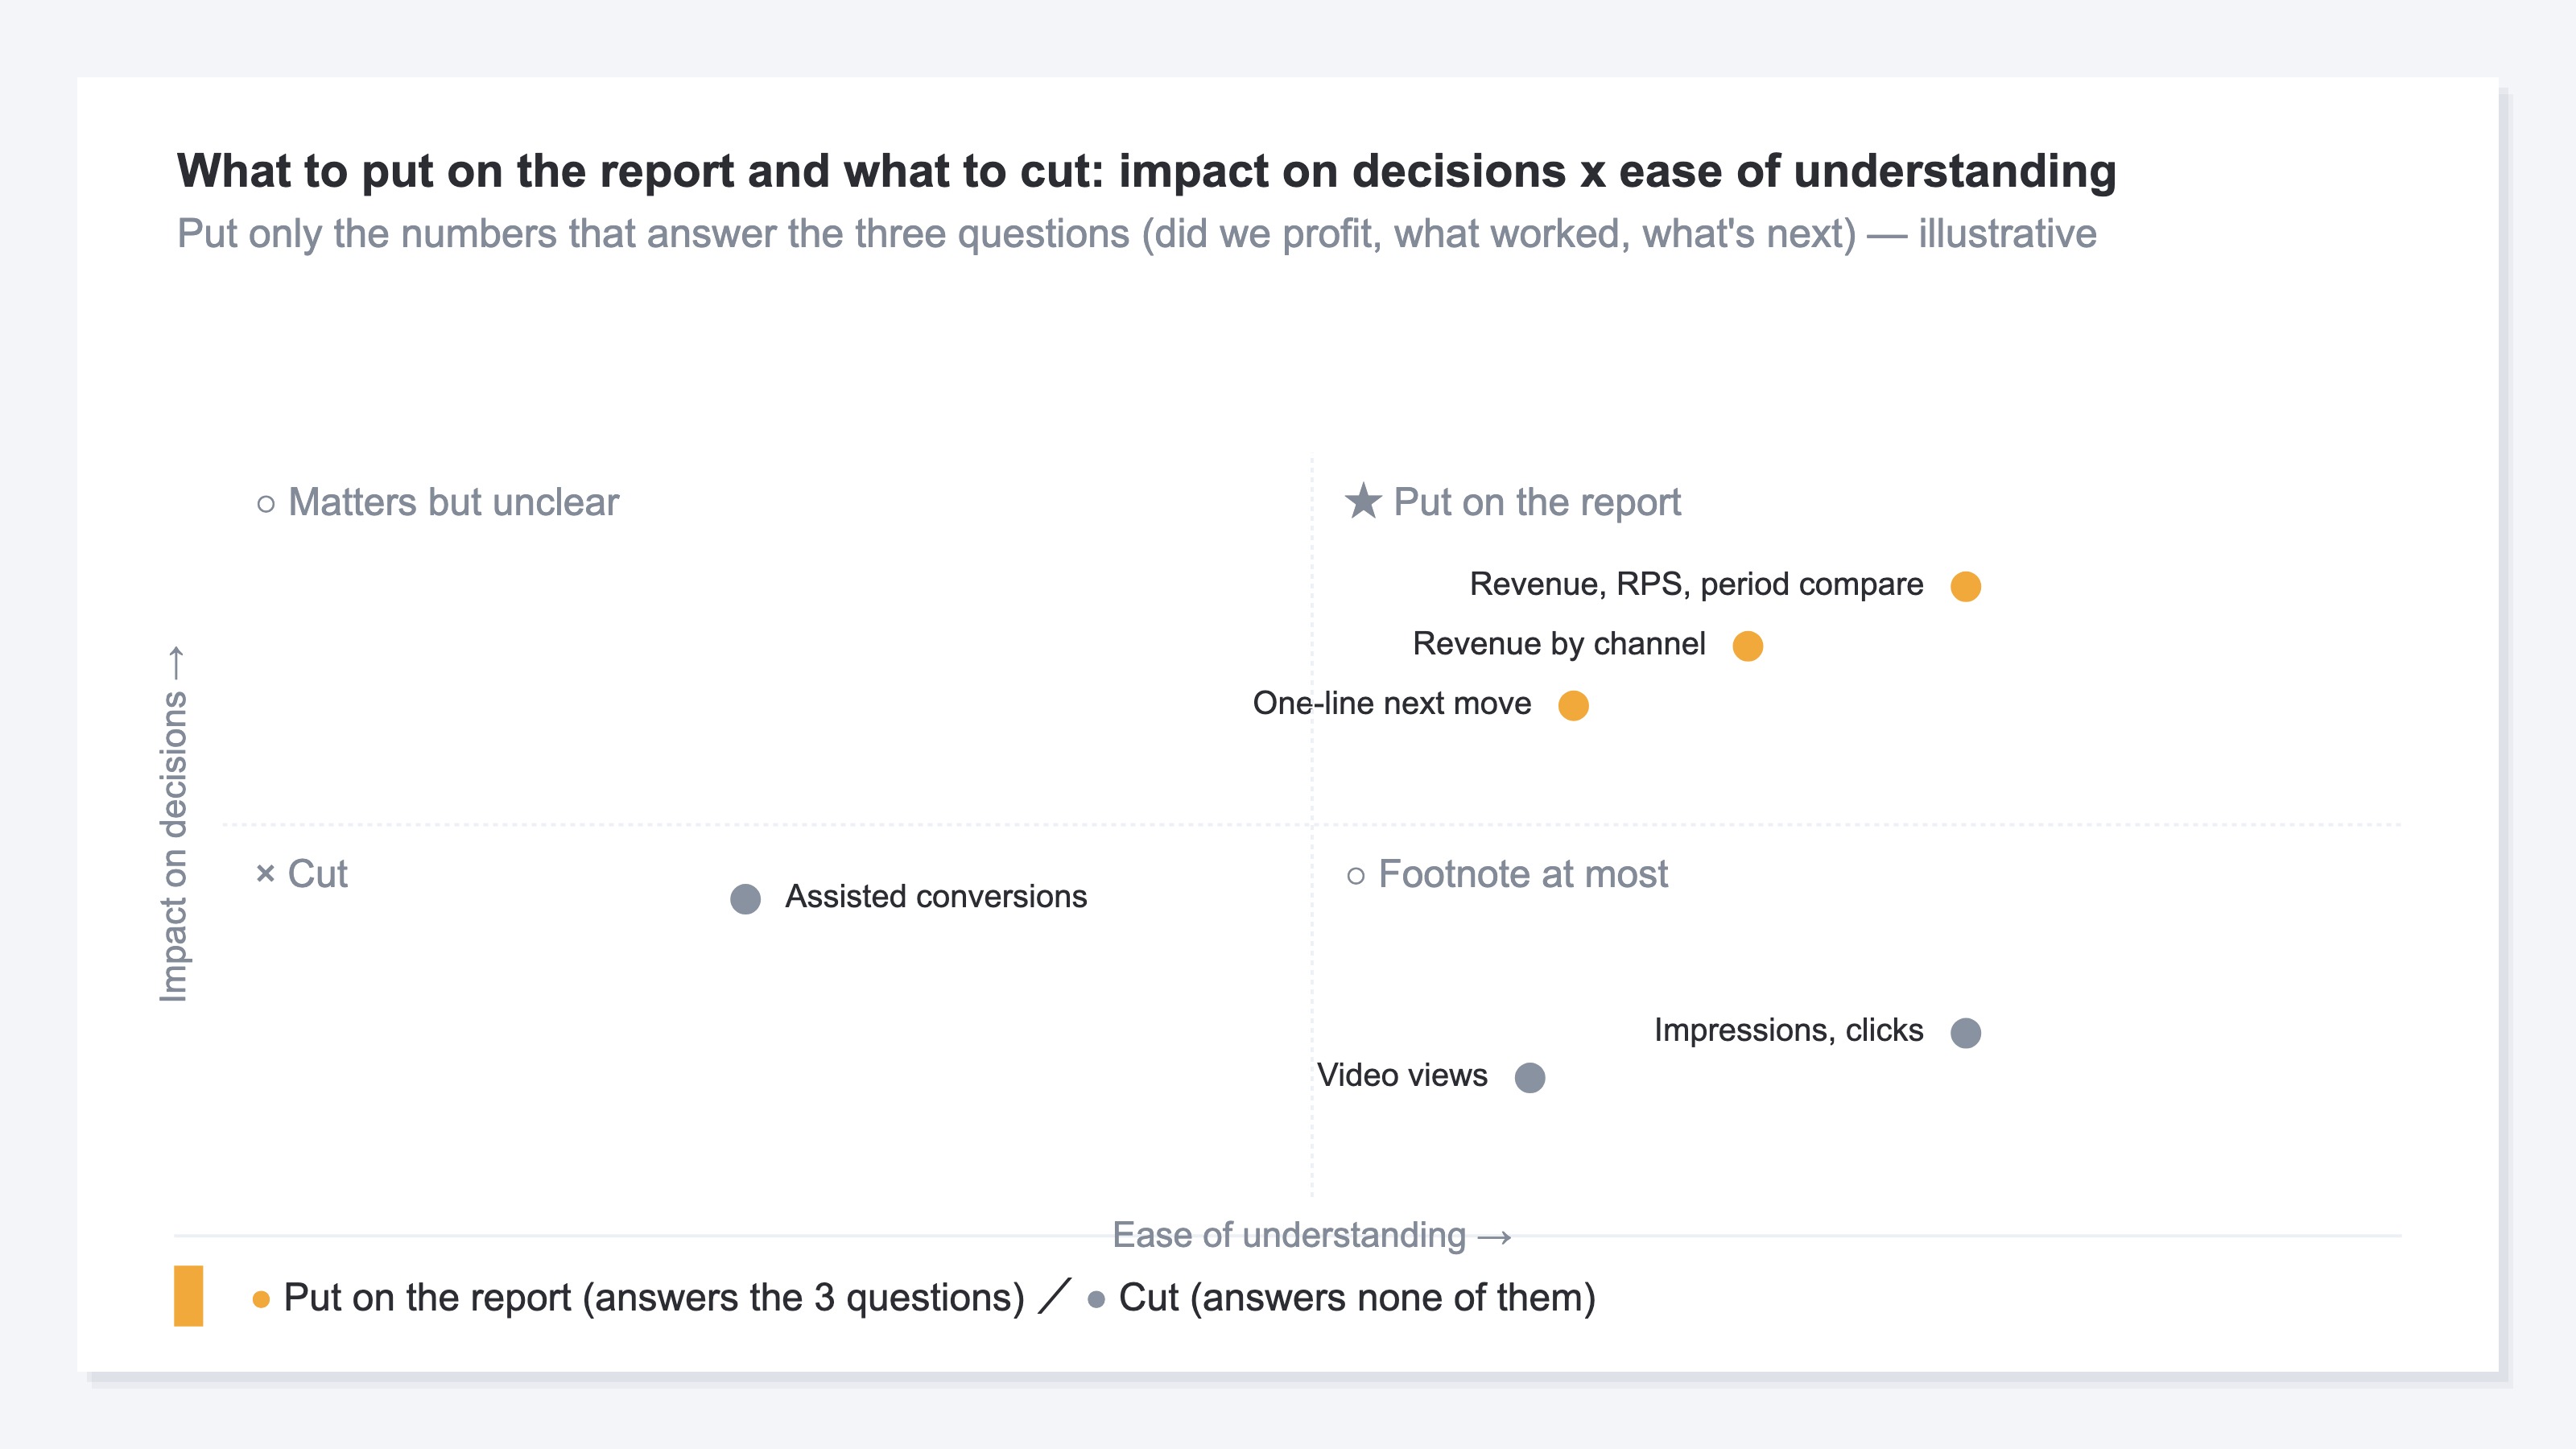
So when you build the page, before "what to put on it," ask "which of the three questions does this number answer?" Any number that answers none of them gets cut. Has lining up metrics become the goal itself? The starting point of a report is always that one re-check.
2. The three questions and numbers to put on the page#
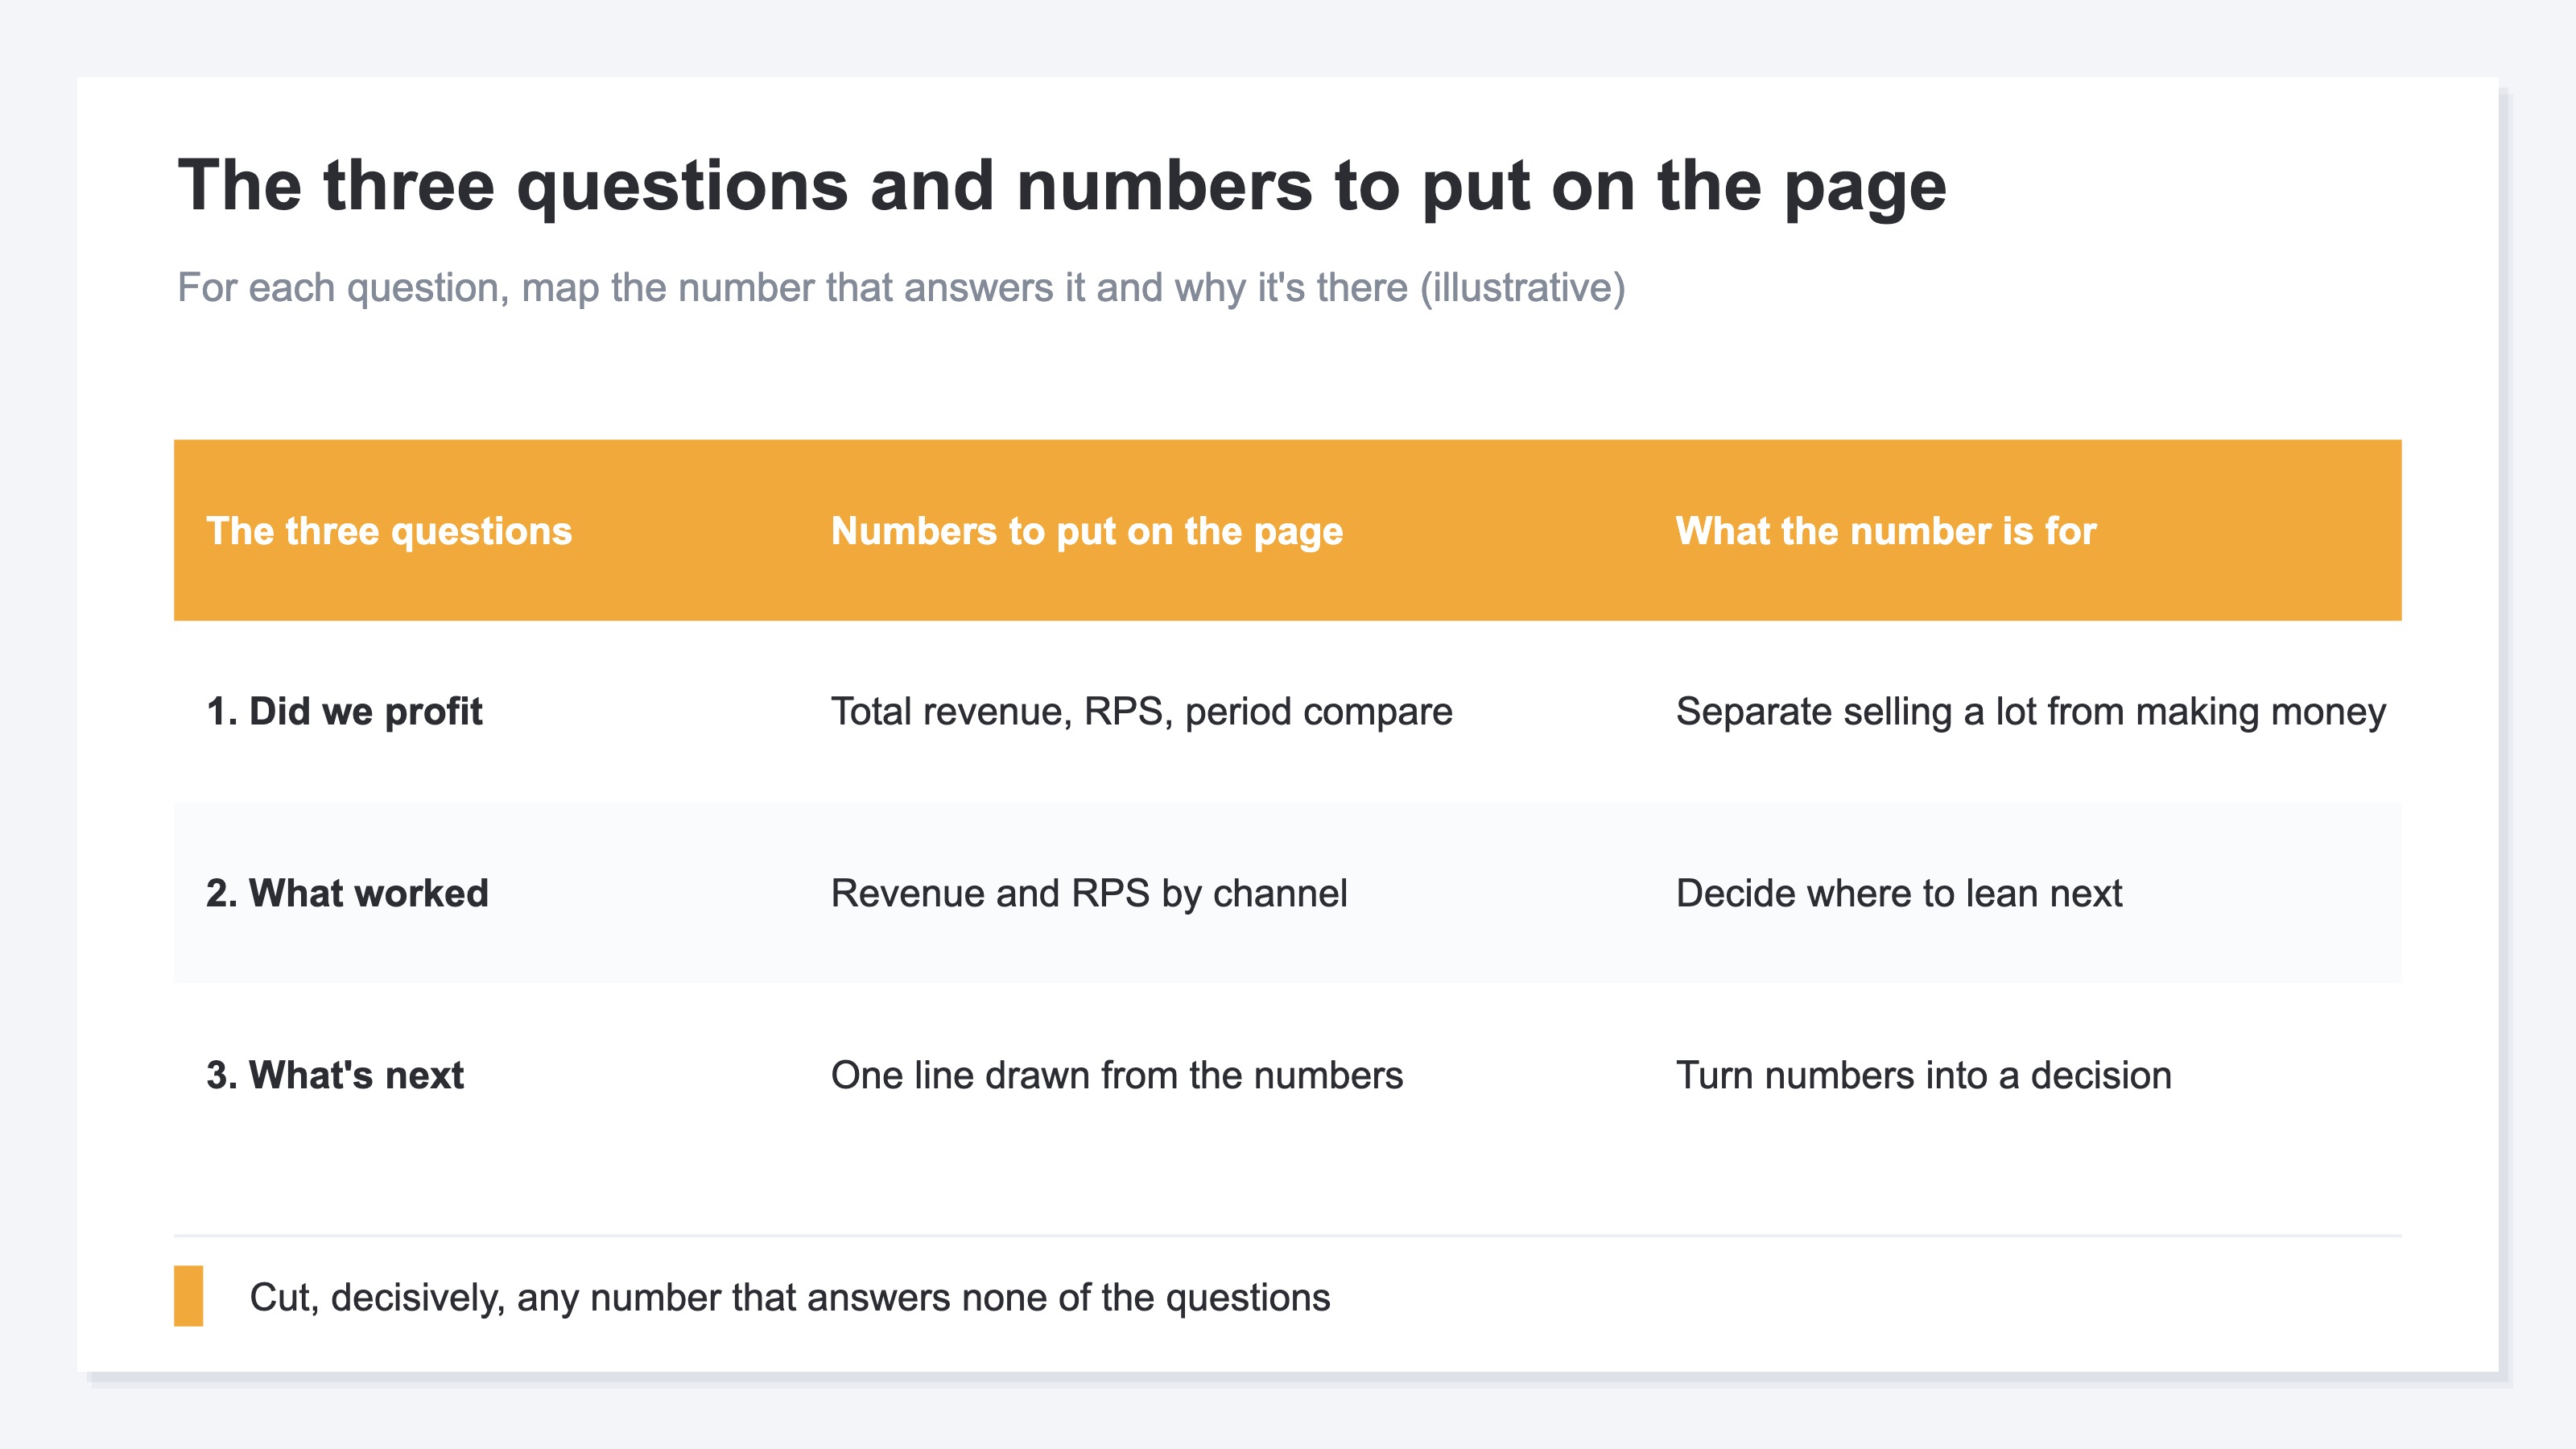
Put only the numbers that answer each of the three questions: ① did we profit, ② what worked, ③ what's next. Narrow it to these three.
① Did we profit can't be answered by total revenue alone, because total revenue rises easily with discounts and volume. So add revenue per session (RPS). RPS reflects "how efficiently you turned the visits[2] you gathered into sales." Then add the period comparison — that is, the change versus "the immediately preceding period of the same length." Total, RPS, and the comparison together let you show "sold a lot" apart from "made money."
② What worked is shown split by channel[1]. Newsletter, search, ads — split which traffic made the revenue, and leadership can judge where to lean next. The grand total alone hides this.
③ What's next gets one line under the numbers. Write the move you drew from the numbers, briefly — like "raise newsletter frequency next month." Don't end at explaining the numbers; this one line connects them to a decision.
3. Four common mistakes#
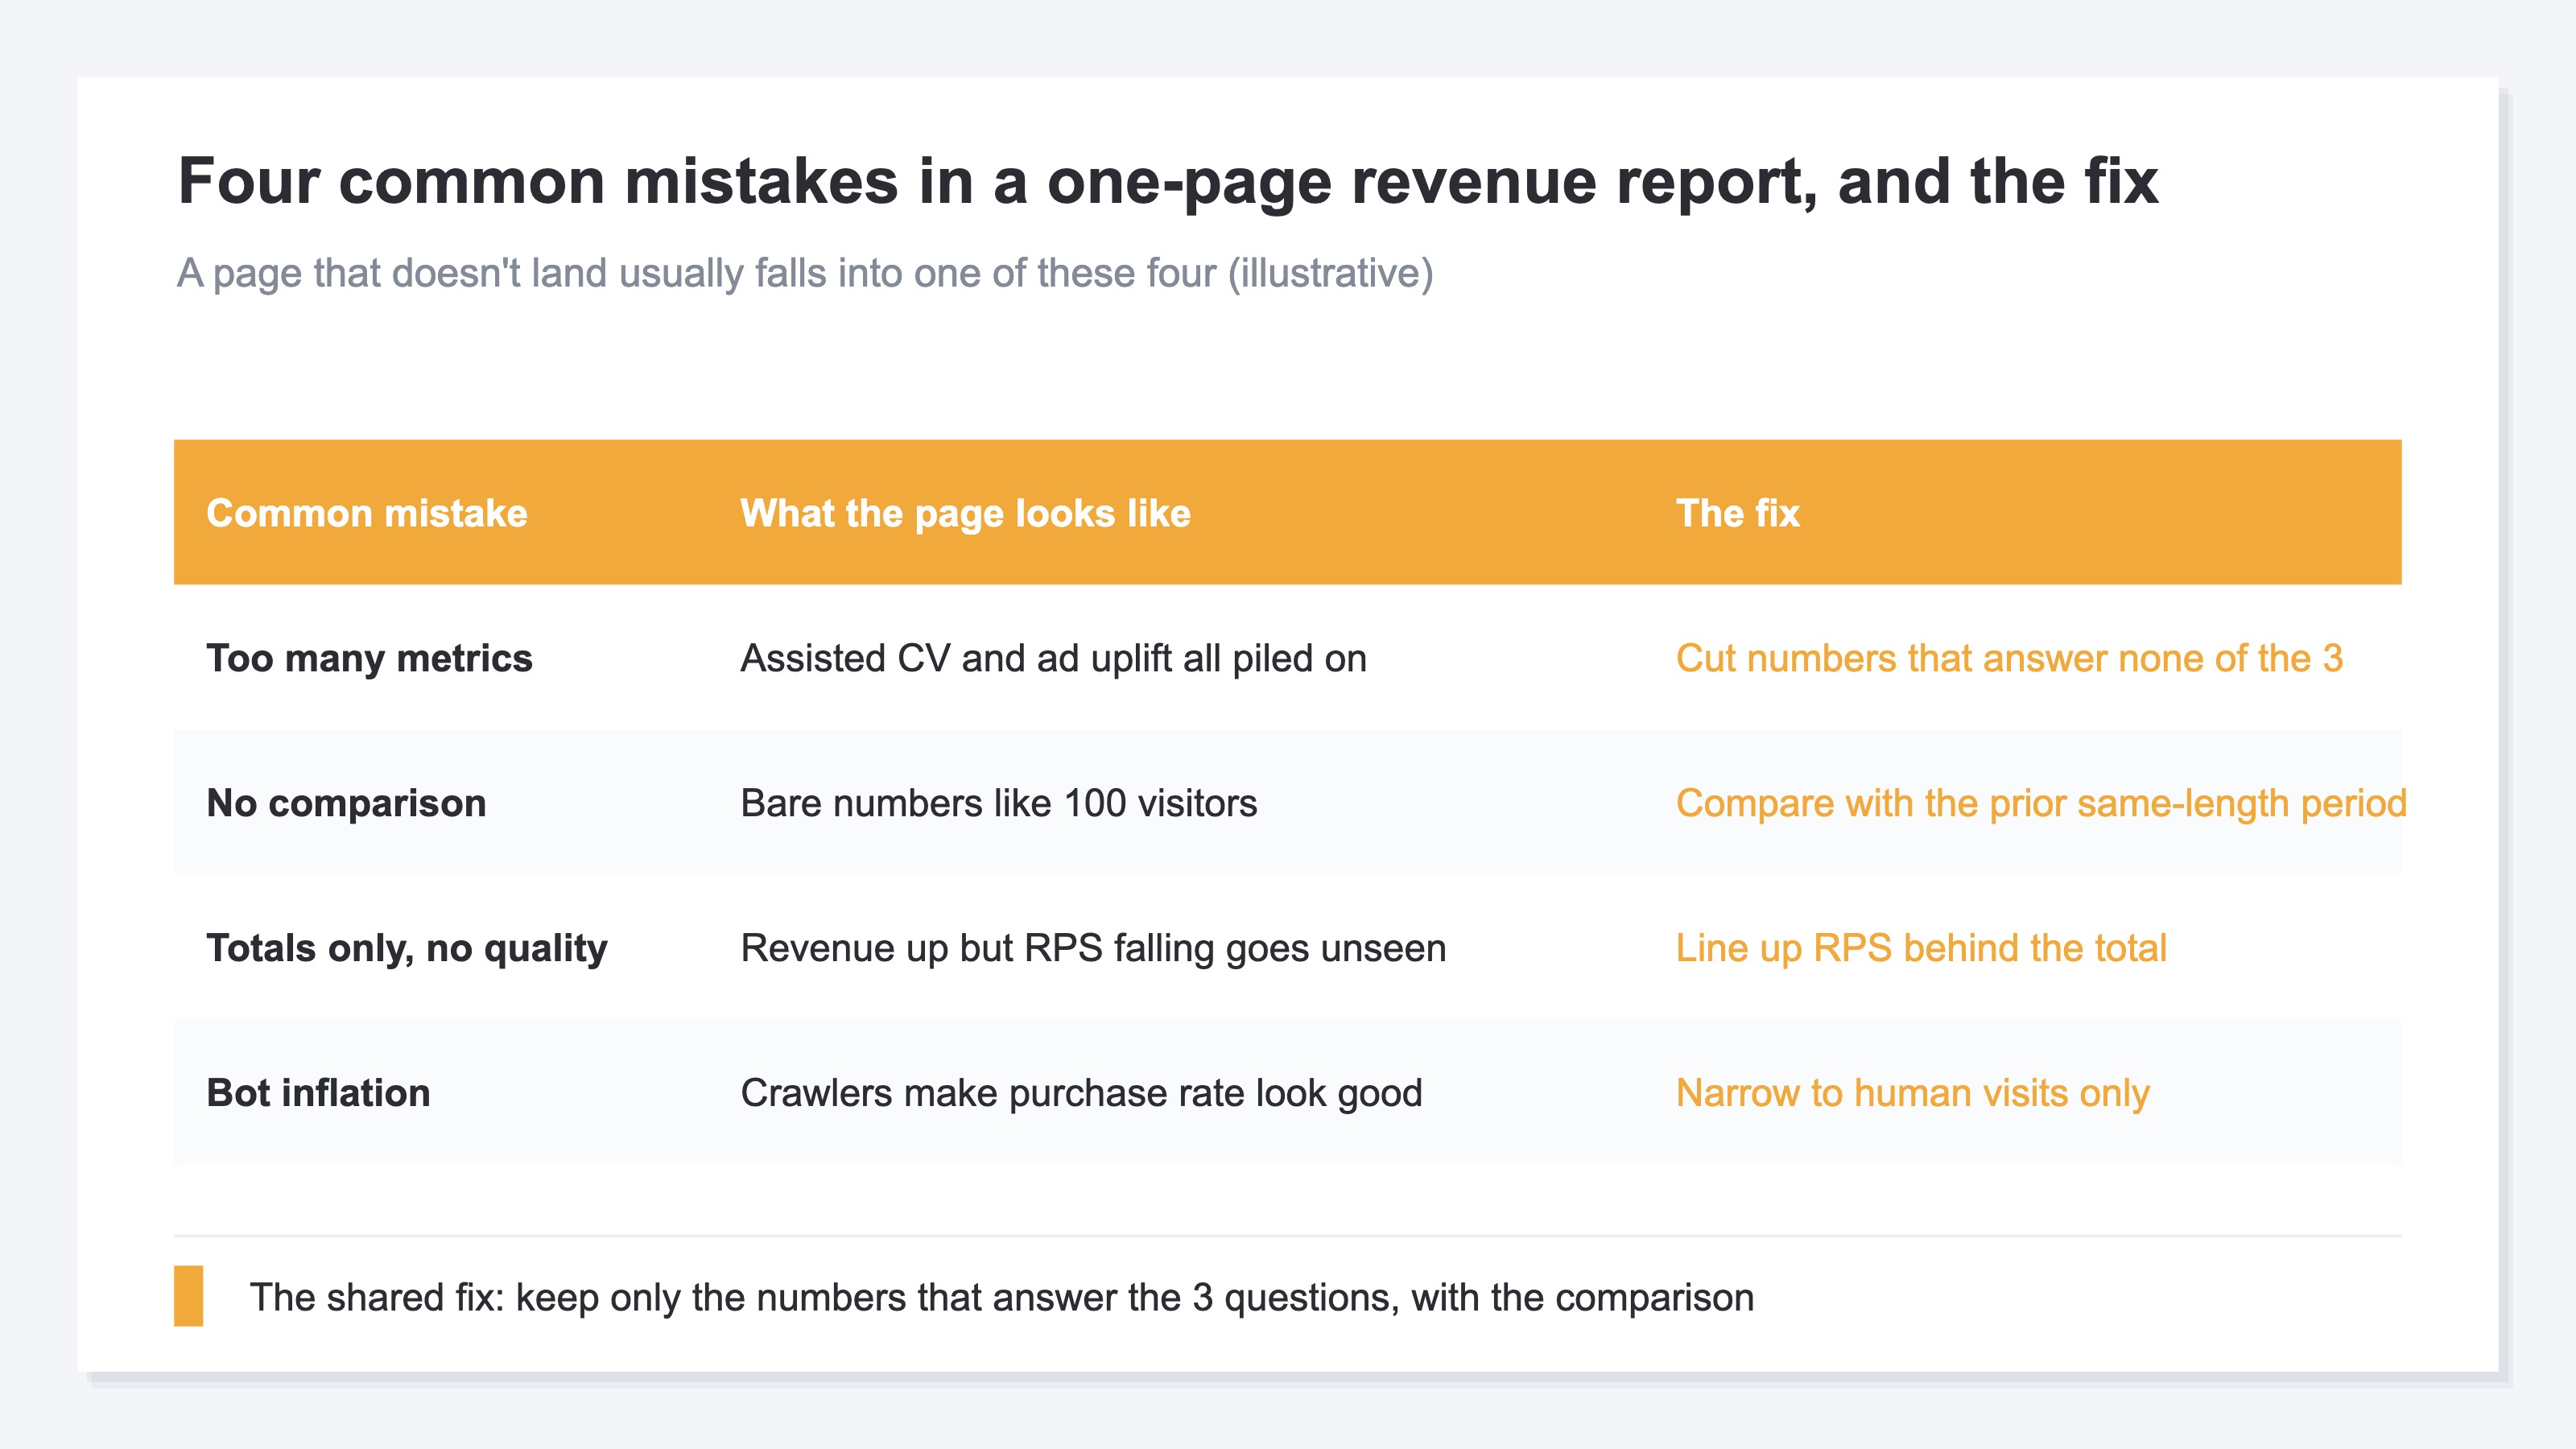
When a page doesn't land, it usually falls into one of these four mistakes.
The first is too many metrics. Load everything — assisted conversions, tests of the extra revenue an ad drove — and it gets harder to follow, not easier. Cutting the numbers that answer none of the three questions takes nerve.
The second is no comparison. A single line of "traffic: 100 people" gives no basis at all for whether that's good or bad versus last month. Numbers shouldn't go out bare; only with a period comparison do they mean something.
The third is totals only, ignoring quality. Even when total revenue rises, if RPS has fallen you may be in a "sold a lot but didn't profit" state. Check with RPS whether efficiency dropped behind the total.
The fourth is bot inflation. When automated crawler traffic mixes in, both visits and revenue look bigger. Unless the numbers are narrowed to human visits, behavior metrics like purchase rate (CVR)[3] look better than reality.
4. Why aligning it every month is heavy#
The idea of narrowing to three questions isn't hard. What's truly heavy is aligning it every month, across channels, by hand.
You look at total revenue in GA4, open the per-channel breakdown on another screen, copy it into Excel and compute the comparison. Remove duplicate visits, smooth out bot intrusion, and finally fold it onto one page. You repeat this every month, the same way.
The catch is that the screens don't count numbers the same way. Even the same "spend" can have fourteen different definitions across the org, counted differently by different teams. Channel classifications differ screen to screen too. So the aligning work gets heavier — and more error-prone — the more times you repeat it.
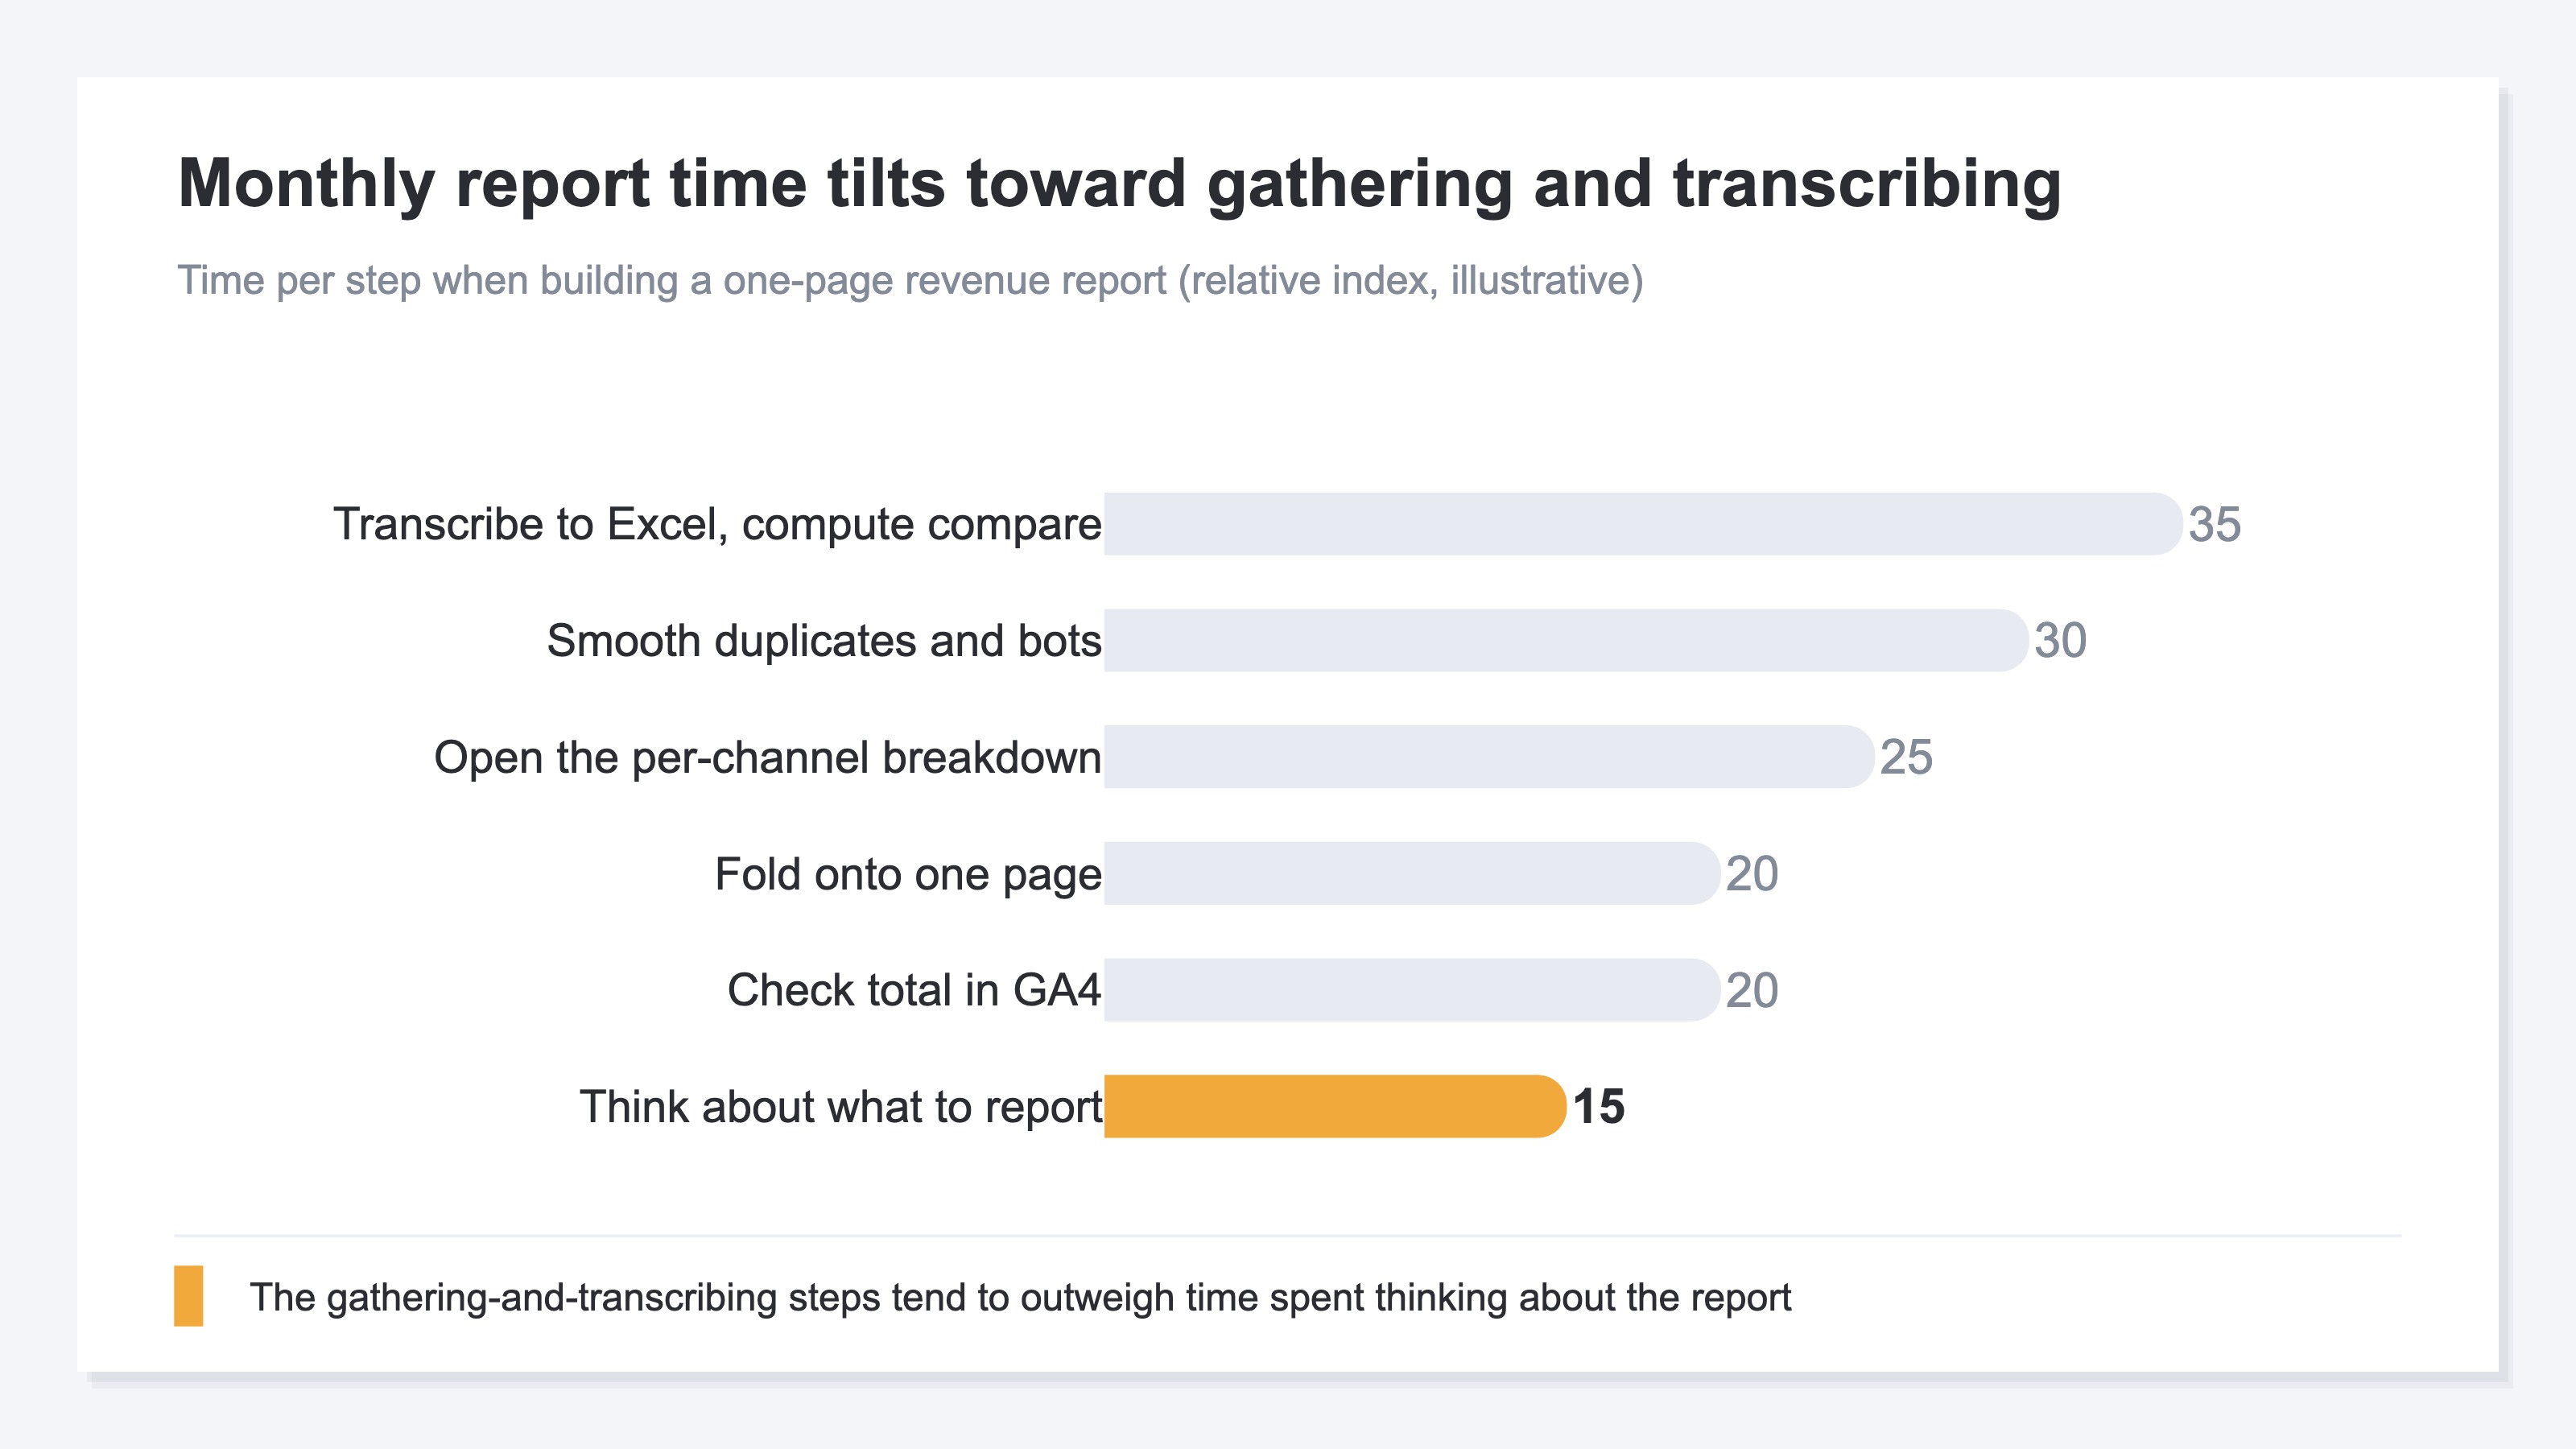
When gathering and transcribing numbers takes longer than thinking about what the report says, that's the real reason monthly reporting becomes a chore.
RevenueScope solution
That the report doesn't land, and that the monthly work is heavy, trace back to the same thing: there's usually no place at hand to line up the numbers that answer the three questions across channels, on the same basis, on a single page. GA4 can compare totals across periods, but aligning per-channel RPS and the comparison, with duplicates removed, on one screen, becomes a structural hand-rebuild.
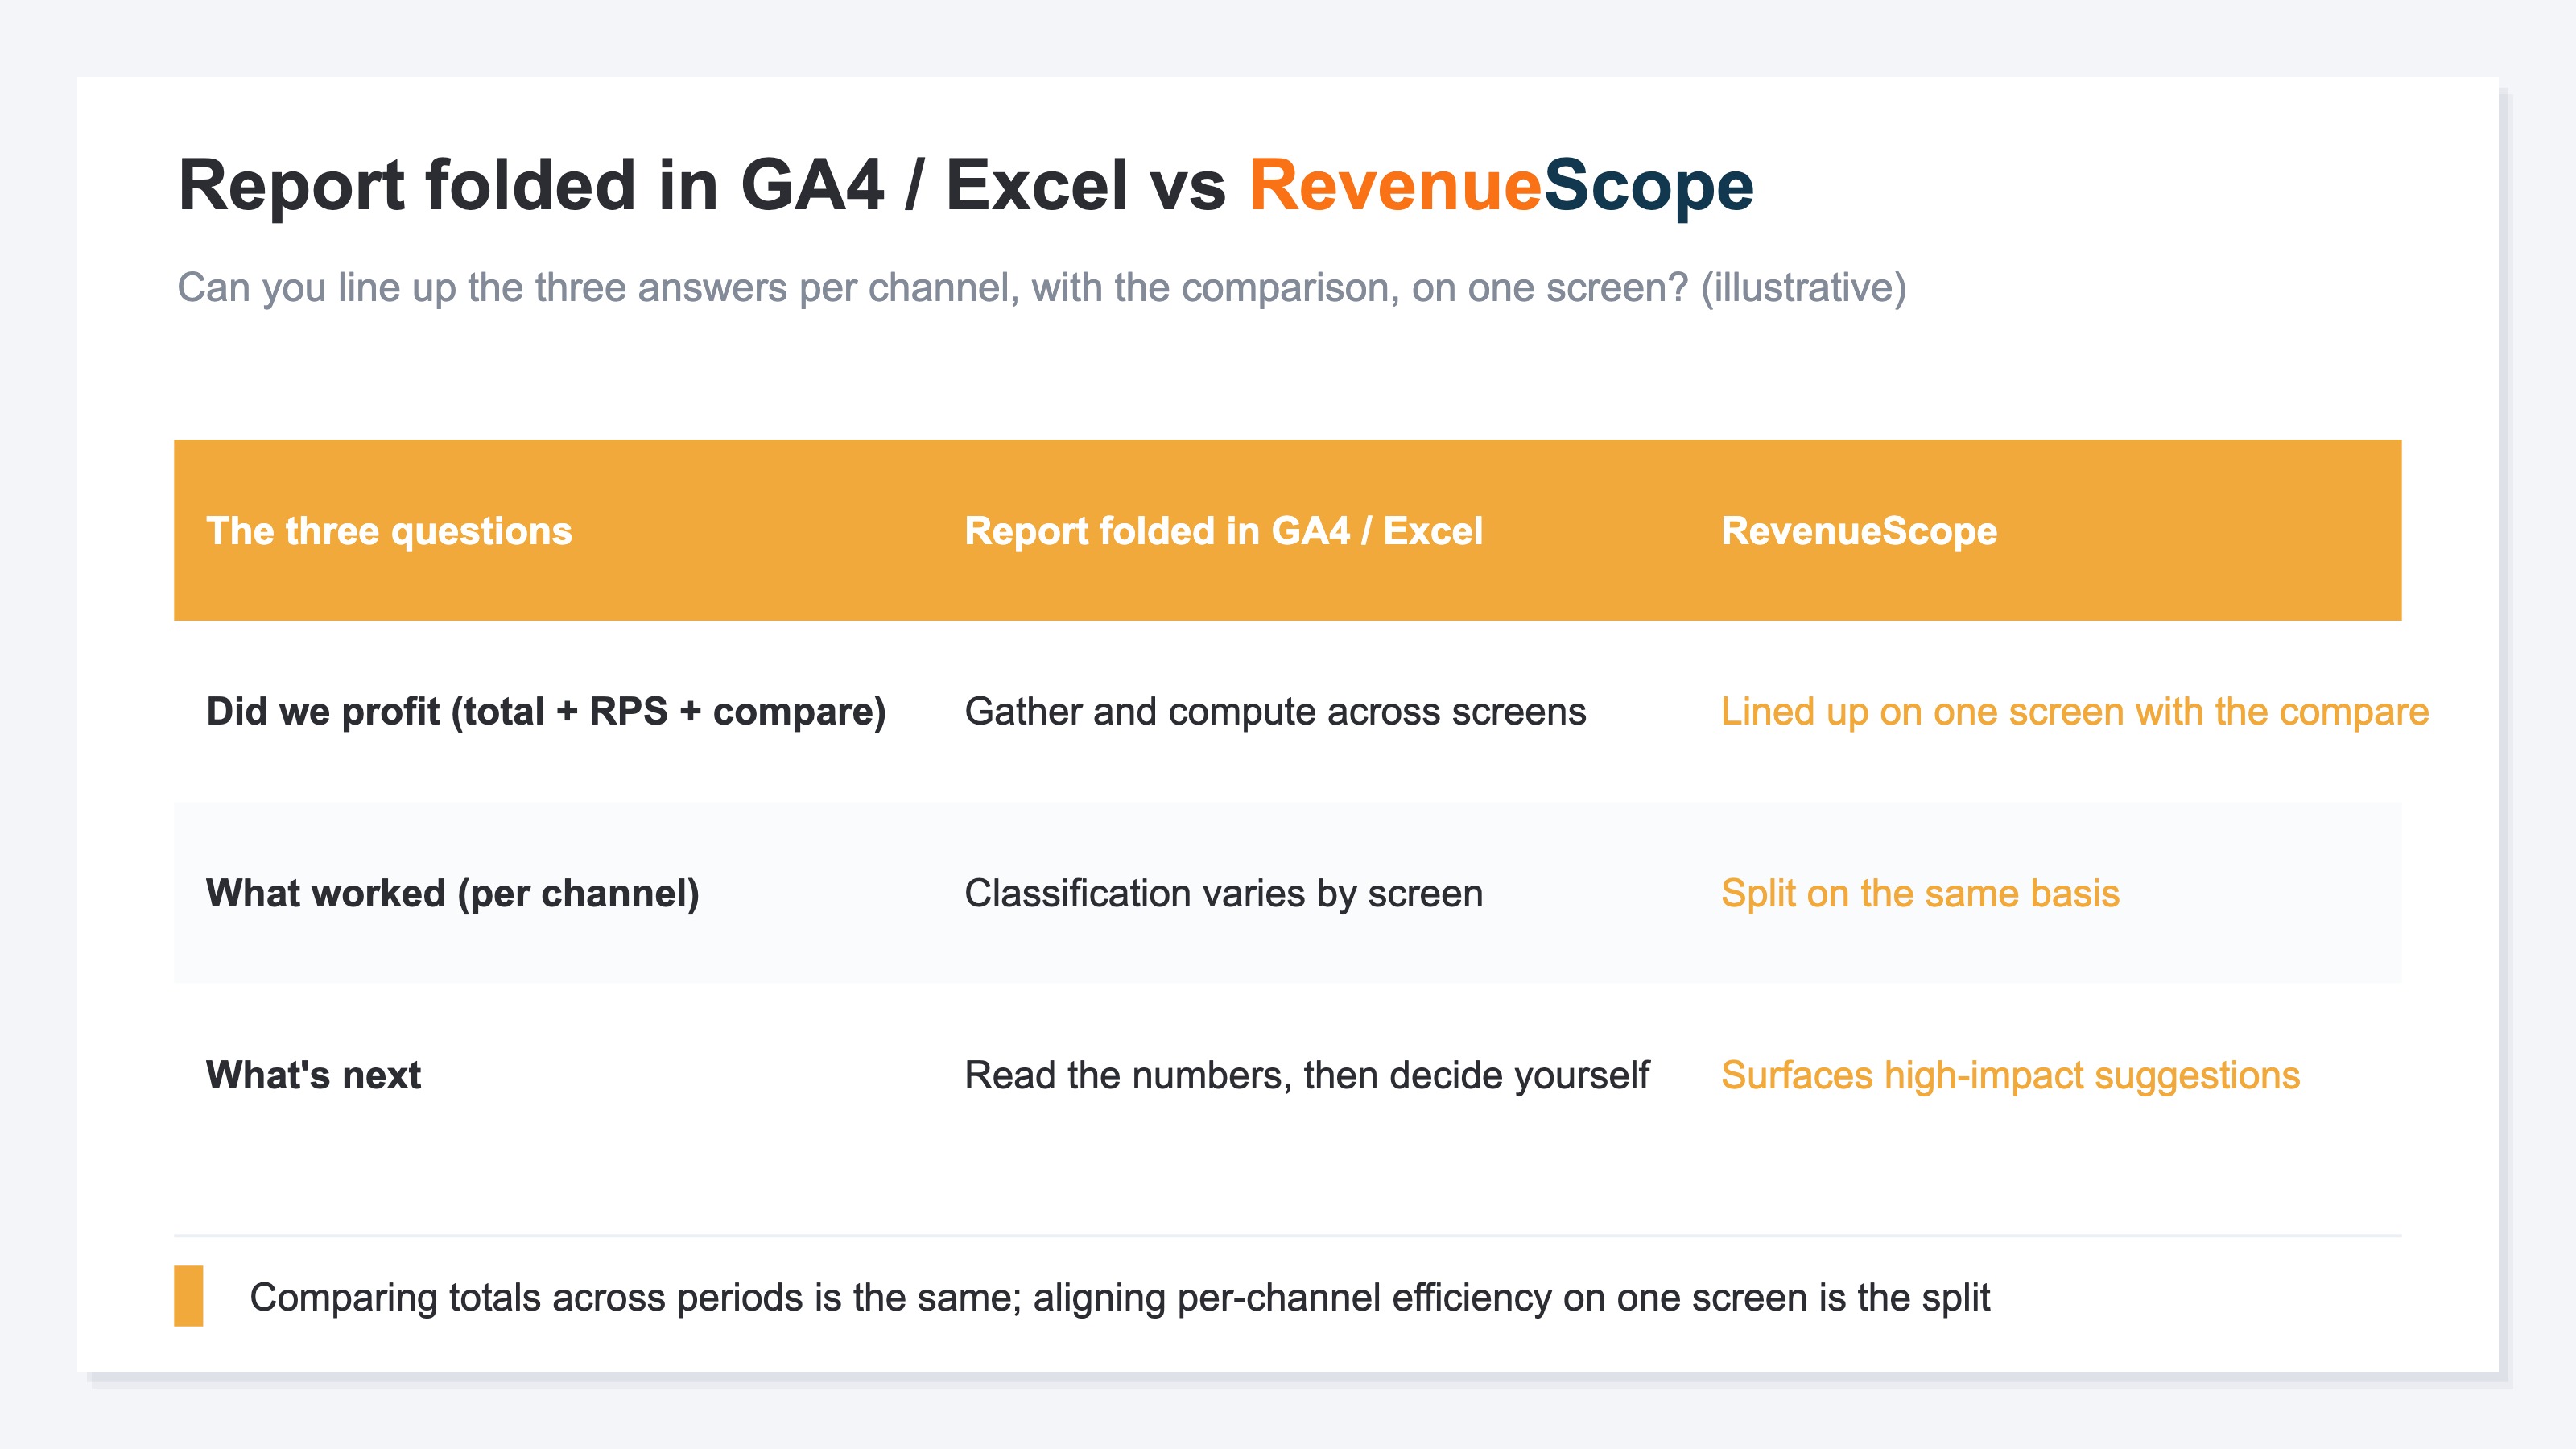
RevenueScope lines up the answers to the three questions on one screen, rooted in numbers with duplicates removed by its own tracking. For ① did we profit, revenue, RPS, average order value (AOV), and purchase rate (CVR) line up with the period comparison. For ② what worked, you see it in revenue and RPS split by channel. For ③ what's next, it surfaces "what to do this week" in order of revenue impact. These are high-priority suggestions — not a guarantee of results.
In short, RevenueScope isn't a tool that writes the report's numbers for you. It's the place that lines up the answers to the three questions leadership wants — per channel, with the period comparison — on one screen, taking over the monthly repetition of transcribing. Less time gathering means more time for thinking about "what's next." If you want to go deeper on RPS or per-channel numbers, also read how to read RPS (revenue per session), how to review per-channel efficiency, and how to find the cause with KPIs when revenue drops.
FAQ#
Frequently asked questions#
Q. How many metrics should a one-page report for leadership have in the end?
A. Rather than deciding by count, choose by "which of the three questions does this answer?" Did we profit, what worked, what's next. Cut anything that answers none. The result usually settles into a few: total and RPS with the comparison, the per-channel split, and a one-line move.
Q. What is the period comparison measured against?
A. It's the change versus the immediately preceding period of the same length. For this month (30 days), compare against the prior 30 days. Without matching the length, a difference in days alone creates a swing, and you can't read good or bad correctly. Note that the change in purchase rate (CVR) is read most accurately in percentage points (pp), not as a percent increase.
Q. My numbers don't match GA4 — which one is right?
A. Neither is wrong; they don't match because the measurement paths differ. GA4 and first-party tracking count revenue through separate systems. In a report, decide upfront which number is your basis and align it every month. If the basis drifts, the period comparison itself stops being reliable.
Summary#
A one-page revenue report for management or your boss lands less the more metrics you line up. Leadership isn't after a list of numbers — they want the answers to three questions: did we profit, what worked, and what do we do next.
Show "did we profit" with RPS quality and the period comparison, not just total revenue. Show "what worked" split by channel. Put "what's next" in one line under the numbers. Cut, decisively, any number that answers none of the three. Avoid the mistakes — too many metrics, no comparison, totals only, bot inflation — and decide next month's move by the numbers, not by gut feel.
See which ads actually drive revenue, at a glance
Free up to 5,000 sessions/month, AI analyst included. No credit card required. Up and running in 5 minutes.