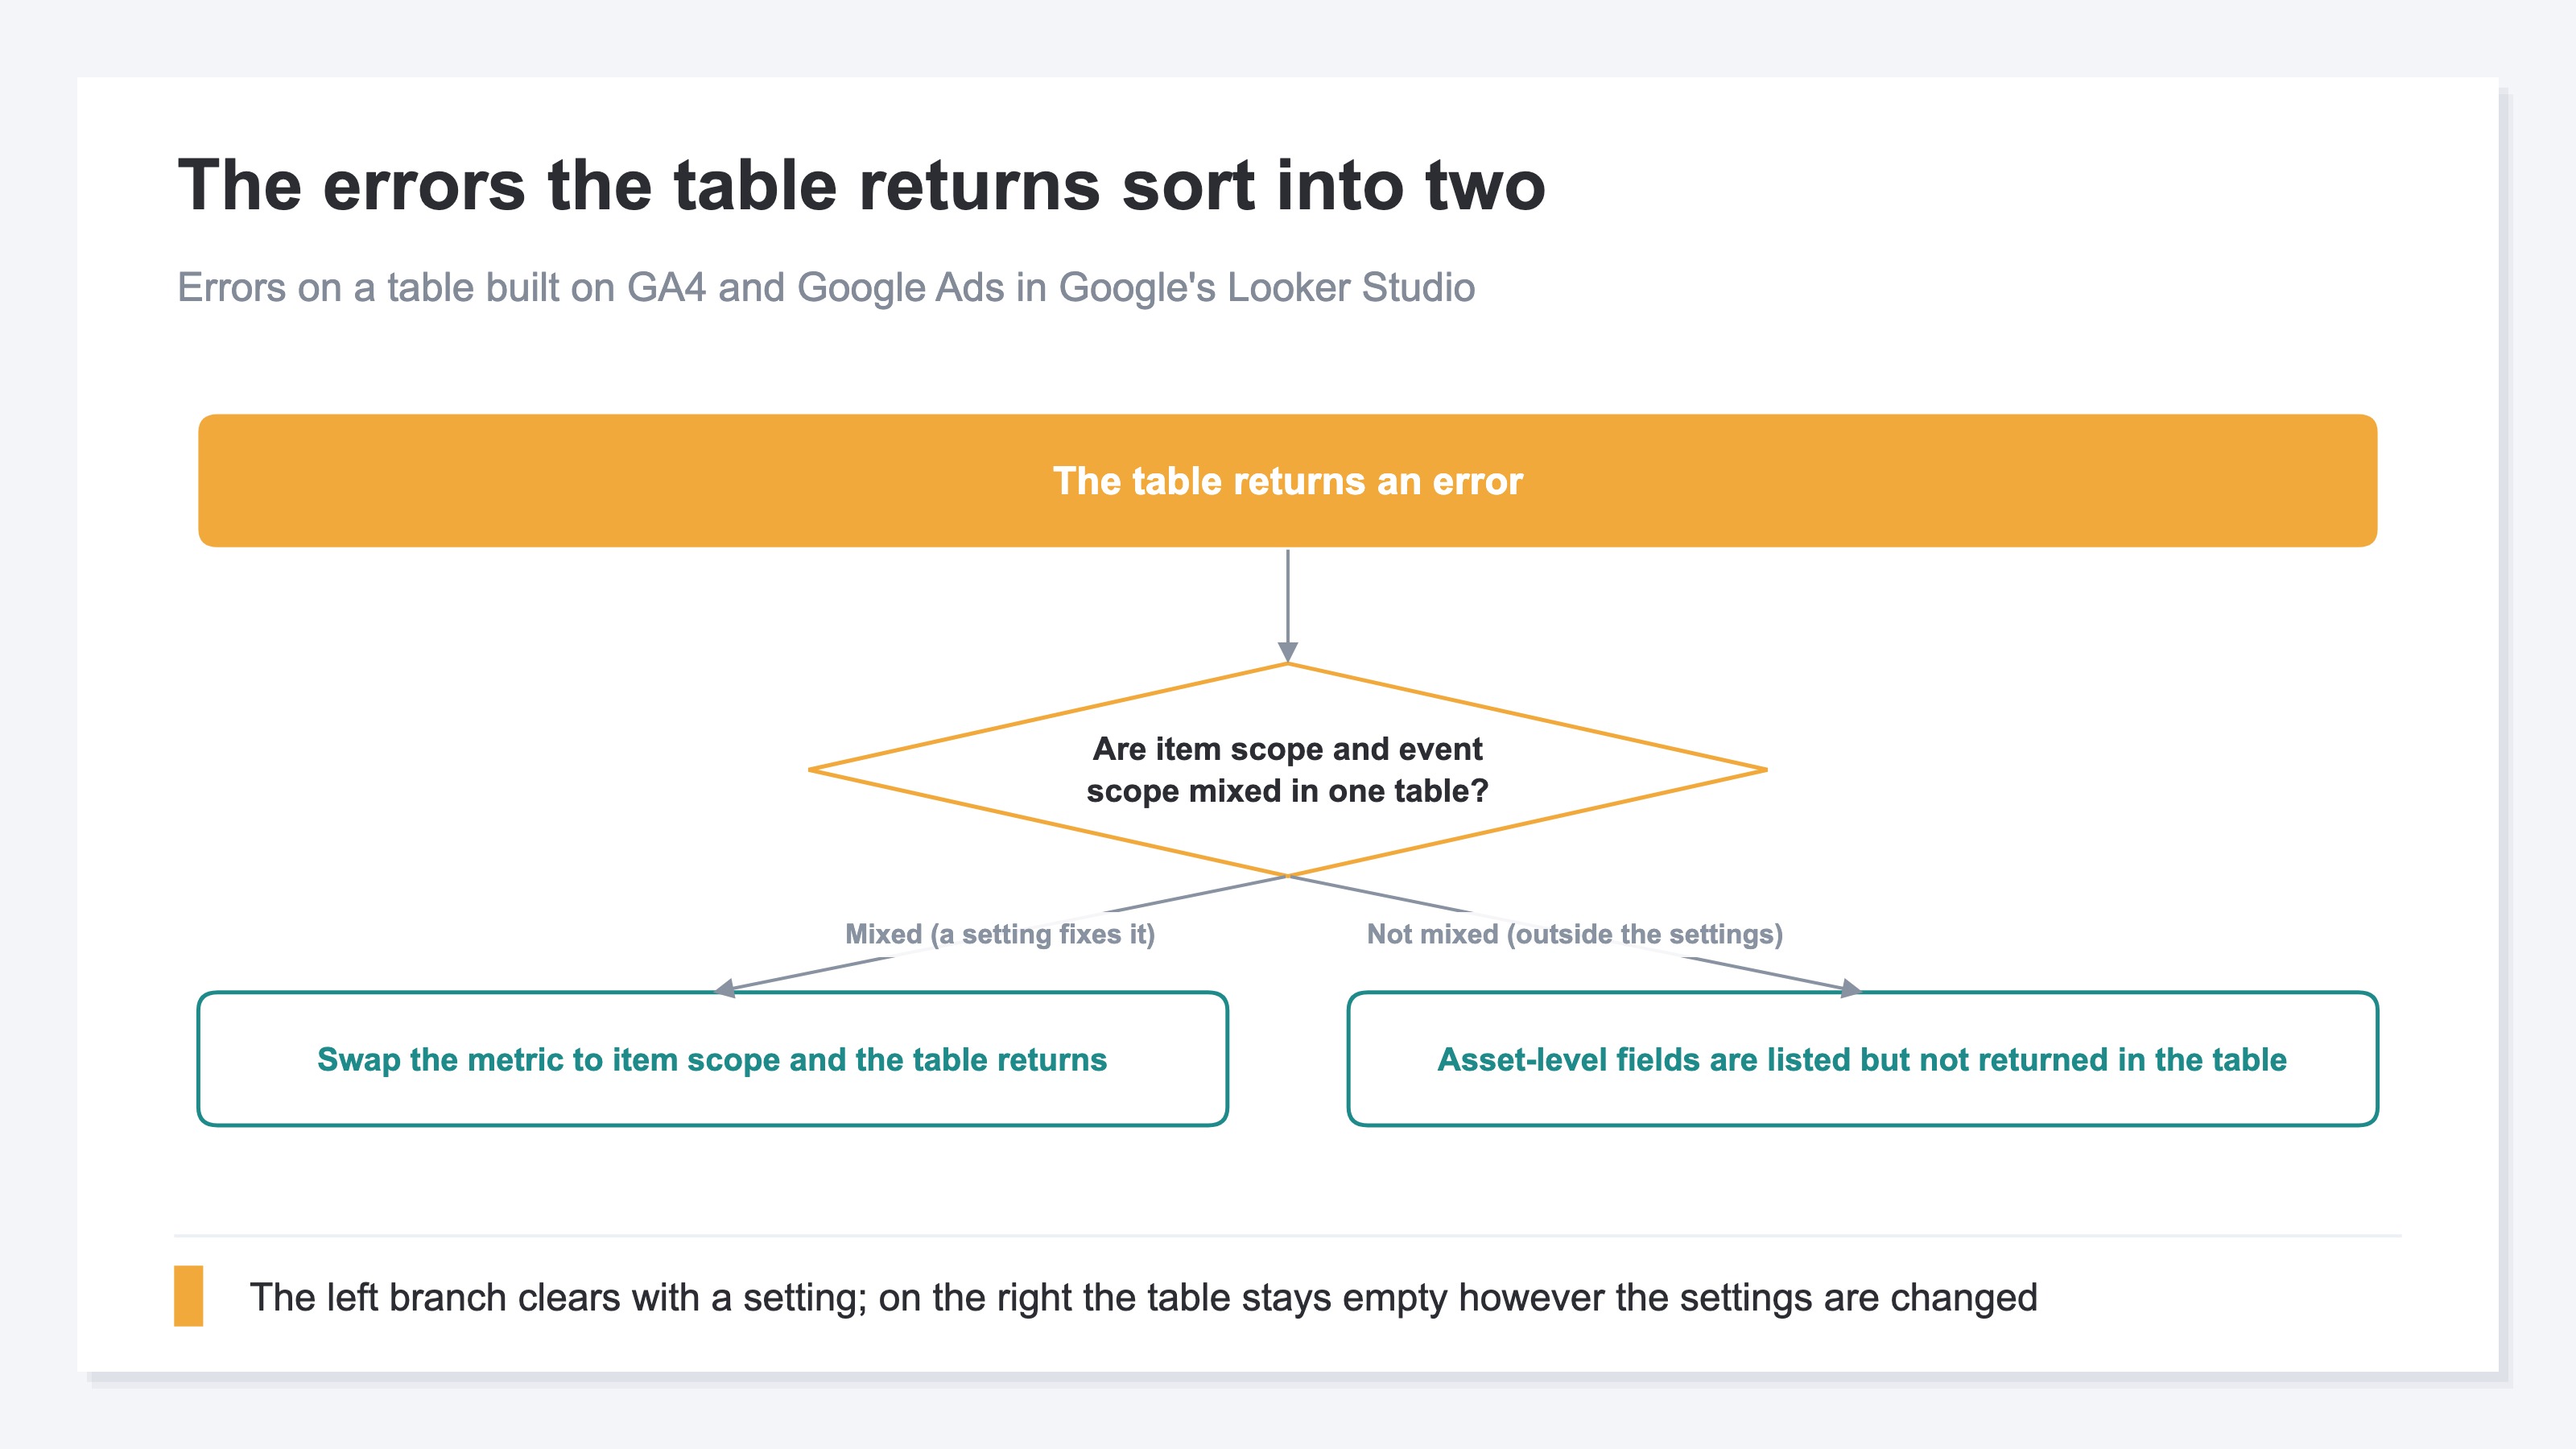
A table built on GA4 in Google's Looker Studio turns into an error the moment you add one more field. This article sorts the errors on that screen into two: the ones a setting change clears, and the ones that sit outside the settings. Once the sorting is done, where to work next is decided too.
Contents
TL;DR#
- GA4 fields split into item scope and event scope, and Google documents the two as incompatible
- The fix is one line: swap the event-scoped metric for an item-scoped one
- Asset-level fields for Google's P-MAX and Demand Gen campaigns are listed in the field picker yet do not come back in the table
- The release notes carry no record of asset support, and inside Google's own console asset-level numbers are a different figure from the campaign total
- A working table reaches as far as clicks and impressions, and the material for where next month's budget goes sits outside that table
1. GA4 Fields Split into Item Scope and Event Scope#
GA4 holds its fields in two separate scopes.
Item name and item category attach to a single product. GA4 calls these item-scoped. Event count and session count attach to a single event, and those are event-scoped. Google's help states outright that ecommerce fields carry these two scopes [1].
Put the two in one table and GA4 returns no data. The documentation says a report combining incompatible fields will not return results [2]. Google's Looker Studio turns that response into an "invalid configuration" message on screen. The word error is on the screen, but GA4 is responding exactly as designed.
So there is one place to look before rewriting any setting: which scope each field currently in the table belongs to. While the two are mixed, rebuilding the data source or removing the filter lands back on the same message. Line the scopes up and the table comes back as it is.
The fix itself is one line. Swap the event-scoped metric for an item-scoped one. If what you want next to item name is the number of purchases, choose the item-scoped metric rather than event count.
Rows that never reach the table happen inside GA4 as well. Rows suppressed by a threshold are covered in rows disappearing into GA4's "other" bucket. Figures splitting between explorations and standard reports are covered in the number gap between GA4 explorations and reports. What this article covers is the screen on the BI tool side.
That is the box a setting change clears. The other box holds fields that stay out of the table even with the scopes lined up.
2. Being Listed and Coming Back Are Two Different Things#
A field being listed in the picker and that field coming back for your campaign are two different things.
The Google Ads connector in Google's Looker Studio carries asset-level fields. Select them for Google's P-MAX and Demand Gen campaigns, though, and the table returns an error. Reconnecting the data source or adding dimensions one at a time stops at the same place. The same stopping point turns up in public forum threads as well.
What the documentation states goes this far. The connector help asks you to include Ad Type and Asset ID in the same table when combining creative asset dimensions with clicks or impressions [3]. The 2025 to 2026 release notes carry no record of asset support being added for P-MAX and Demand Gen [4]. Google is not saying it is unsupported; what primary sources establish is that the record is absent.
There is a reason for this outside the settings. Even inside Google's own console, asset-level numbers are treated as a different figure from the campaign total. On asset group reporting for Performance Max, Google states that conversions aren't split across multiple components of an advertisement, so the number of conversions across all assets will not equal total conversions for the campaign [5]. Demand Gen is even more explicit. When one headline pairs with five images and is clicked five times, five clicks are recorded against the headline and against each image [6]. Add up the clicks per asset and the sum runs past the clicks the ad actually received.
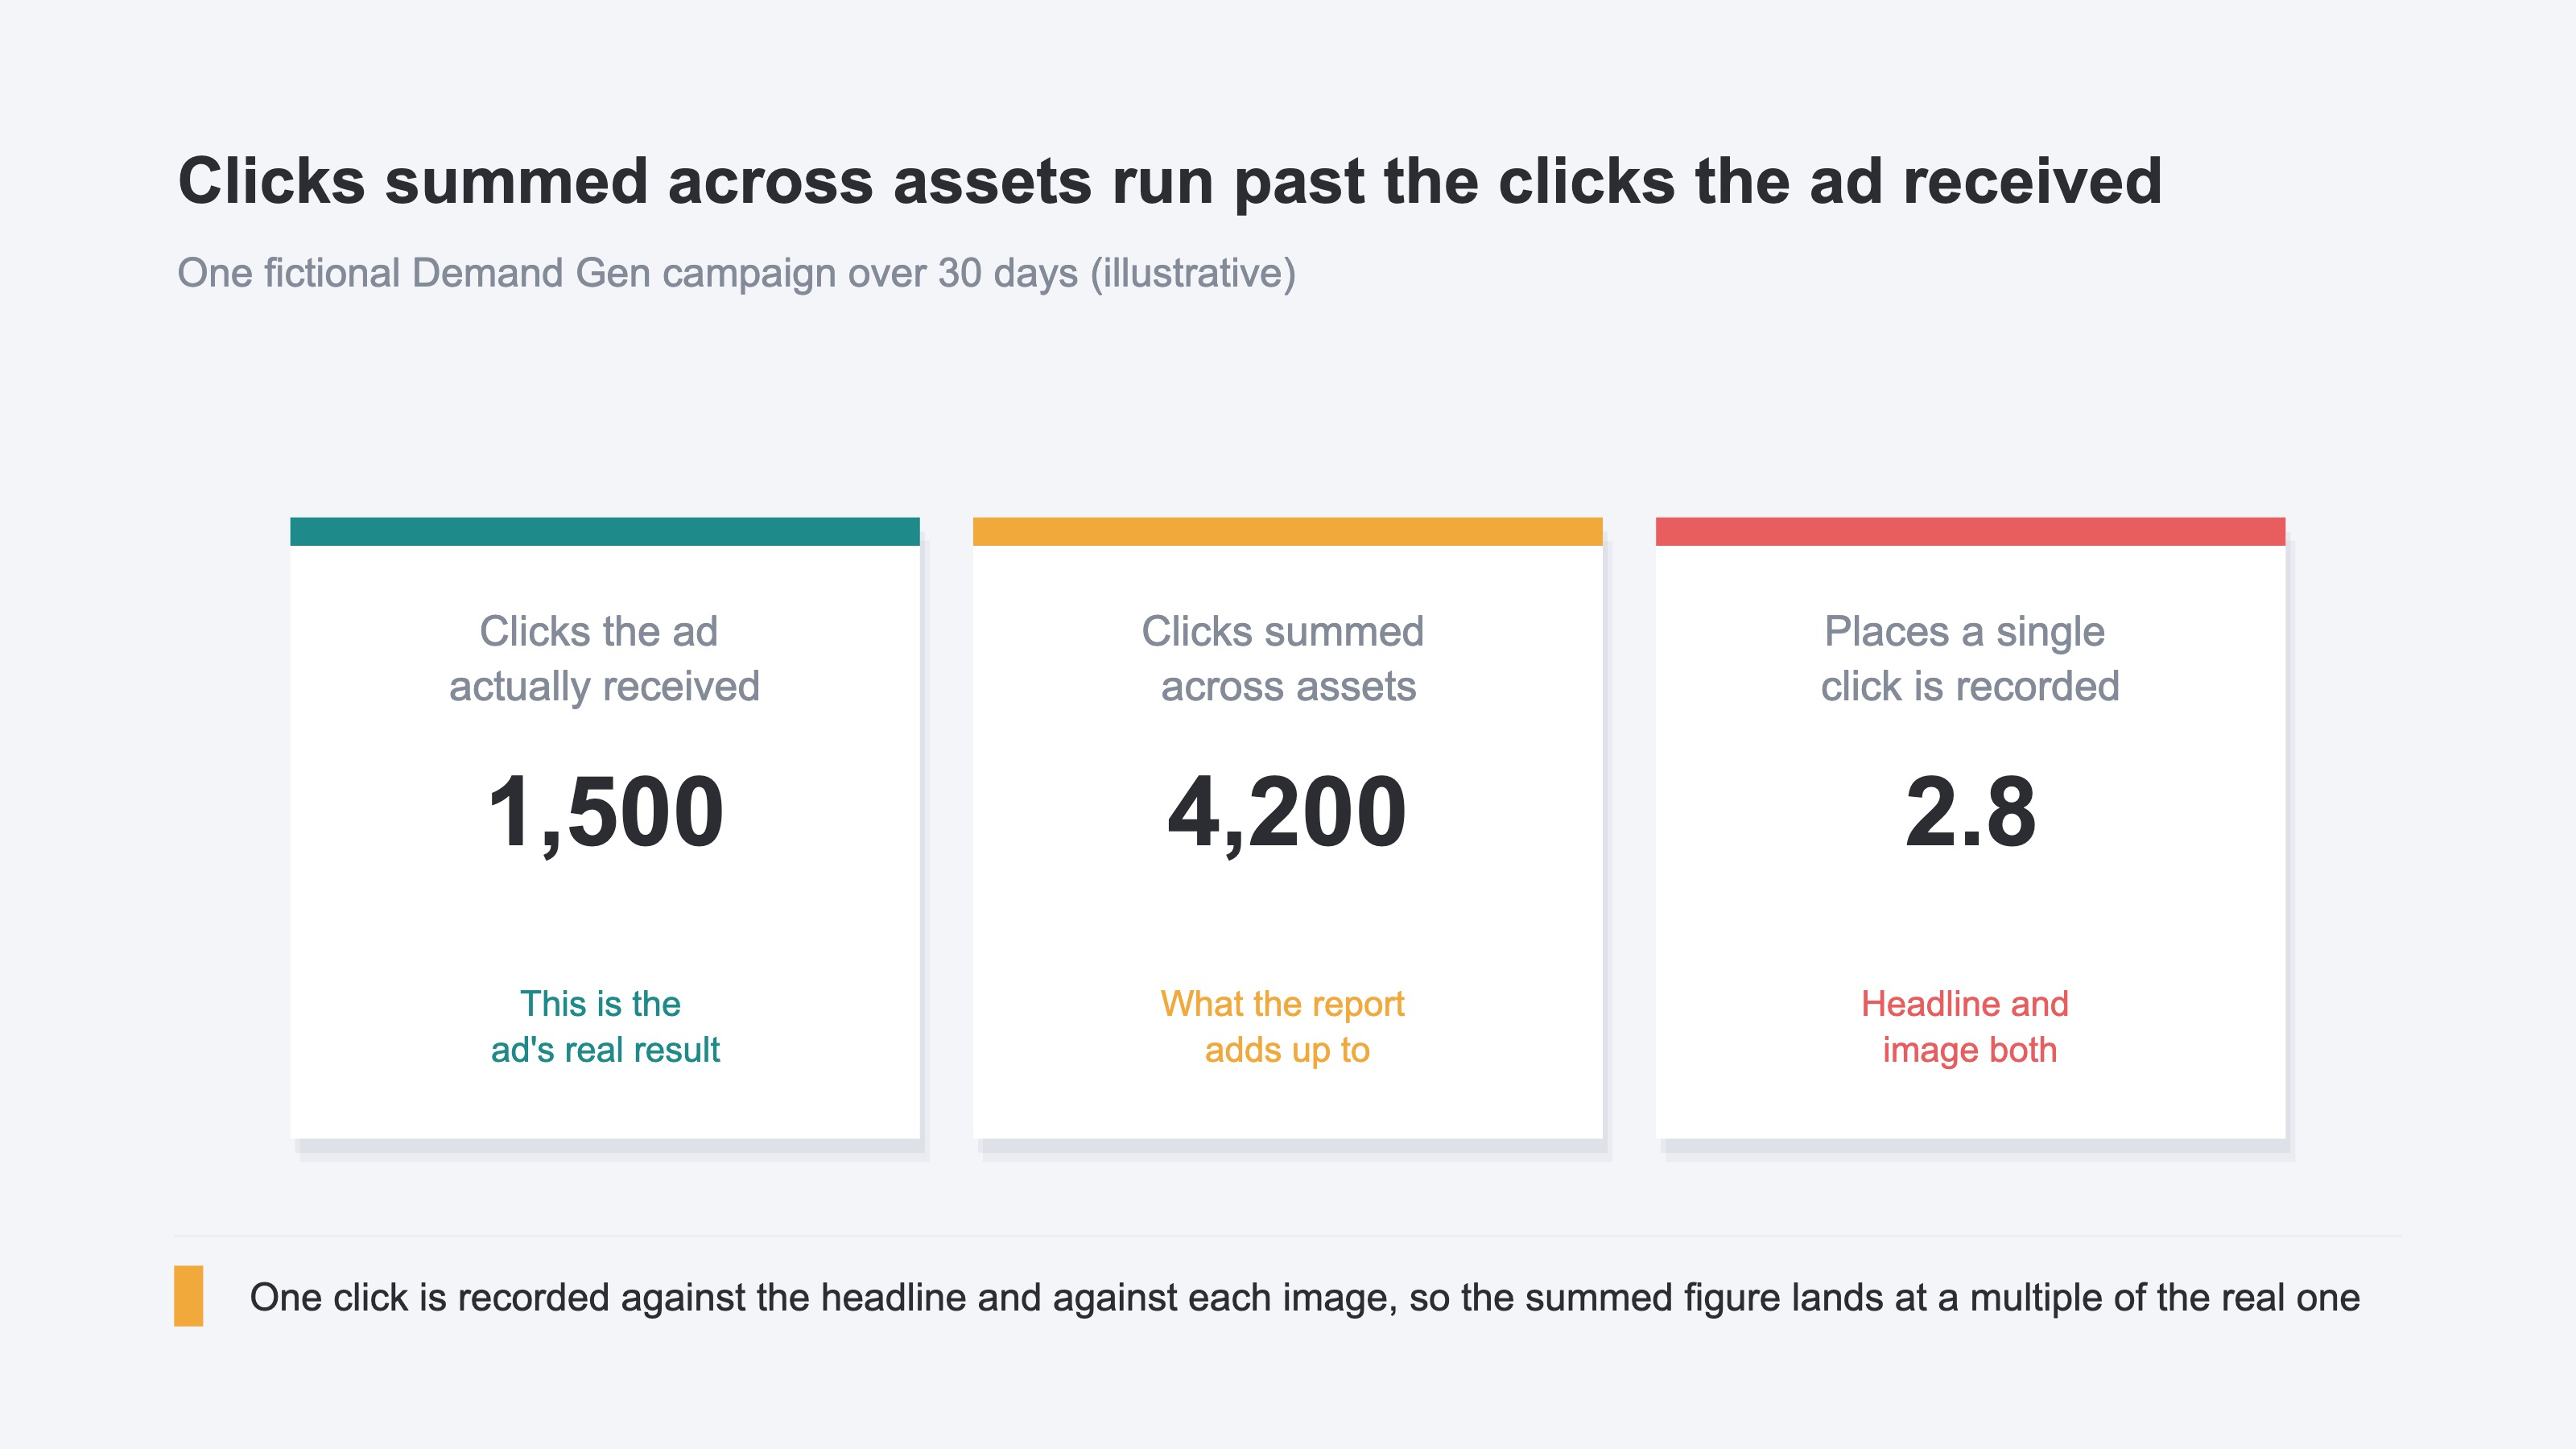
Asset-level numbers are designed as figures that do not add up. Putting figures that do not add up into one table is a question of design rather than of what the connector supports.
A separate line of issues — "the report is slow", "BigQuery costs went up" — belongs elsewhere. Those are about data volume and query cost, so they go to whether GA4 needs BigQuery. The core of this article is sorting the error the table in front of you returns.
3. The Question That Remains Once the Table Works#
A working table reaches as far as clicks and impressions.
In Google's Looker Studio, the GA4 connector and the Google Ads connector each hold the numbers on their own side. Revenue sits on the GA4 side and ad spend sits on the Google Ads side. They are separate data sources, so putting them on one row takes a blend with the join keys lined up.
Building it is possible. What takes time comes after it is built. Change a campaign naming convention and the keys drift; add one platform and the blend gets rebuilt. Every monthly report brings that check back around. The idea is simple, and the weight sits in keeping it alive.
So most screens stay sorted by click count. Sorting by revenue instead requires that revenue to be in the same table.
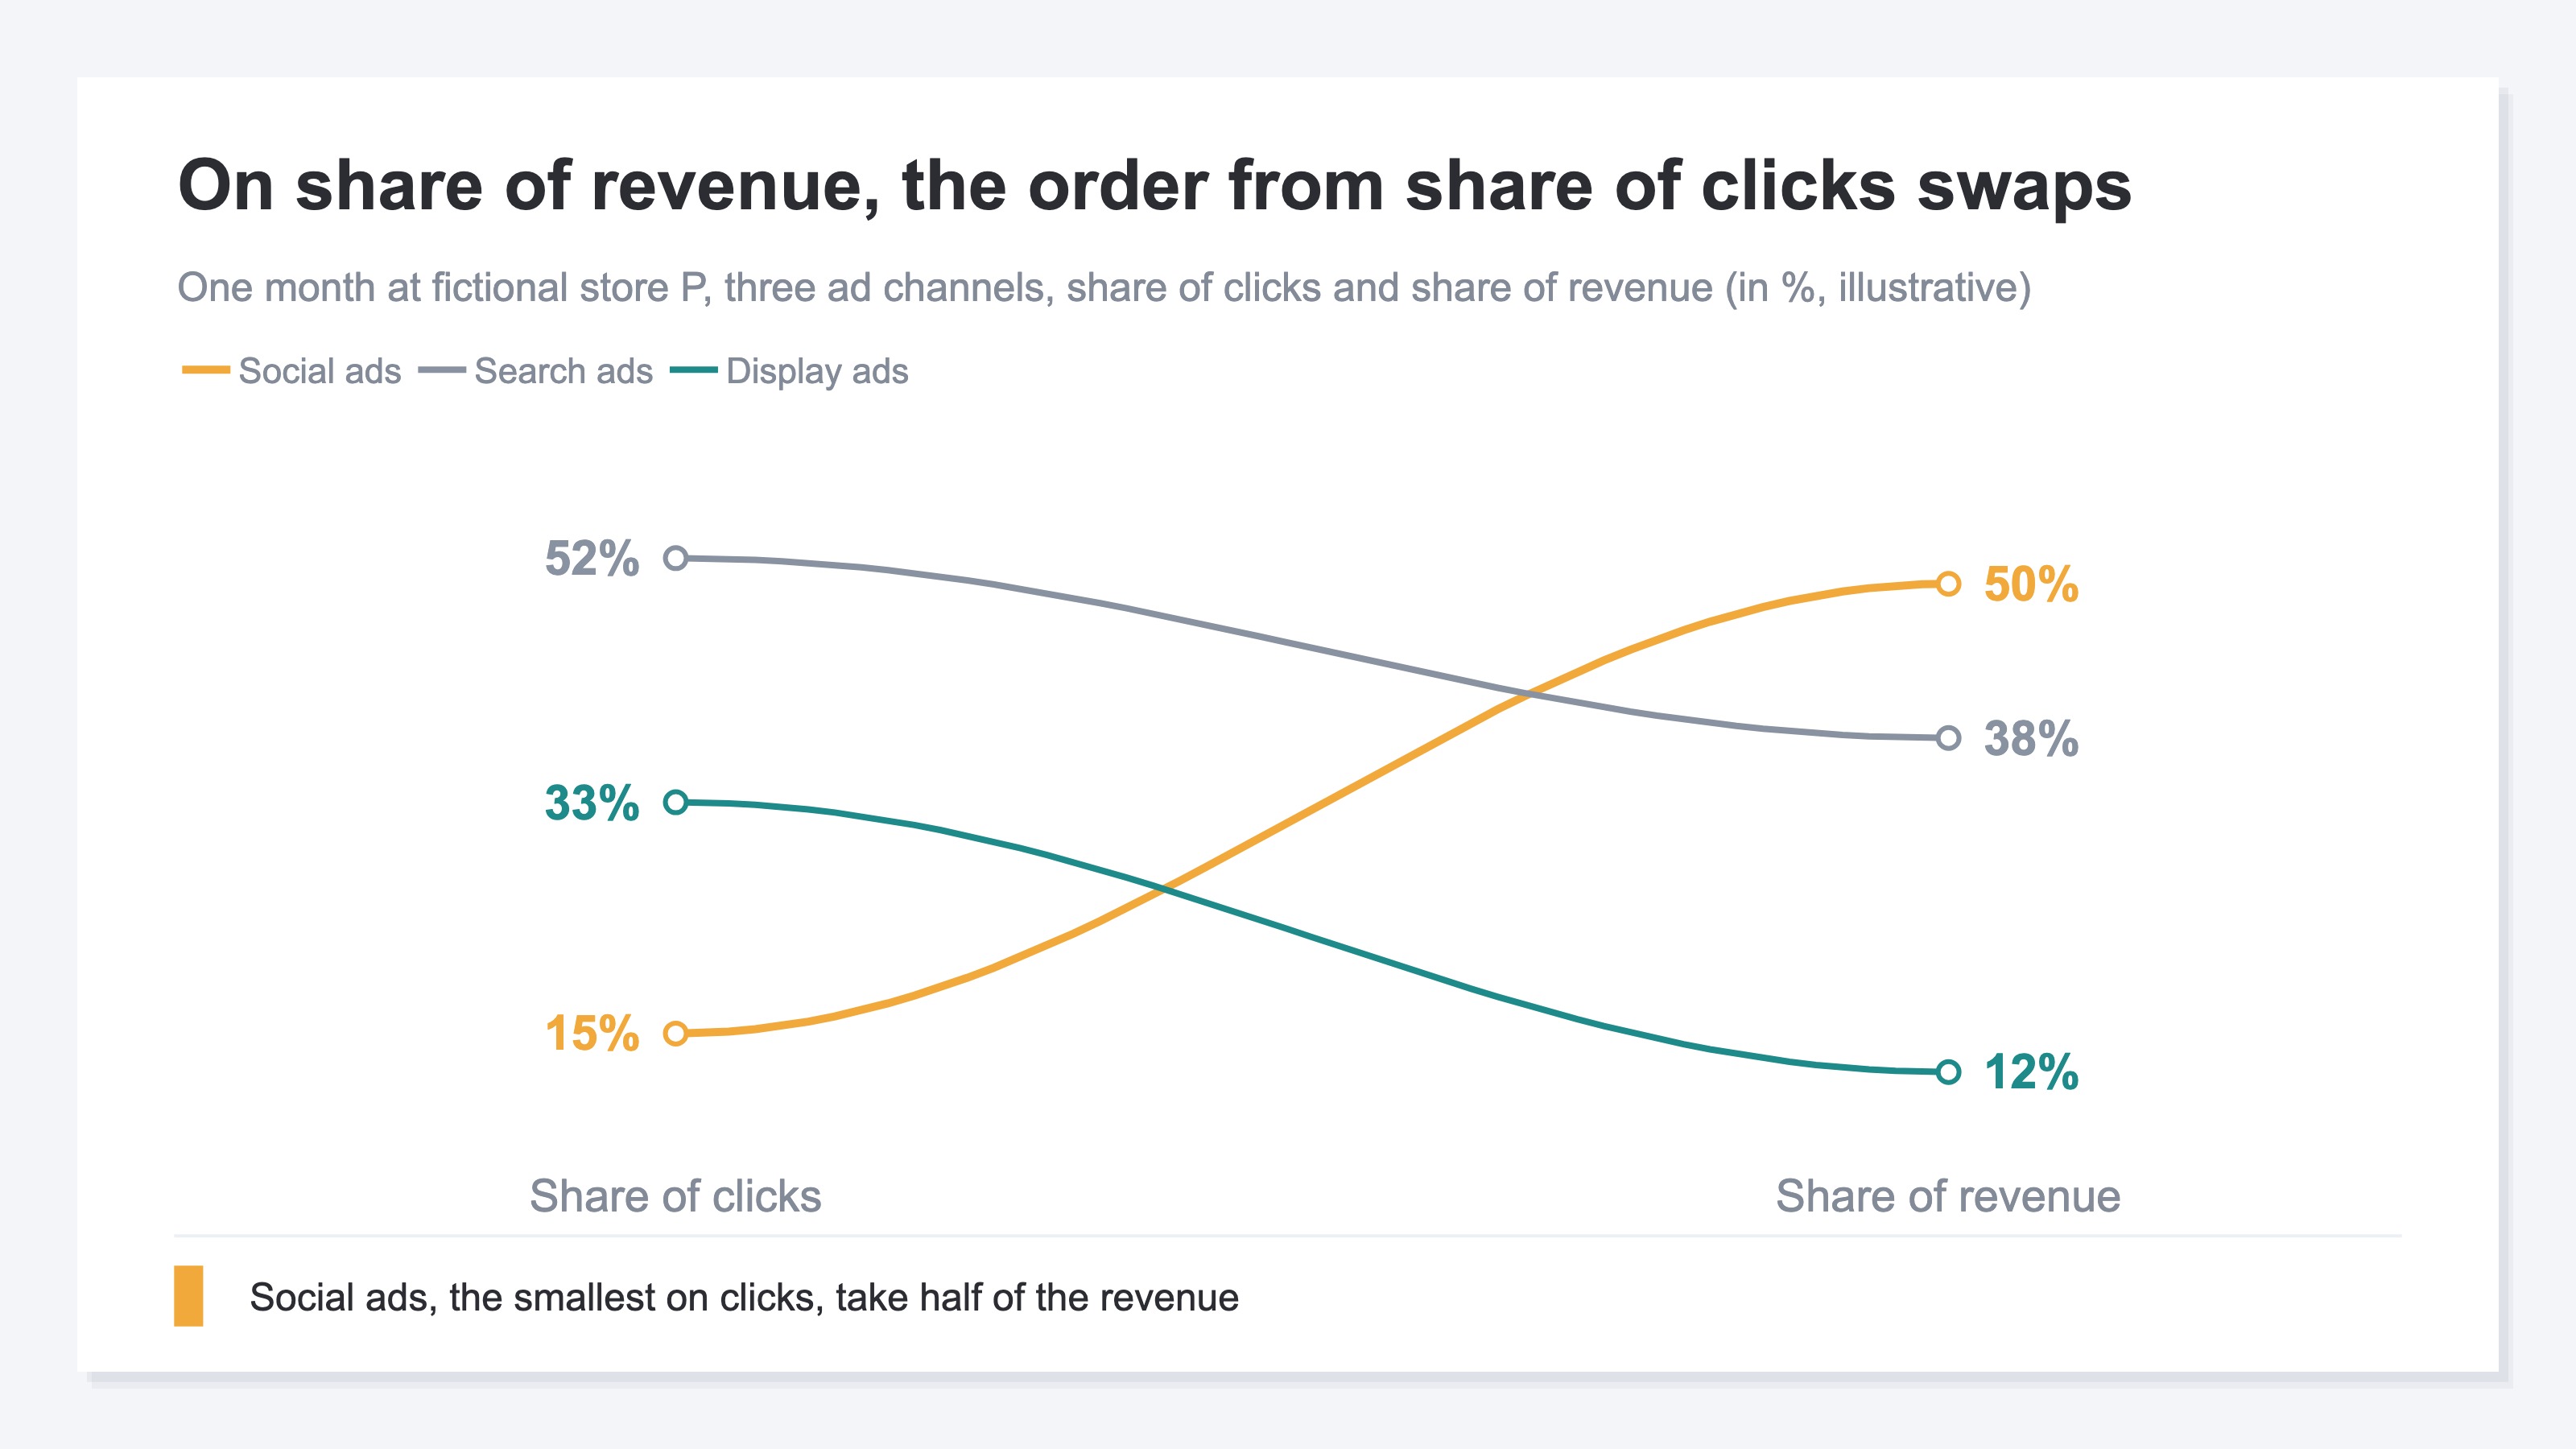
The chart above is one worked example at a fictional store. Search ads take the largest share of clicks at 52%, and drop to 38% of revenue. Social ads sit at 15% of clicks and take 50% of revenue. Carry the click ranking straight into next month's allocation and that swap stays out of view.
The meeting that sets next month's ad budget has a submission deadline. What is needed by that day is one table with revenue and ad spend per channel on the same row. How to think about designing that table is covered in designing a revenue dashboard.
RevenueScope solution
RevenueScope lines up ad spend per ad platform and the matching channel revenue in one table.
The revenue shown is the revenue measured from purchases that occurred on your own site. Ad spend comes in through a form at the year, month and channel level, or through a CSV with three columns of date, channel and amount. For any period taken in, ad spend and the matching channel revenue appear on the platform row in the same line. That revenue is never replaced by a platform's own reported figure, so the source of the number stays the same as the period changes.
Channels belonging to the same platform are shown as one row. Instagram and Facebook land on the Meta row, so the same platform never comes up twice in an allocation decision. Purchases that tie to no traffic source stay on their own row as unattributed revenue.
Open a channel and it goes down to revenue, RPS (revenue per session), AOV (average revenue per order) and CVR at the utm_campaign level.
Once ad spend and revenue sit on the same row, you can also calculate ROAS yourself in a spreadsheet as revenue ÷ ad spend. The table below is a worked example of that.
One month at fictional store L, by ad platform (illustrative)
| Platform | Sessions | Ad spend | Revenue | ROAS |
|---|---|---|---|---|
| Meta | 9,000 | 900,000 yen | 6,300,000 yen | 7.0 |
| Google Ads | 12,000 | 1,300,000 yen | 1,950,000 yen | 1.5 |
| Affiliate media | 400 | 40,000 yen | 340,000 yen | 8.5 |
Note: the table above is a worked example for a fictional site, built to show how to read it. It is not a display of RevenueScope's screen, and ROAS is the value calculated as revenue ÷ ad spend. The sample store linked from the CTA uses separately refreshed daily sample data, so its figures will differ from this example.
The highest ROAS is affiliate media at 8.5x. That row, though, carries 40,000 yen of spend and 400 sessions. Move budget there and total revenue barely shifts. The material for the allocation is the top two rows: Meta at 7.0x and Google Ads at 1.5x come out of the same formula, so they compare directly. Where next month's ad spend goes is settled by the gap between those two.
FAQ#
Frequently Asked Questions#
Q. Will the invalid configuration error clear if I rebuild the data source?
A. Not while item scope and event scope are mixed. The documentation states that incompatible combinations return no data [2], so the same message comes back until the scopes of the fields in the table line up. What gets rebuilt is the combination of fields, not the data source.
Q. Are the P-MAX and Demand Gen asset fields unusable in Google's Looker Studio?
A. No document states that they are unusable. The connector help goes as far as the conditions for using asset dimensions [3], and the release notes carry no record of asset support for P-MAX and Demand Gen [4]. What public forum threads show is that selecting fields listed in the picker returns an error.
Q. If I add up the asset-level figures, do I get the campaign figure?
A. No. In P-MAX, conversions aren't split across the components of an advertisement, so the total across all assets does not equal the campaign total [5]. In Demand Gen, one click is recorded against both the headline and the image, so the sum runs past the clicks the ad actually received [6].
Q. Can a blend put ad spend and revenue in the same table?
A. Yes. Line up the join keys, build the blend, and it becomes one table. The effort comes after that: every change to a campaign naming convention and every platform added calls for a rebuild. If you are running it monthly, settle first on who owns that maintenance.
Summary#
When the error appears, sort it into two first. Fields mixed across item scope and event scope clear once the scopes line up [1][2]. The asset fields for P-MAX and Demand Gen are not resolved on the settings side, because even inside Google's own console asset-level numbers are treated as a different figure from the campaign total [5][6].
With that settled, decide in advance on the question that follows a working table. A row of clicks and impressions alone does not settle where next month's budget goes by platform. Prepare the shape where revenue and ad spend per platform sit on the same row, and the allocation call can be made on the day, whatever the connector spec does next.
See which ads actually drive revenue, at a glance
Free up to 2,000 sessions/month, AI connection included. No credit card required. Up and running in 5 minutes.
References#
- [1] Google Analytics Help "[GA4] Ecommerce scopes" (2026)
- [2] Google Analytics Help "[GA4] Data compatibility" (2026)
- [3] Looker Studio Help "Connect to Google Ads" (2026)
- [4] Looker Studio Help "Looker Studio release notes" (2026)
- [5] Google Ads Help "About asset group reporting for Performance Max" (2026)
- [6] Google Ads Help "About asset reporting for Demand Gen campaigns" (2026)