You checked a number in the reports, rebuilt it in an exploration over the same period with the same metrics, and only the exploration came back smaller. The cause of this symptom isn't a mistake in the settings. It's GA4's design, where each surface refers to a different shape of data and carries a different protection. This article isn't about fixing that. It's about which surface to use when.
Contents
TL;DR#
- The gap between explorations and reports comes out of GA4's design, not out of a mistake in the settings
- Three mechanisms create it: sampling, the (other) row and data thresholds
- Sampling and the (other) row are common to reports, explorations and the Data API. Only BigQuery sits outside them
- Rather than chasing a match, assign up front which number answers which question
- Even once the assignment is made, the repetition of checking which mechanism was at work stays with every number you pull
1. Which Is Right, Explorations or Reports?#
Both are. That is the conclusion.
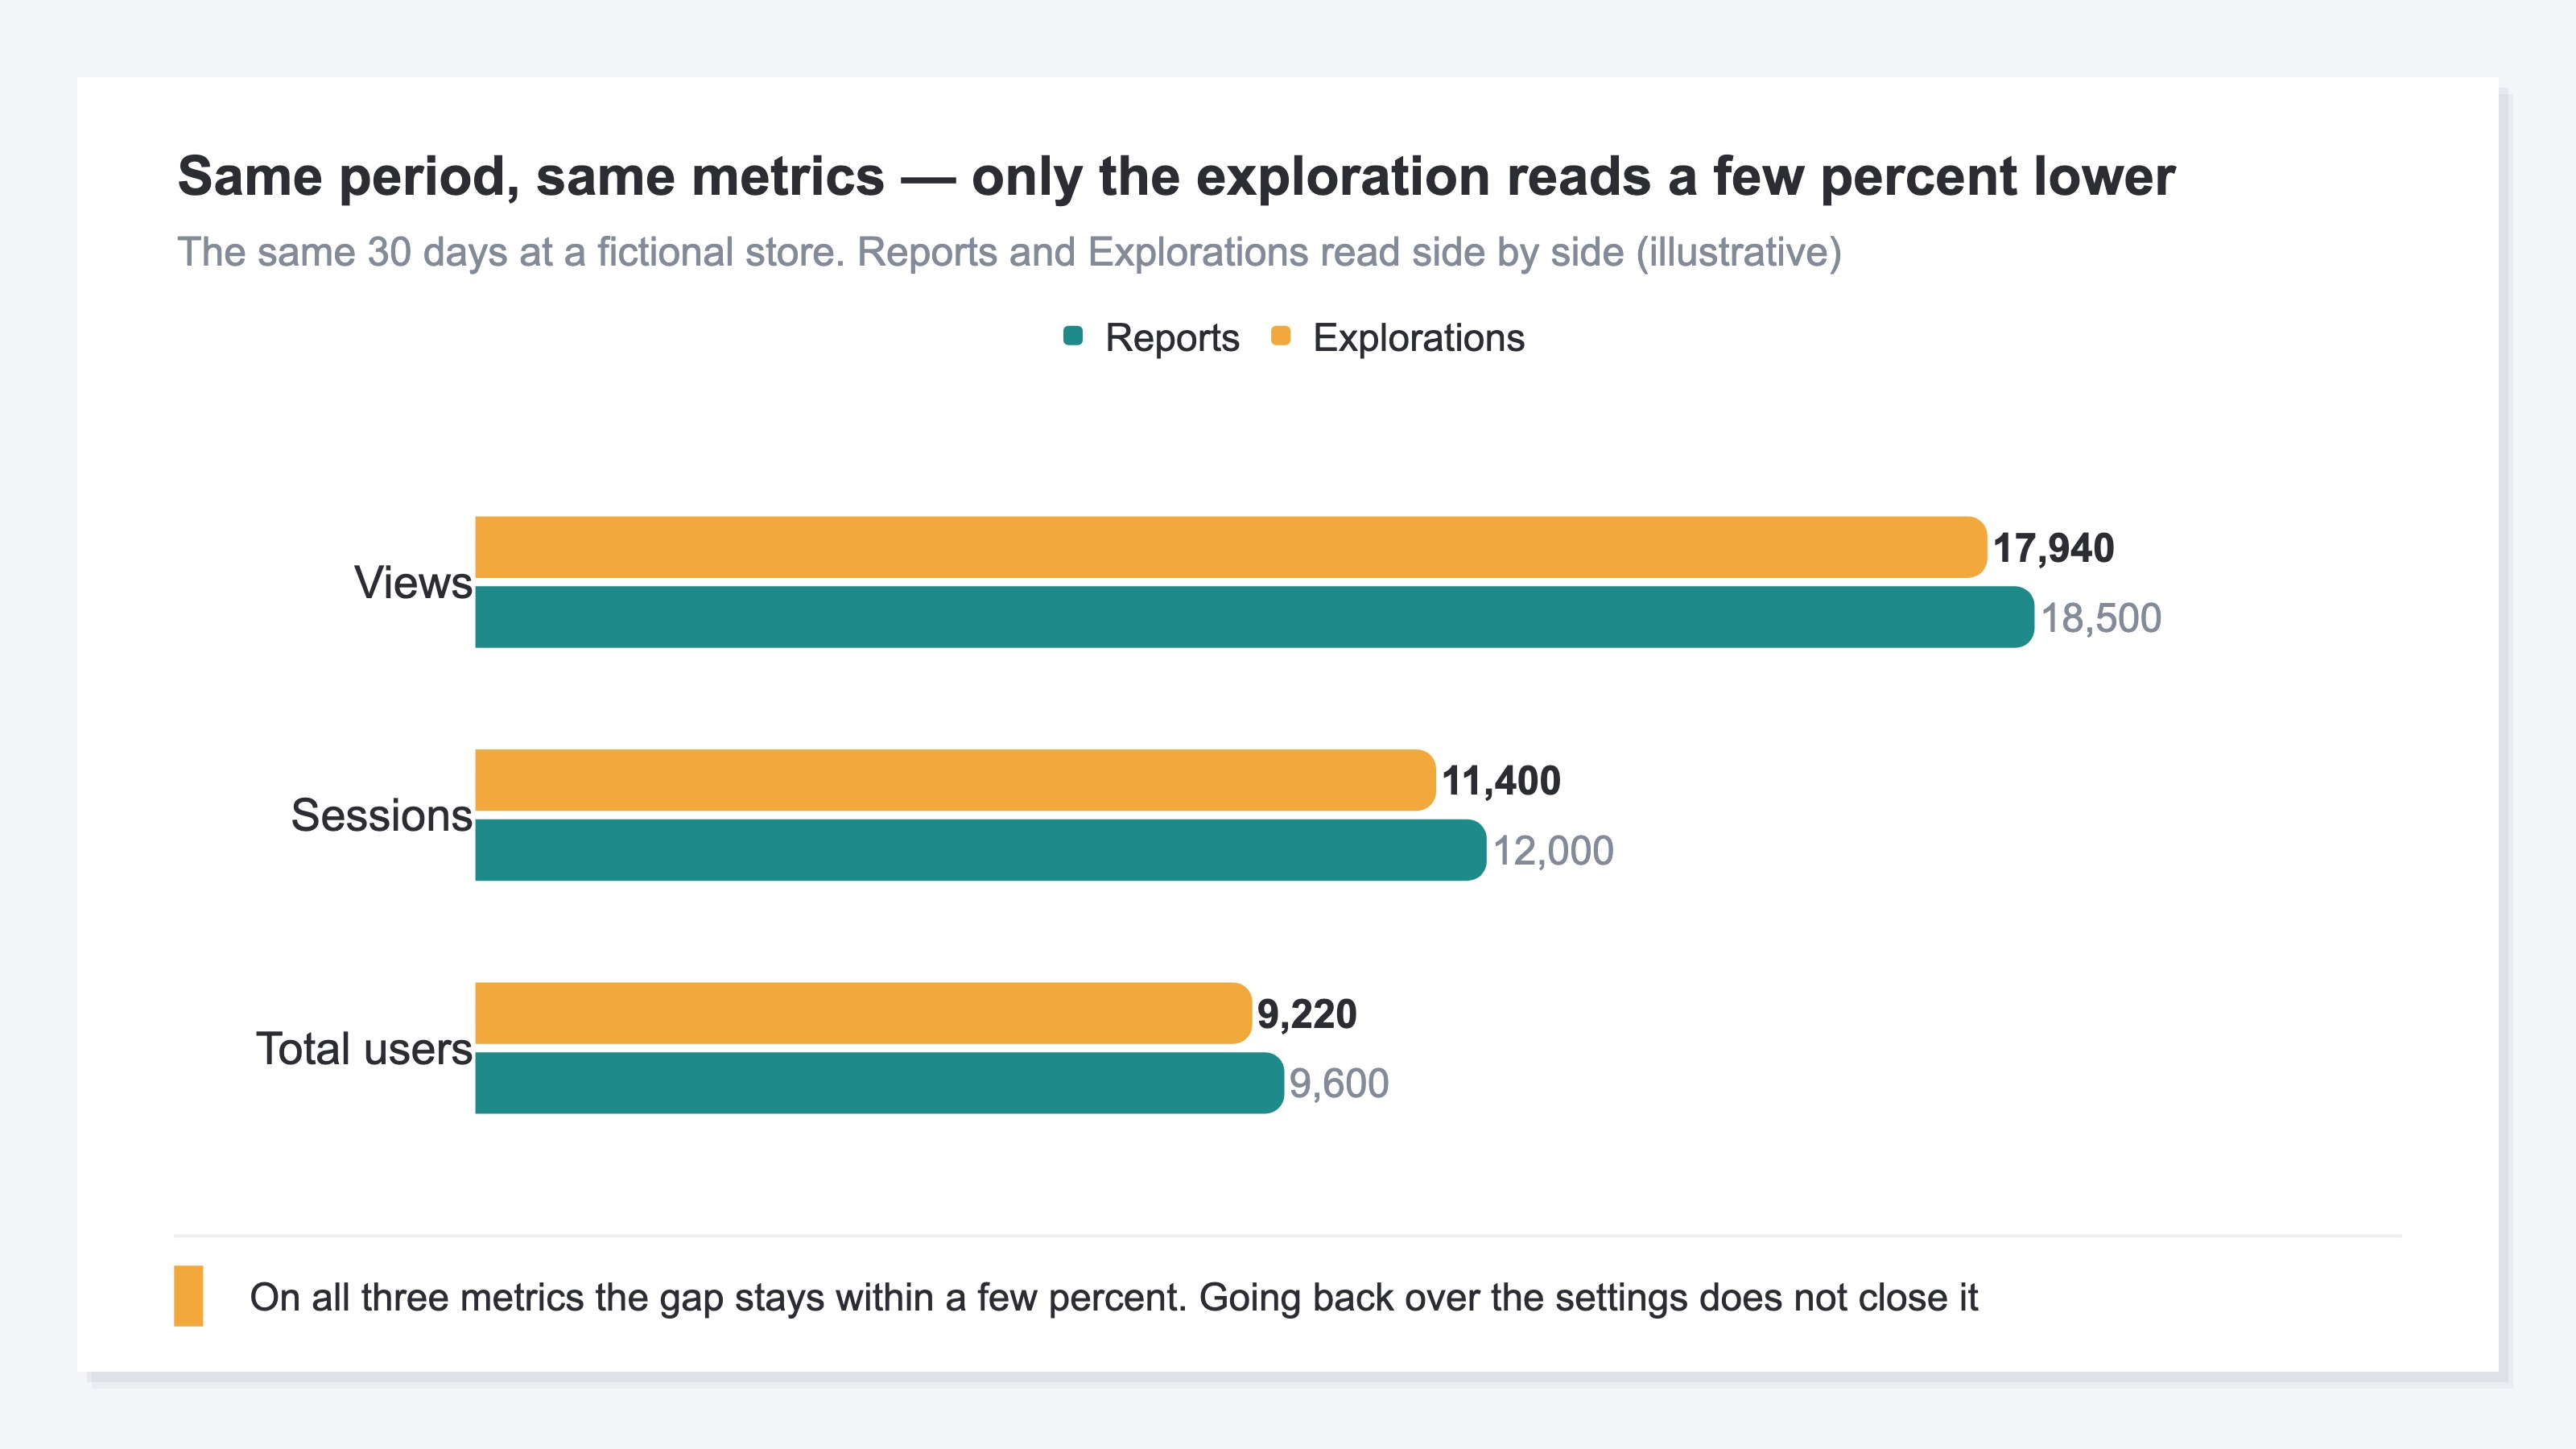
The symptom always arrives in the same shape. You check sessions in the reports, then build an exploration over the same period with the same metrics. The exploration alone comes back a few percent smaller. Add a dimension and a row that was in the reports is nowhere in the exploration. Doubt one side, go back over its settings, and the gap doesn't close.
How to build an exploration in the first place is covered in GA4 explorations for ecommerce, so this article skips it. Numbers that fail to agree between Google Search Console and GA4 are a separate symptom, one that runs across tools. Google Search Console and GA4 disagree on AI separates that one out.
Once it's clear the gap won't close, most people set out to decide which side to treat as the standard. That deliberation has no end, because the answer sits outside the two choices. Reports and explorations are each returning the numbers their design calls for. What has to be decided is not which one to believe. It is which number answers which question.
GA4 designs the shape of the data referred to, and the protections that guard the numbers, separately for each outlet: reports, explorations, the Data API and BigQuery. Google's own help calls these outlets reporting surfaces[1], and this article uses the same word. Specify the same period, and if the mechanisms in the path are different, what comes out is different surface by surface. The next section splits those mechanisms into three.
2. Three Mechanisms That Make the Numbers Differ#
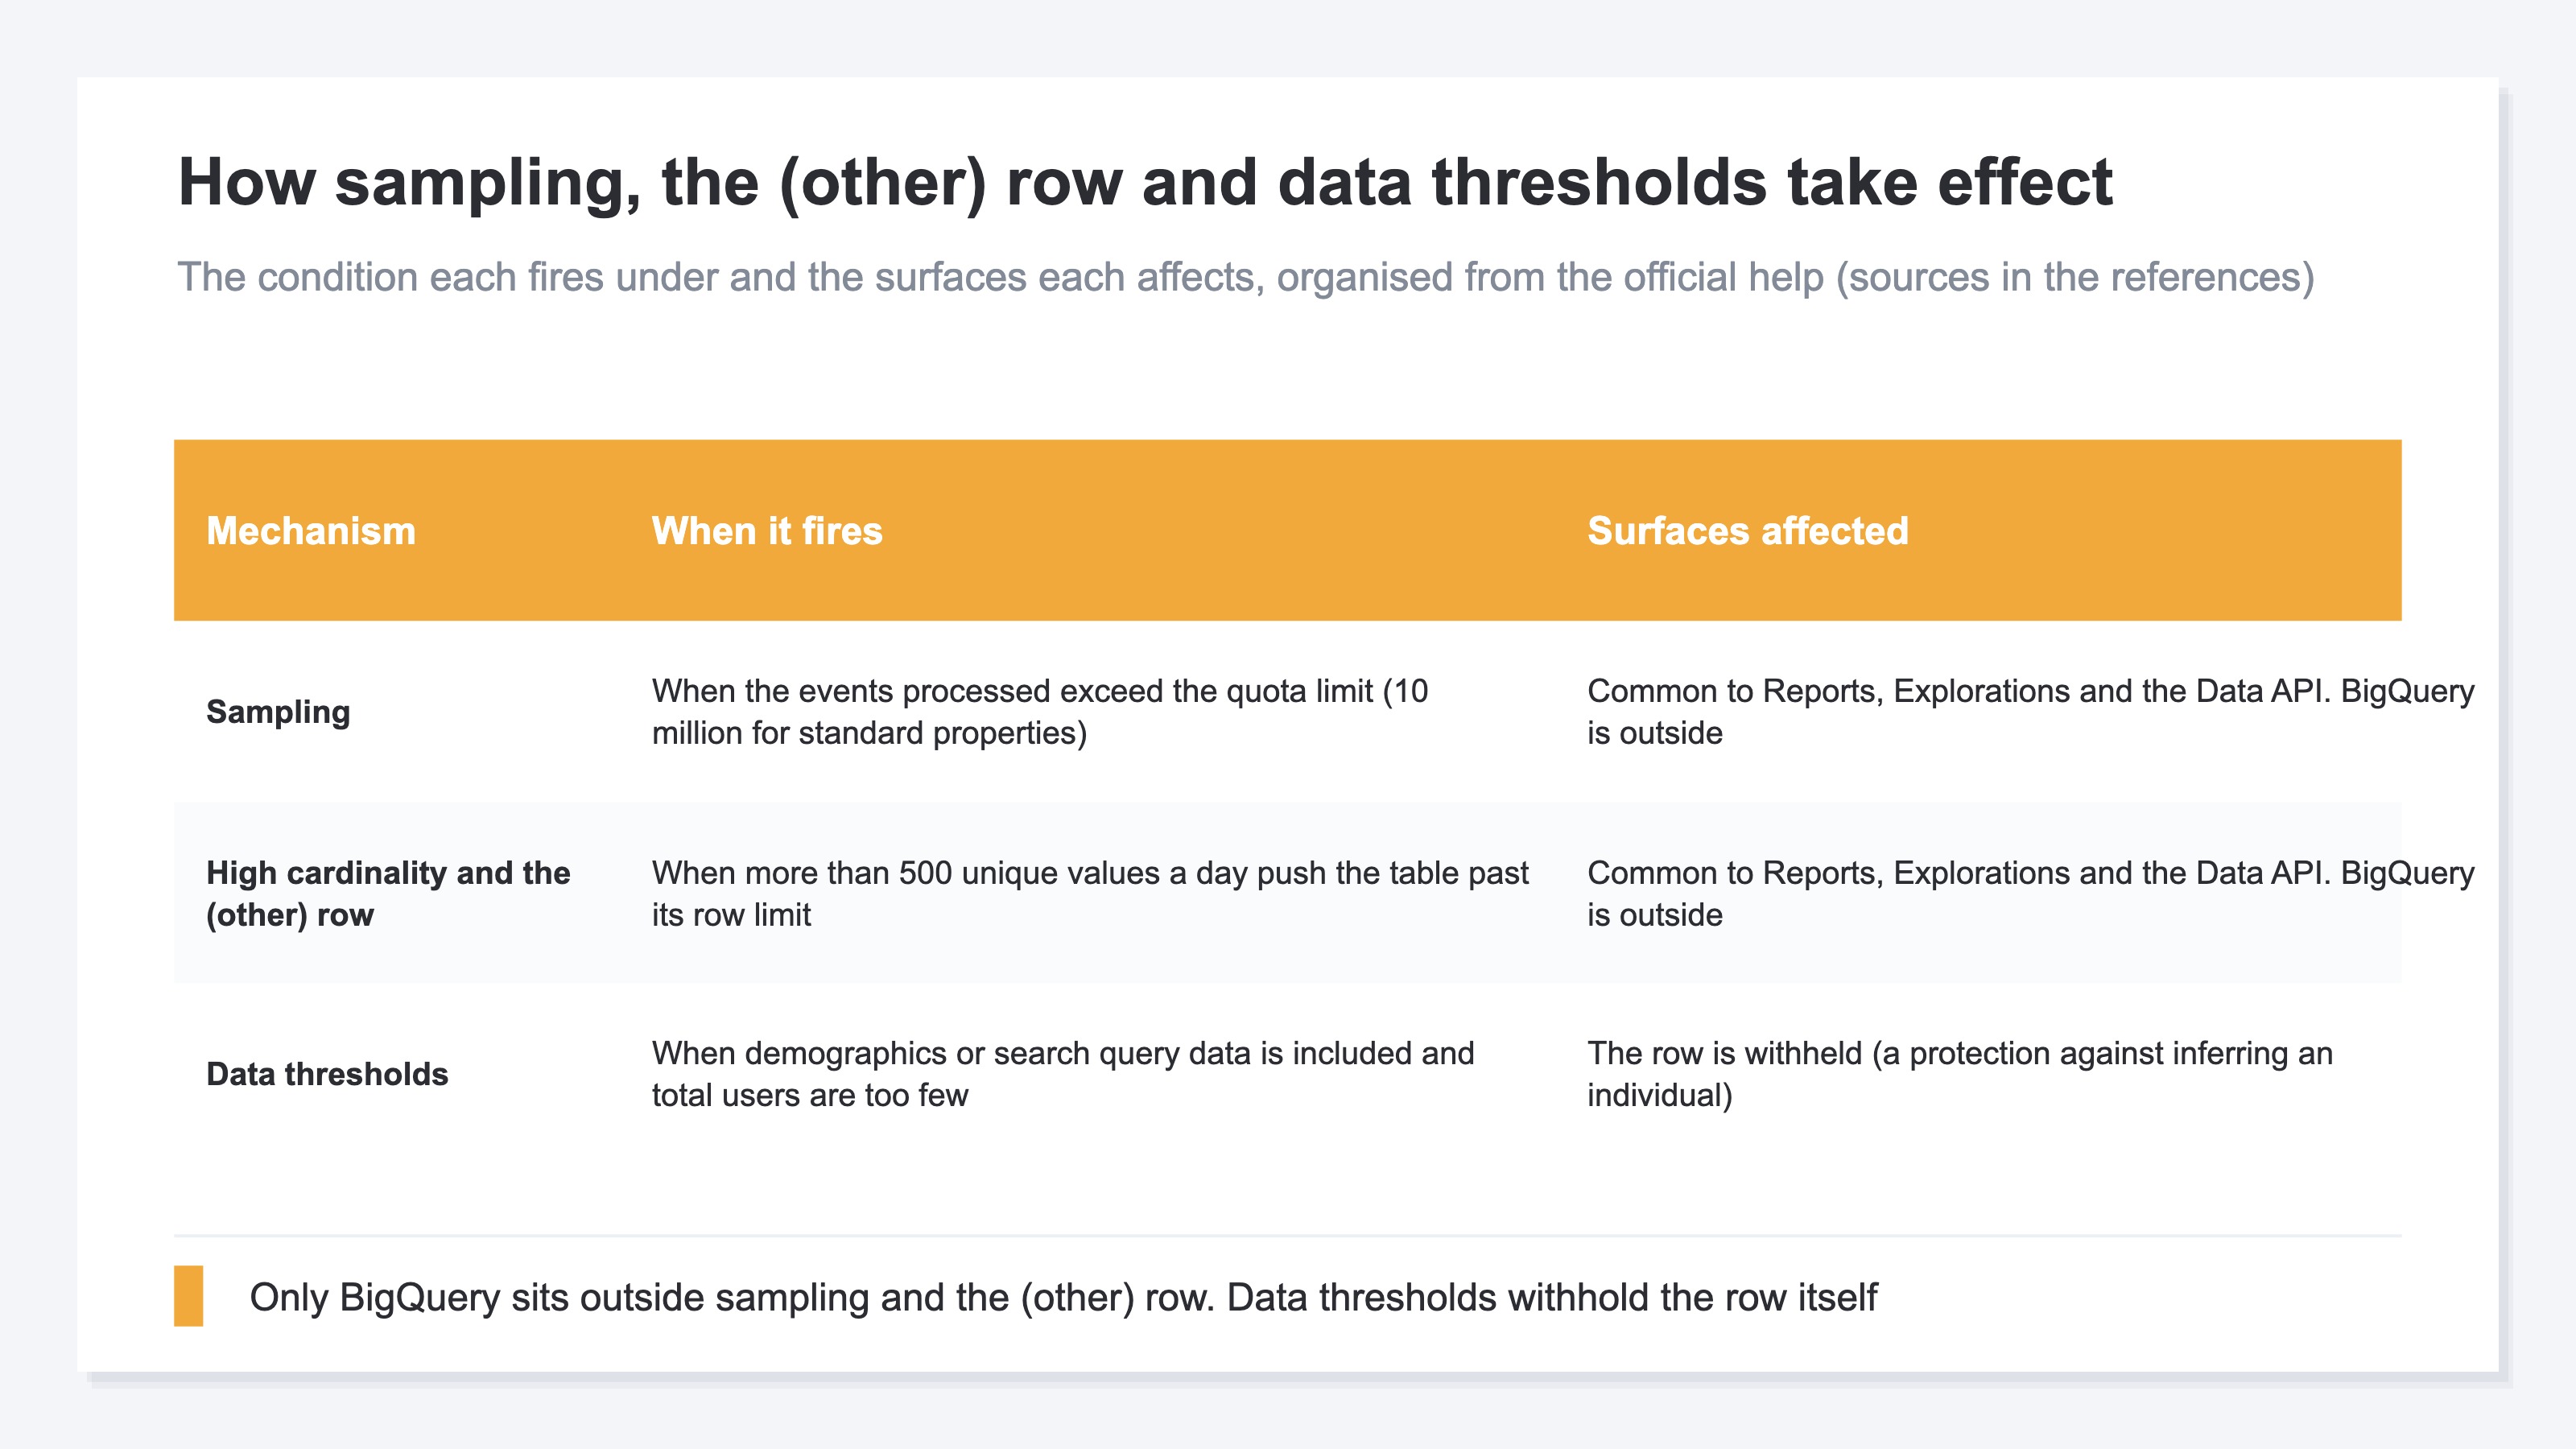
Three mechanisms create the gap: sampling, the (other) row and data thresholds.
The first is sampling. An aggregation that draws on granular event-level and user-level data can end up processing more events than the quota allows. When that happens, GA4 uses a representative sample of the available data in place of the whole set[1]. The quota limit is 10 million events for standard properties[2]. The longer the period and the freer the combination of dimensions, the more events there are to process. An aggregation that reaches the limit is an estimate built from a sample, so its numbers sit apart from an aggregation over the whole set.
The second is the (other) row. Screens that use aggregated data have a row limit on the table. When the data carries more rows than that, everything past the limit is condensed into a single row labelled "(other)"[1][4]. What gets condensed most readily is high-cardinality dimensions, meaning dimensions with more than 500 unique values in one day[1]. It shows up on axes with many distinct values, like the page URL. How the condensing happens changes with the surface and the conditions, so specifying the same dimension no longer gives you the same set of rows or the same breakdown.
The third is data thresholds. There are two situations where they apply. One is when demographics data, or an audience defined using it, is included. The other is when search query information is included and there aren't enough total users[3]. GA4 withholds the rows they apply to. It is a protection that keeps the identity of an individual user, or confidential information, from being inferred out of the signals in the data[3]. The rows that disappear don't stay behind as blanks. They look as though they were never there. The detailed way to check the symptom of rows disappearing is left to GA4 missing rows: (other) vs data thresholds.
There is a line drawn around what these three apply to. In the comparison table in the official help, sampling and the (other) row are written in the same sentence across the columns for reports, explorations and the Data API. Only BigQuery sits outside[1]. The export to BigQuery is raw event data, so neither sampling nor condensing into (other) applies to it. On standard properties, though, the export has a limit of 1 million events per day[1].
3. Decide the Use Before You Chase a Match#
Call off the work of matching, and settle the assignment instead. Trends to the reports, detail drill-downs to explorations, whole-set audits to BigQuery. Those three lines are this article's answer.
Comparing against last month, looking at the share each channel holds, noticing a sudden rise or fall. Questions about trend don't change their conclusion under a little sampling or a little condensing into (other). The reports are enough.
Drilling in, building conditions to follow one particular segment, is where explorations belong. Before you use the numbers that come out, though, check whether sampling was applied. The exploration screen carries an indicator of whether the aggregation came from the whole set. If it was applied, shorten the period and bring the event count back inside the quota.
Questions that need accuracy down to a single record, and audits like reconciling refunds where nothing short of the whole set means anything, are BigQuery's territory. Whether you should connect it at all is covered in Do you need GA4's BigQuery export?.
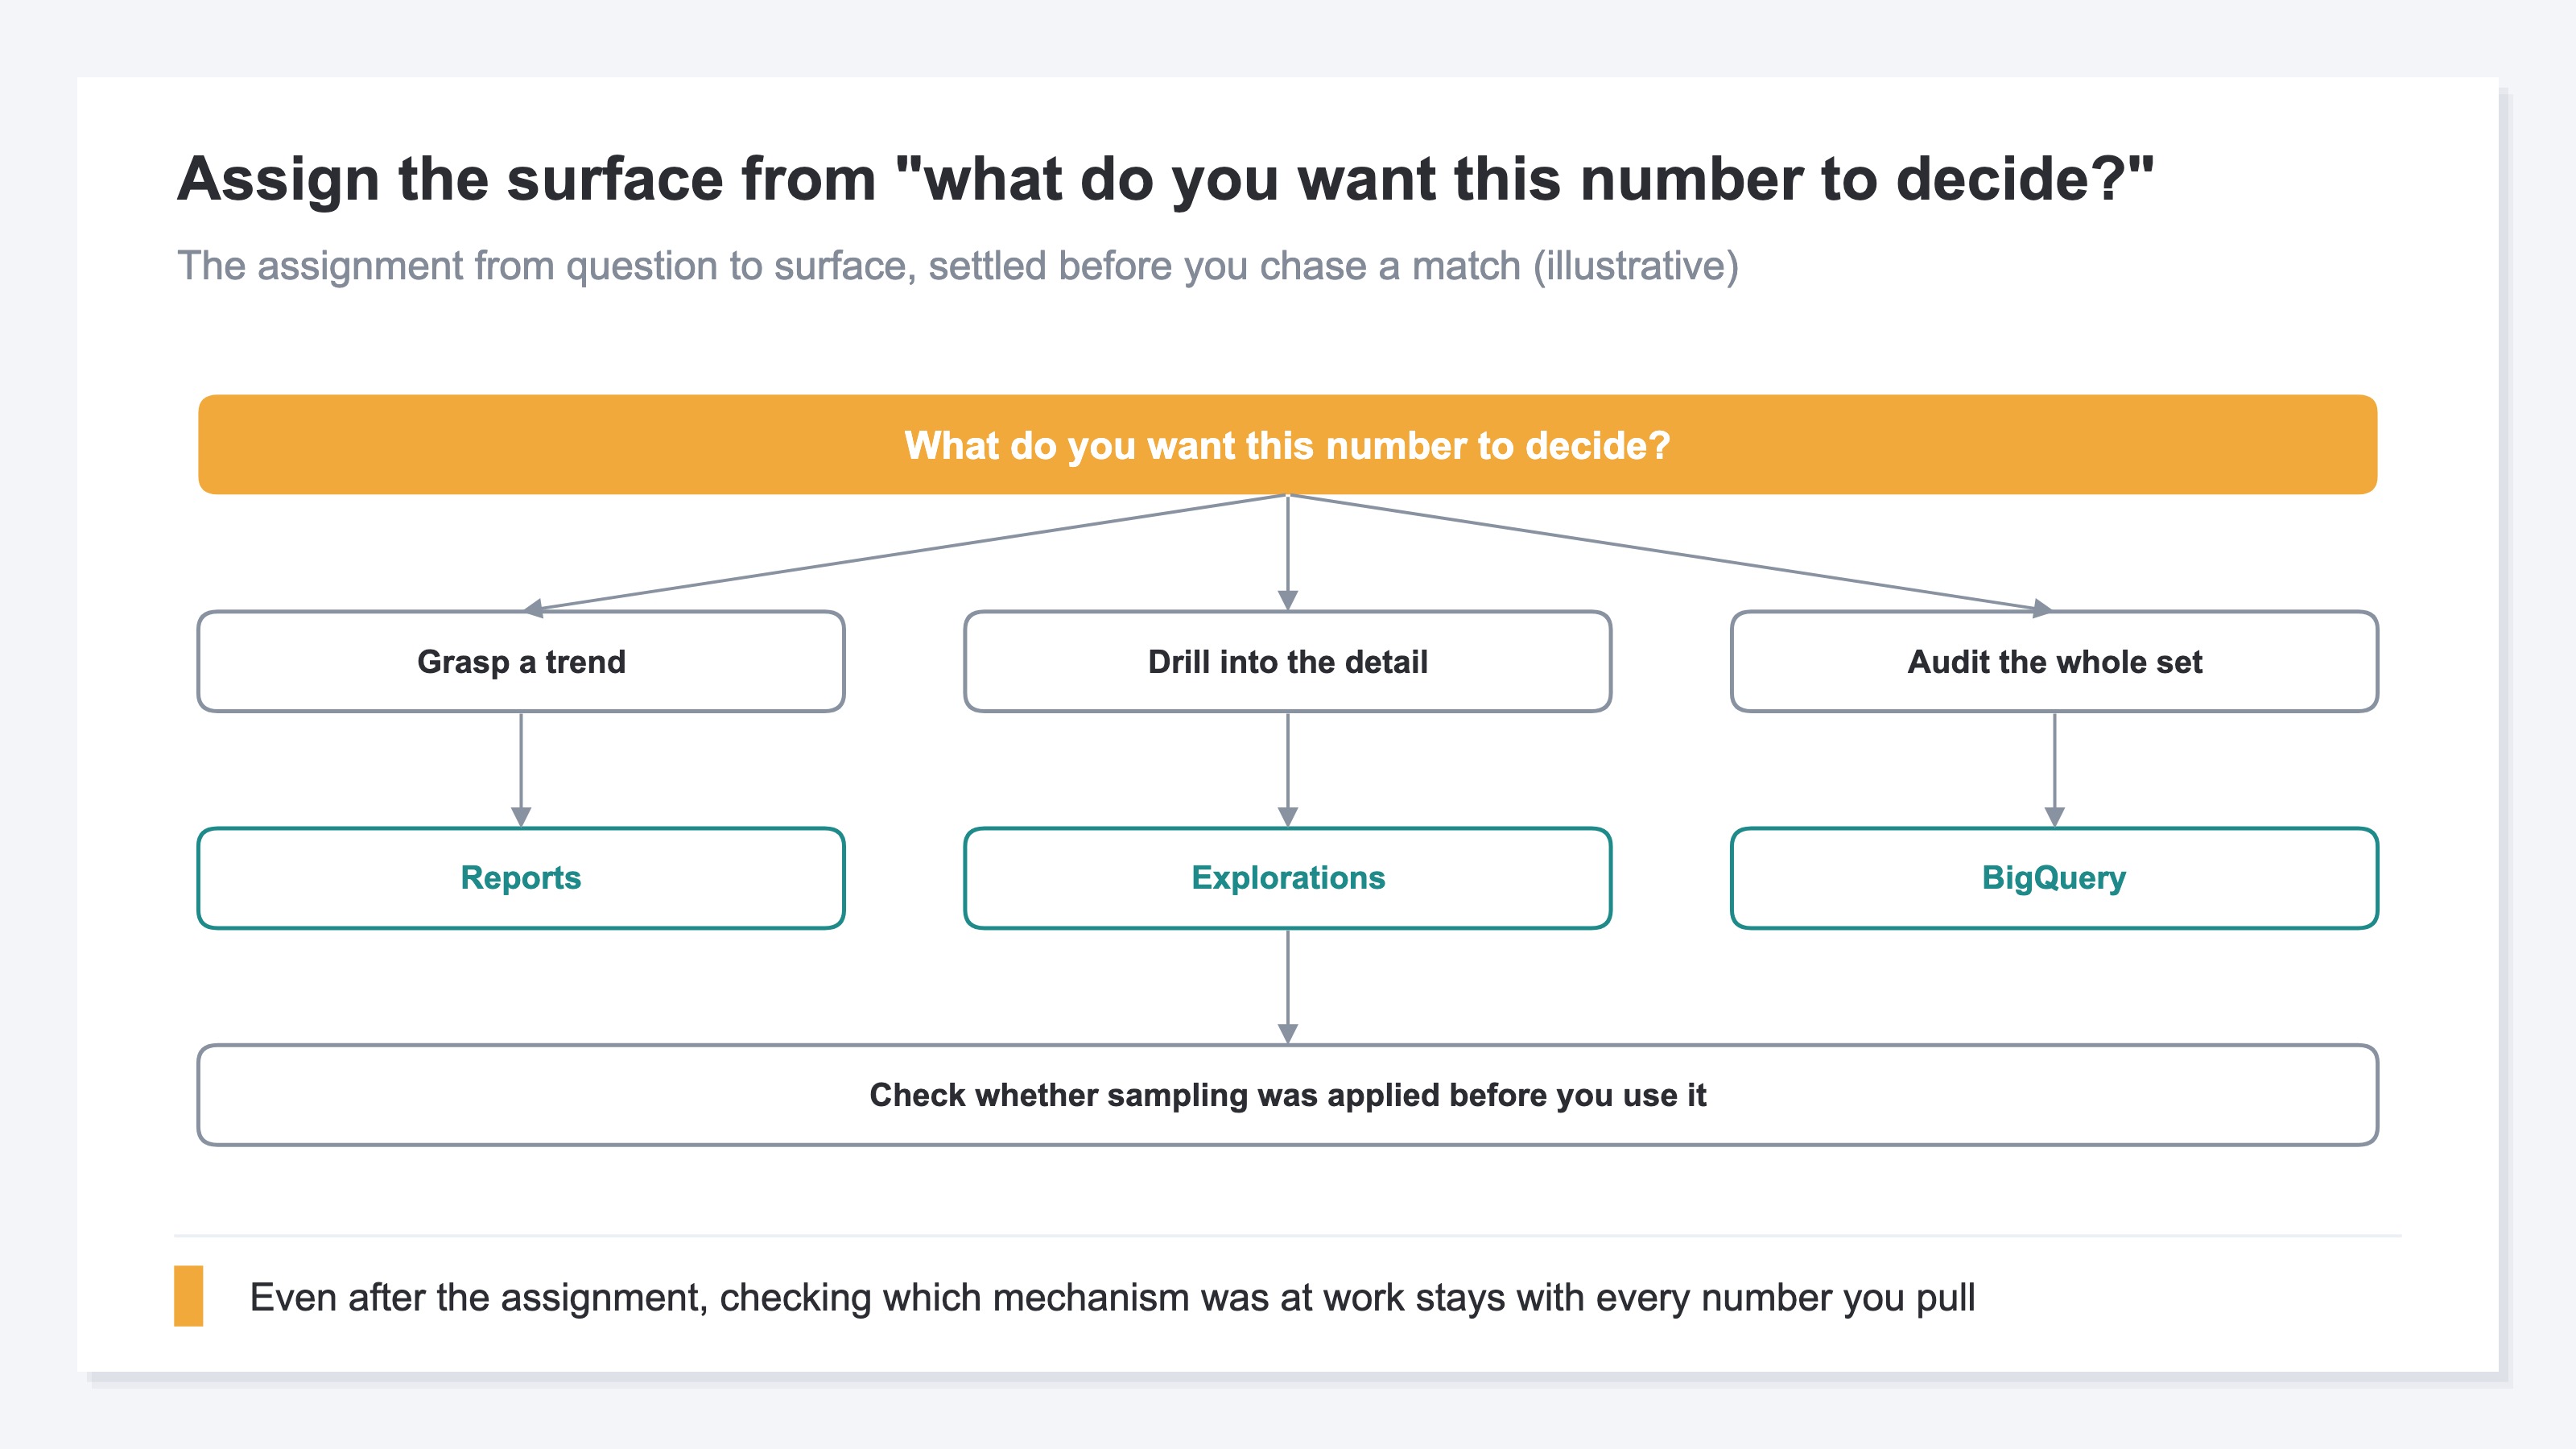
Settle the order, too. Isolating which of the three mechanisms was at work is not a goal in itself. It is the means of deciding which question the number in front of you may be used for. Stop at the isolation, and the next aggregation over a different period starts the same investigation over again.
This assignment is also not something you build once and are done with. Whether sampling applies changes every time with the period and the event count, and condensing into (other) and data thresholds appear or disappear with the conditions. Every time a number comes out, checking which mechanism was at work this time, and carrying that explanation alongside the number, is a repetition that stays.
Run that repetition by hand and the process looks like this. Every time you pull a number, note which surface it came from, the period, whether sampling was applied and whether an (other) row was present. When you compare against last month's number, match those notes up first and confirm the conditions of the aggregation were the same. If they differ, separate a difference in mechanism from a real change before you put it in the report. What sets the speed of a decision is not the time spent reading the numbers. It is this repetition of preparation.
RevenueScope solution
For a question that is answered by tying it to revenue, such as which channel is working for revenue, the choice of surface stops being something you have to agonise over. RevenueScope takes that question on and returns sessions, revenue and RPS (revenue per session) for each channel in a single table. The numbers are one series, from RevenueScope's own measurement, and the same question is answered with the same definition every time. It is not a replacement for GA4's surfaces. It is a complement that takes on the investment-decision question.
Ask ChatGPT or Claude over MCP for sessions, revenue and RPS by channel over the last 30 days, and the answer comes back in this shape. For the sake of the explanation, the figures are rounded and the store is fictional: Fictional Store Largo.
Fictional Store Largo's breakdown by channel (illustrative)
| Channel | Sessions | Revenue | RPS |
|---|---|---|---|
| Google search | 4,000 | ¥520,000 | ¥130 |
| Meta | 2,500 | ¥320,000 | ¥128 |
| Direct | 2,000 | ¥200,000 | ¥100 |
| Referral | 1,000 | ¥70,000 | ¥70 |
| Yahoo! search | 500 | ¥30,000 | ¥60 |
Note: this table is one illustrative example placed here for the explanation, and both the store and the figures are fictional, rounded values. What the demo screen reads is the sample store's sample data (refreshed daily), so the figures and the set of rows will both differ from the table above depending on the day you open it.
The top of the RPS column is Google search at ¥130 and Meta at ¥128, ¥2 apart. However long you stare at that ¥2, the next allocation doesn't come out of it. The condition that settles the order sits outside this table: the attribution model, the rule for assigning one sale to the channel of one touchpoint. Reading the last touchpoint is last_touch, reading the first is first_touch. Switch to first_touch and Meta's revenue rises from ¥320,000 to ¥440,000. Google search falls from ¥520,000 to ¥400,000. The total of ¥1,140,000 and the sessions column don't change. What changes is the cast: read from the first touchpoint, Meta steps forward as the entrance.
So here too, what decides is the question. If the question is how to add entrances, the first_touch surface answers it. If it is how to credit the final push, the last_touch surface does. The same shape of assignment settled in the body carries straight over into how this table is read.
FAQ#
Frequently asked questions#
Q. In the end, which should I believe, the exploration or the report?
A. Both are correct numbers, exactly as designed. What you choose on is not correctness but the question: the reports for grasping a trend, explorations for a drill-down built out of conditions.
Q. Is there a way to stop sampling in explorations completely?
A. Sampling can occur when the number of events used in an aggregation exceeds the quota limit[2]. The limit is 10 million events for standard properties[2]. Shortening the period to bring the event count inside the limit makes it less likely, but it changes every time with the conditions. Use explorations on the assumption that you check for it on each number that comes out.
Q. Can the breakdown condensed into the (other) row be returned to its original rows?
A. The (other) row is what the rows past the table's limit were condensed into, on a high-cardinality dimension with more than 500 unique values in one day[1][4]. The response is to revisit the unit of aggregation or the period so the row count fits inside the limit.
Q. If we connect BigQuery, does all of this gap go away?
A. The BigQuery export has neither sampling nor condensing into (other) applied to it[1], but on standard properties there is a limit of 1 million events per day[1]. You also write the aggregation SQL yourself, so what it suits is the question of auditing the whole set. There is no need to move grasping a trend over to it as well.
Summary#
The gap between exploration numbers and report numbers comes out of GA4's design, not out of a mistake in the settings. Three mechanisms, sampling, the (other) row and data thresholds, work surface by surface, so the same period and the same metrics still don't produce matching numbers.
That is why the work of chasing a match has no exit. What gets decided first is which number answers which question. Trends to the reports, detail drill-downs to explorations, whole-set audits to BigQuery: that assignment is the starting point. On top of it, the repetition of checking which mechanism was at work, every time a number comes out, is the one thing that stays.
Numbers that fail to agree across tools, like GA4 revenue against Shopify, are a different axis from this article. Why GA4 revenue doesn't match Shopify lays that one out.
The next time you find a gap between two numbers, will the first thing you ask be which one is right? Or will it be what you want this number to answer?
See which ads actually drive revenue, at a glance
Free up to 2,000 sessions/month, AI connection included. No credit card required. Up and running in 5 minutes.