Looking at a GA4 report, have you ever seen a row that should be there simply gone, fine-grained traffic sources bundled together into "(other)", or numbers hidden behind a hyphen? It is tempting to suspect a bug, but most of the time it is by design.
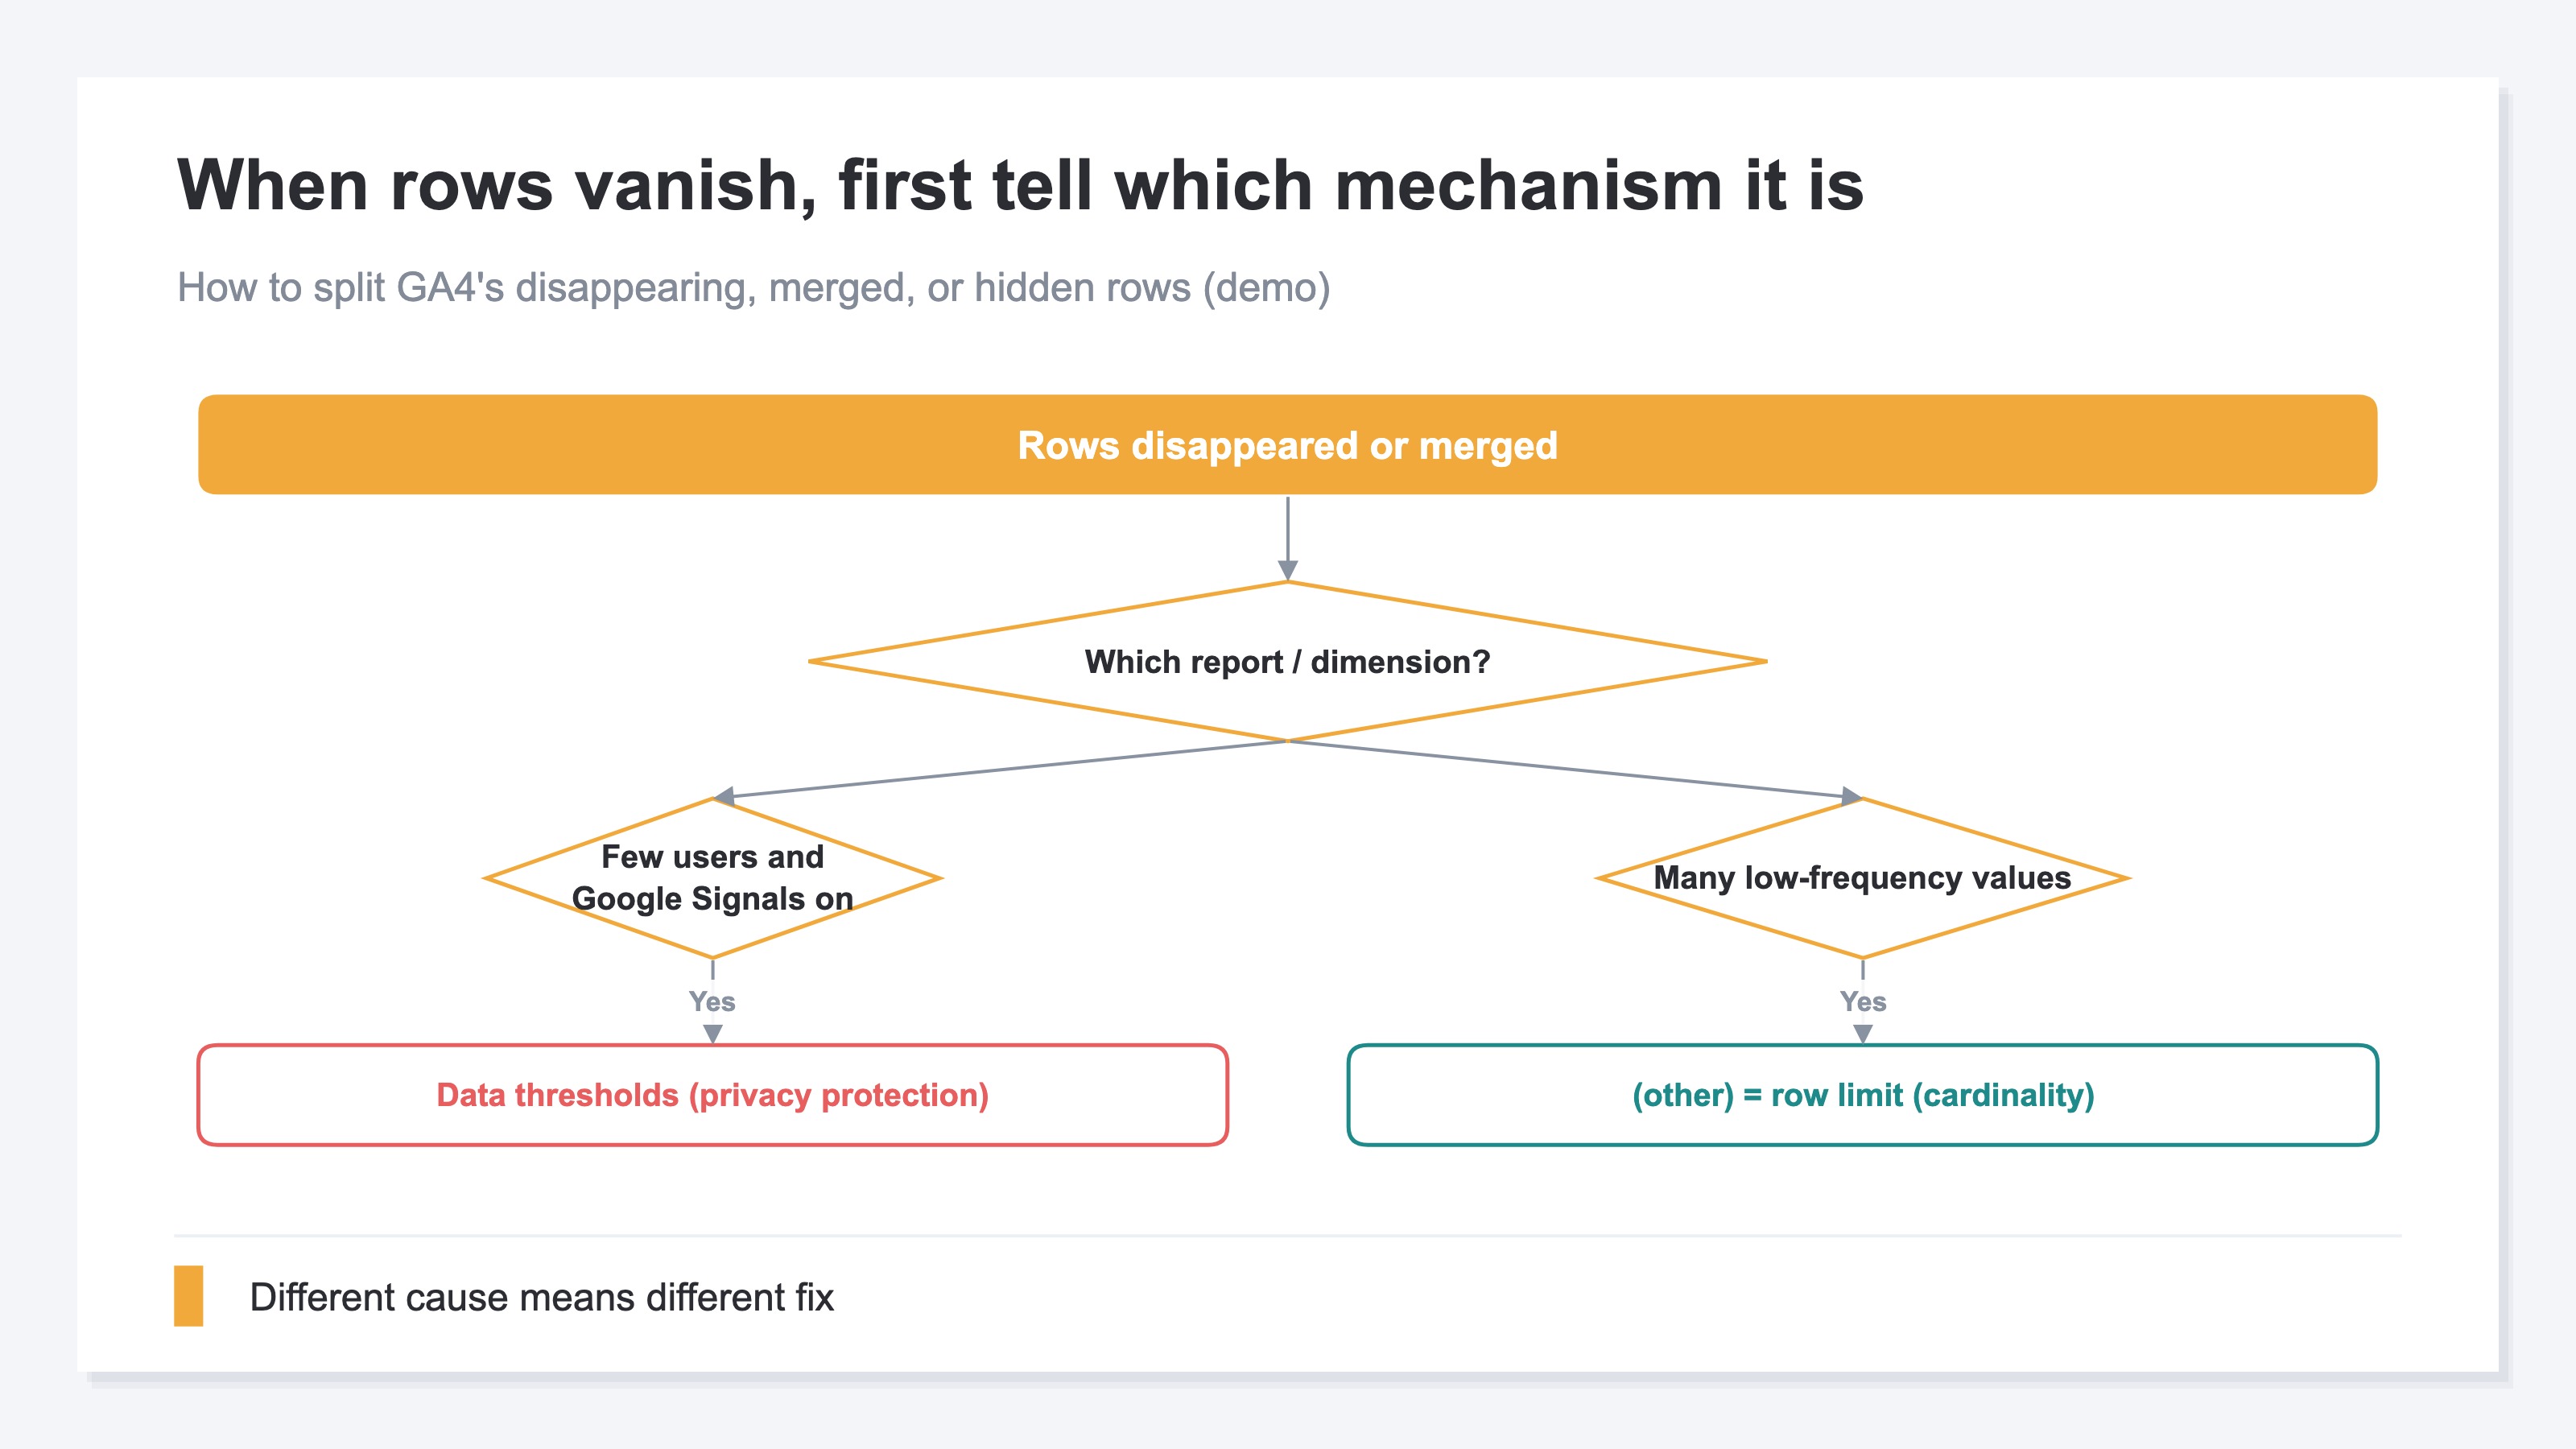
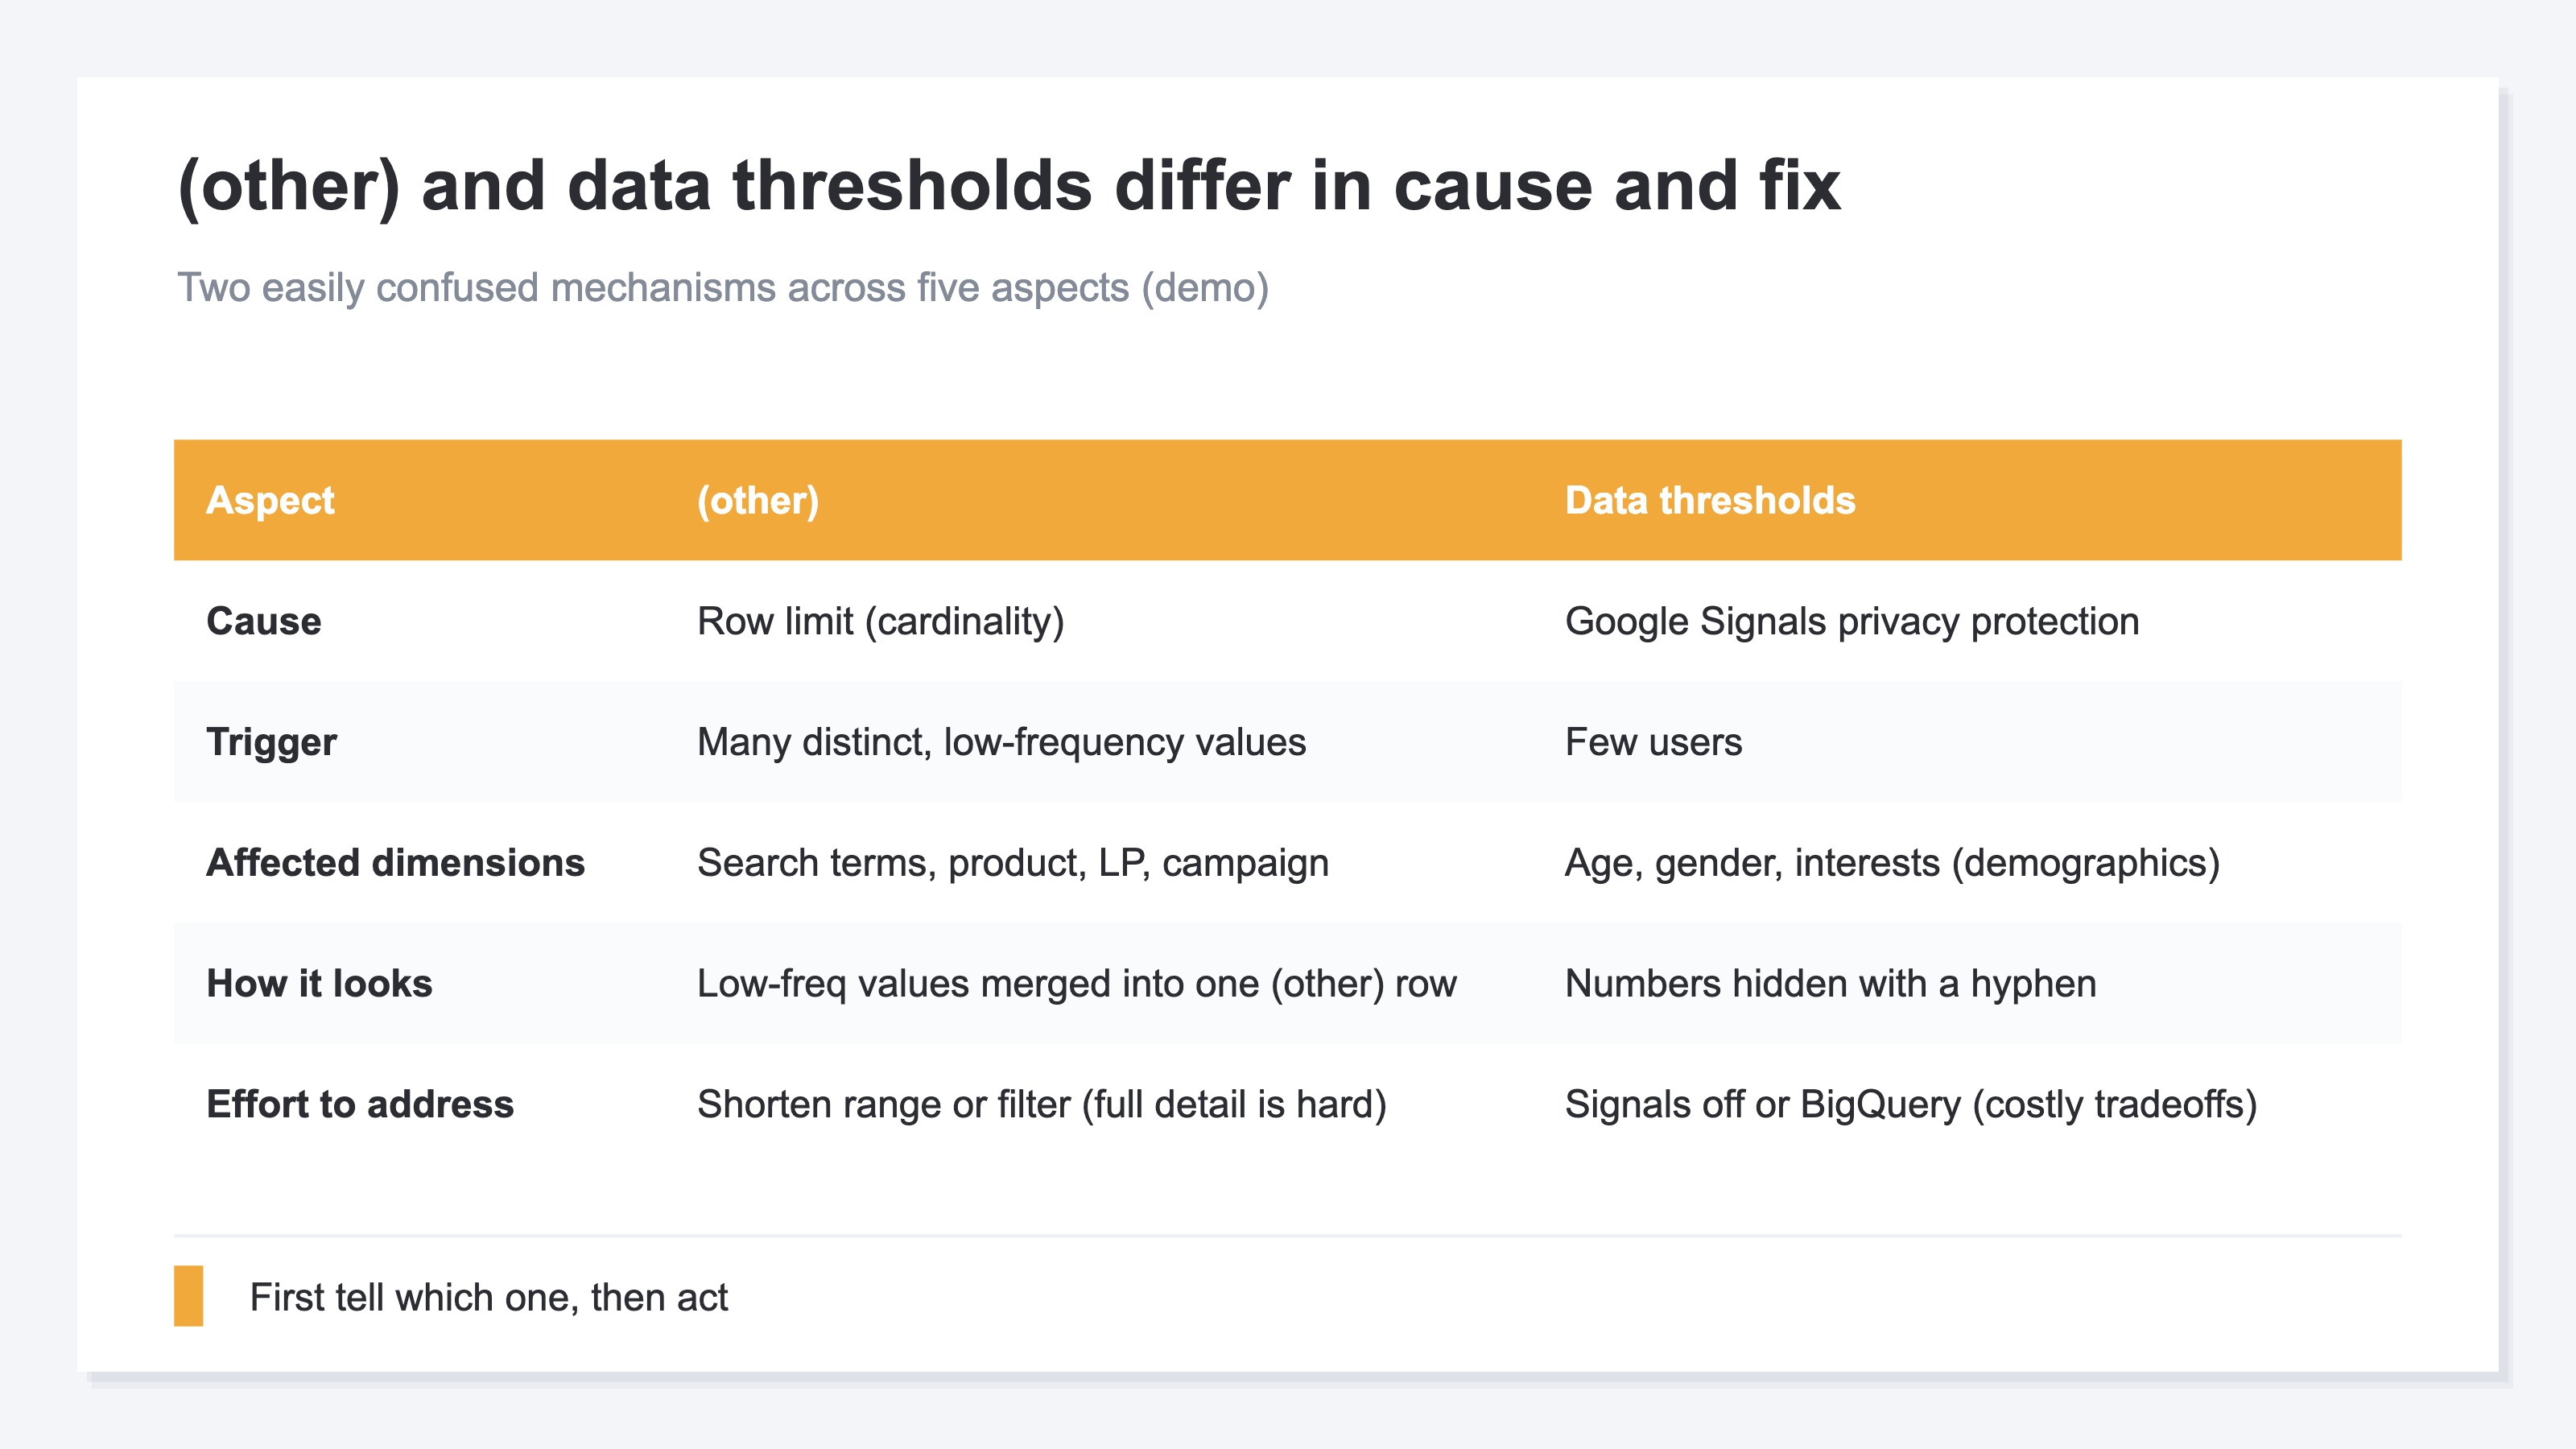
Here is the conclusion up front. In GA4, "rows disappearing" comes from two mechanisms with different causes. One is aggregation into "(other)"; the other is "data thresholds." The former bundles low-frequency values because of a row-count limit; the latter hides numbers to protect individuals when Google Signals is on. Different causes, so different fixes. This article explains how to tell the two apart — and a way to read revenue that neither rounds nor hides in the first place, with real data.
Contents
TL;DR#
-
GA4 rows disappear for two reasons — and they are different mechanisms
"Aggregation into (other)" and "data thresholds" have different causes. Mix them up and you fix the wrong thing
-
(other) = aggregation from a row-count limit (nothing to do with privacy)
There is a limit on how many distinct values GA4 can handle, and the low-frequency values beyond it get bundled into "(other)"
-
Thresholds = privacy protection when Google Signals is on
When the user count is small, some numbers are hidden so individuals cannot be identified. Most visible in age and gender reports
-
Neither is a blind spot in RevenueScope
It shows RPS and AOV by source without rounding, and reports revenue that could not be attributed honestly, in an Unattributed row
1. Two mechanisms behind GA4's missing rows#
Bottom line: when GA4 "loses rows," "bundles fine-grained sources," or "hides numbers," two mechanisms with different causes are at work. Telling "which one is happening" apart is the first step to fixing it.
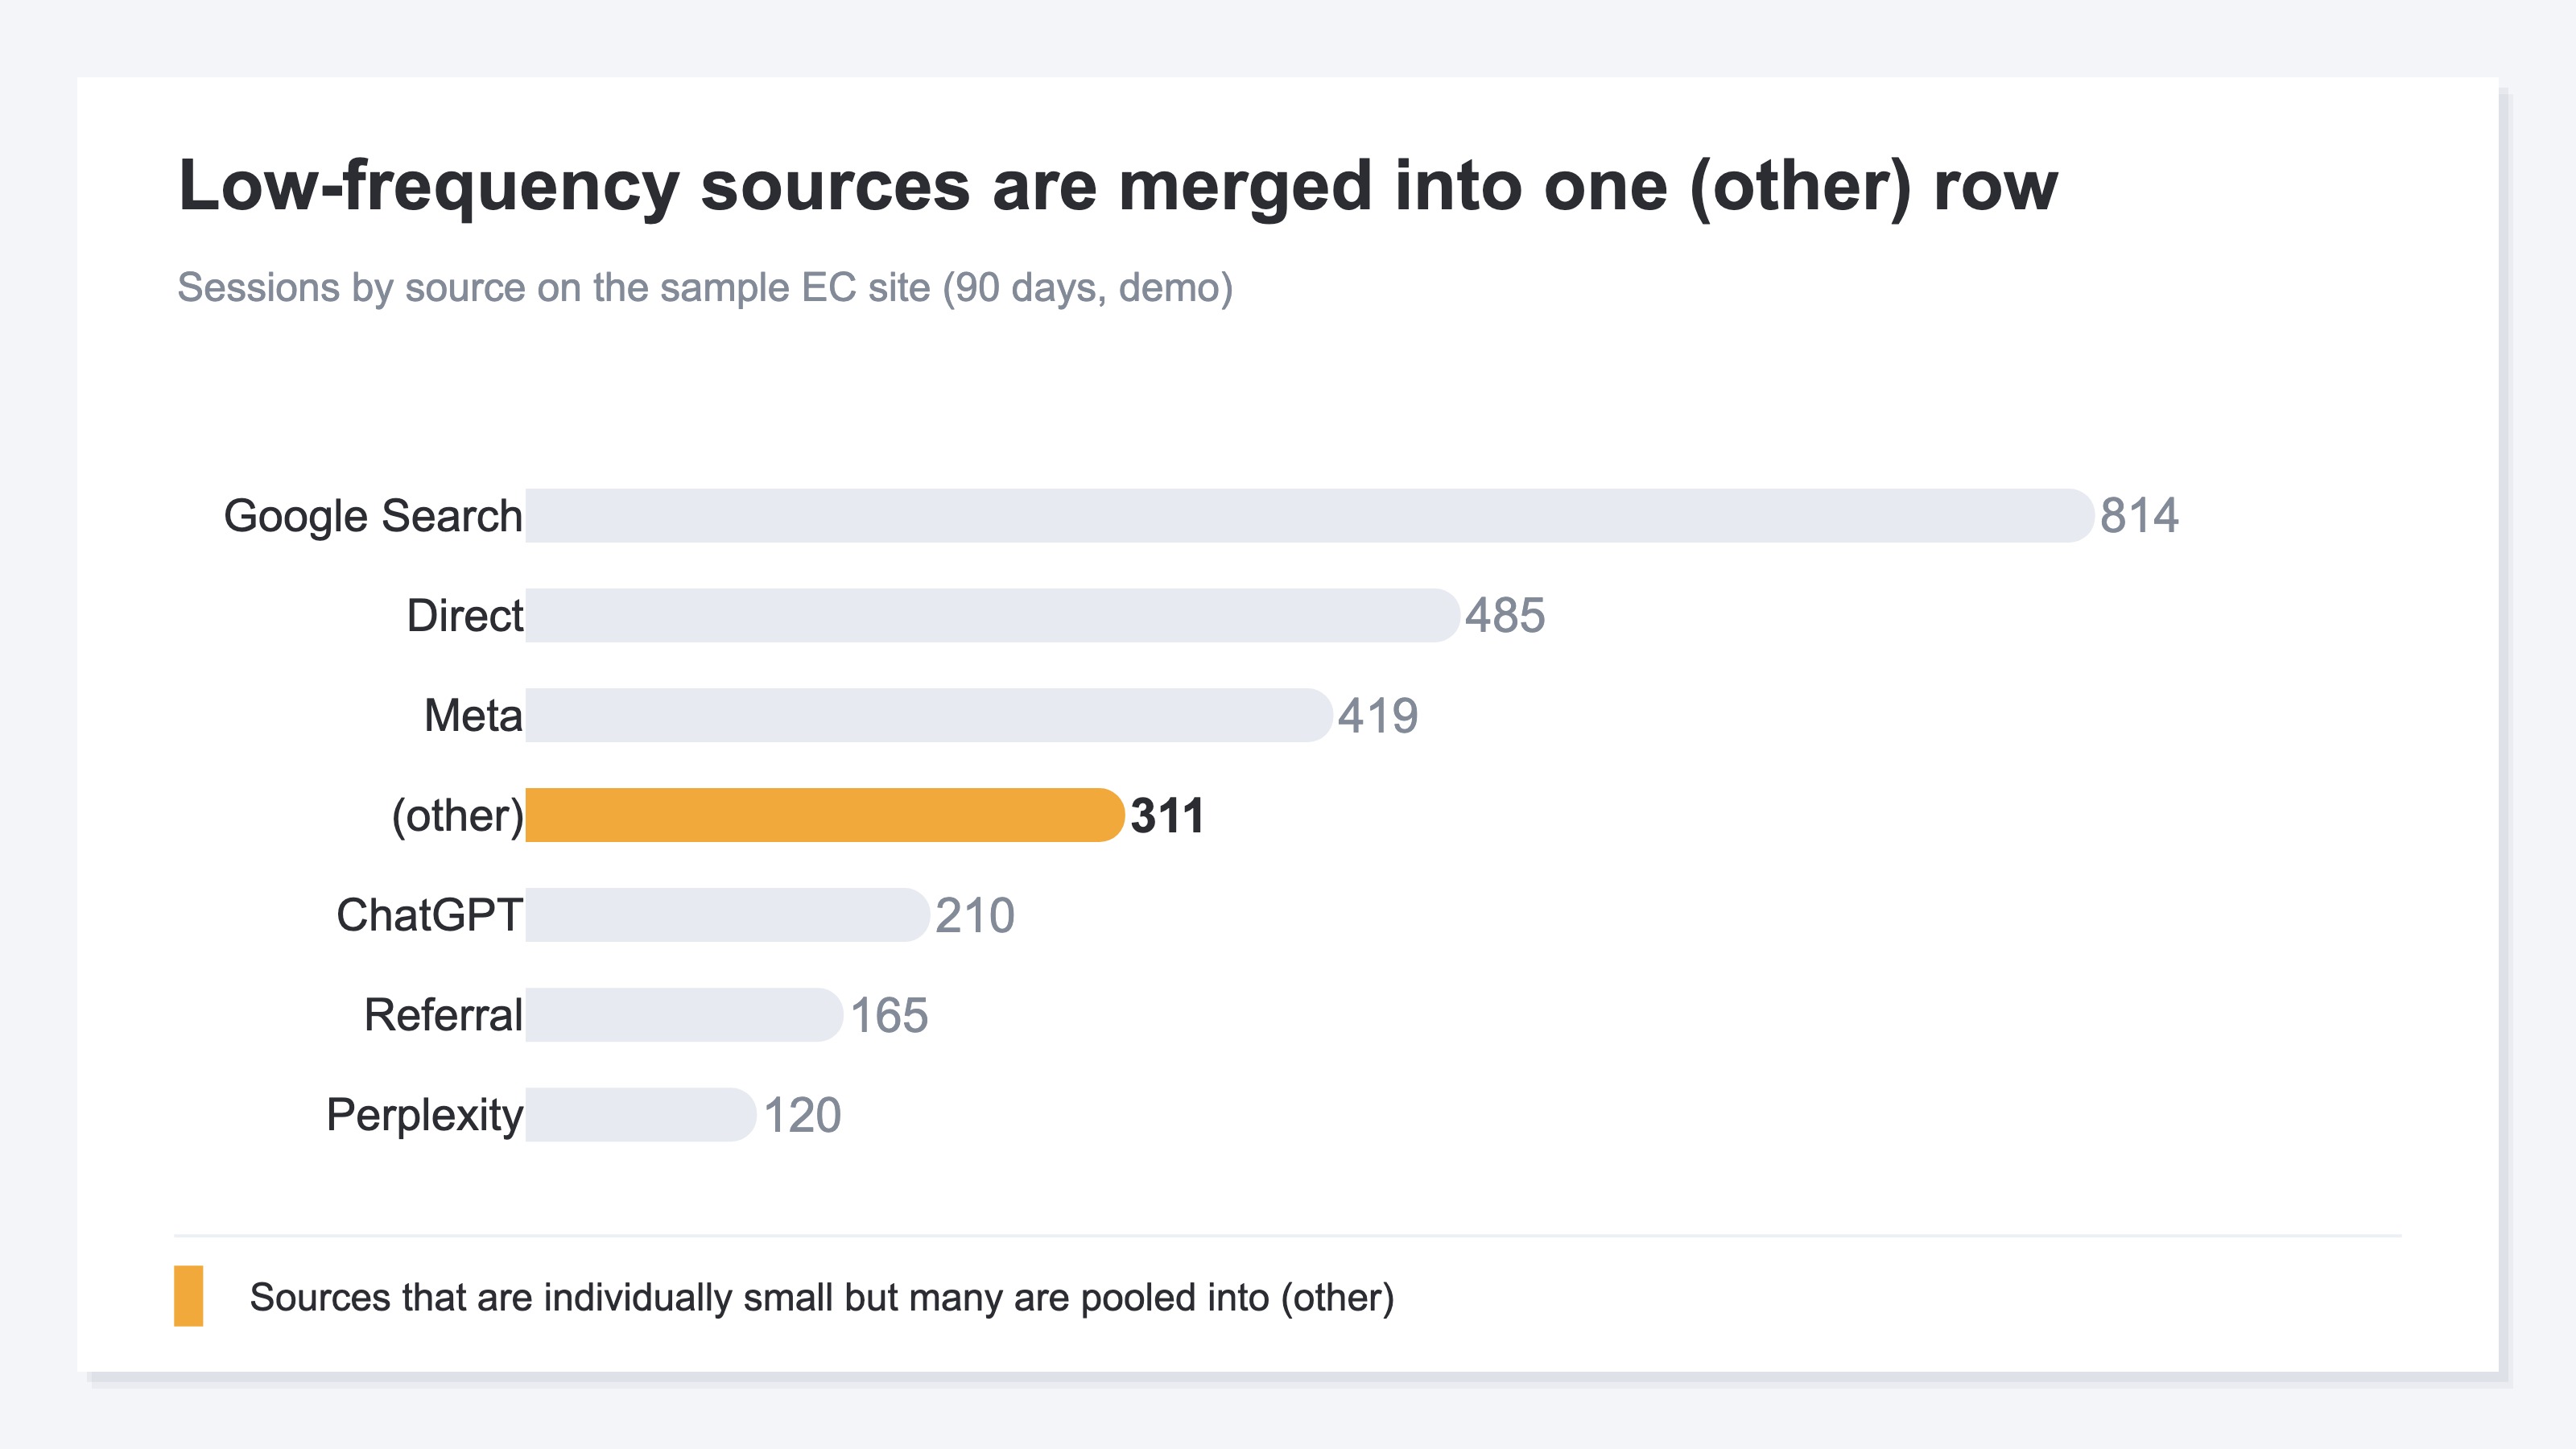
The first is aggregation into "(other)." There is a limit on how many values (rows) GA4 can handle at once, and low-frequency values beyond that limit get pushed together into a single "(other)" row. It has nothing to do with privacy.
The second is "data thresholds." When Google Signals is on, GA4 automatically hides some numbers so that individuals cannot be identified in data with a small user count. It stands out most in age and gender reports.
The clues for telling them apart are the type of report and your Signals setting. If "(other)" shows up in a dimension with many distinct values (search terms, product names, campaigns), it is cardinality. If numbers get hidden in a demographic report when the user count is small, a threshold is the likely cause.
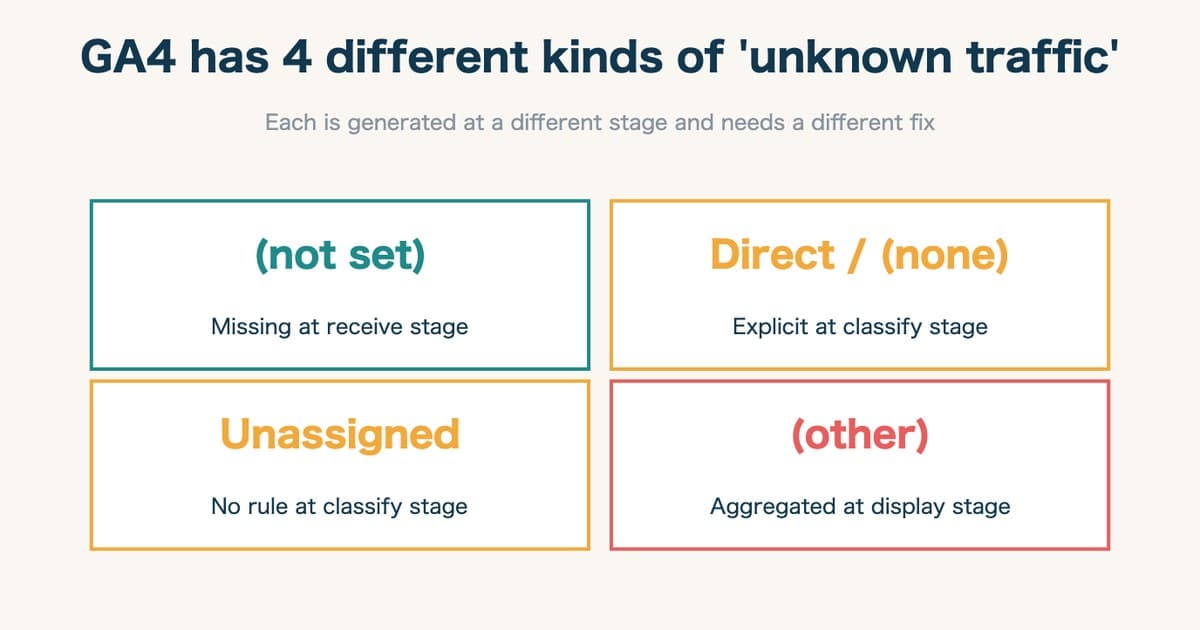
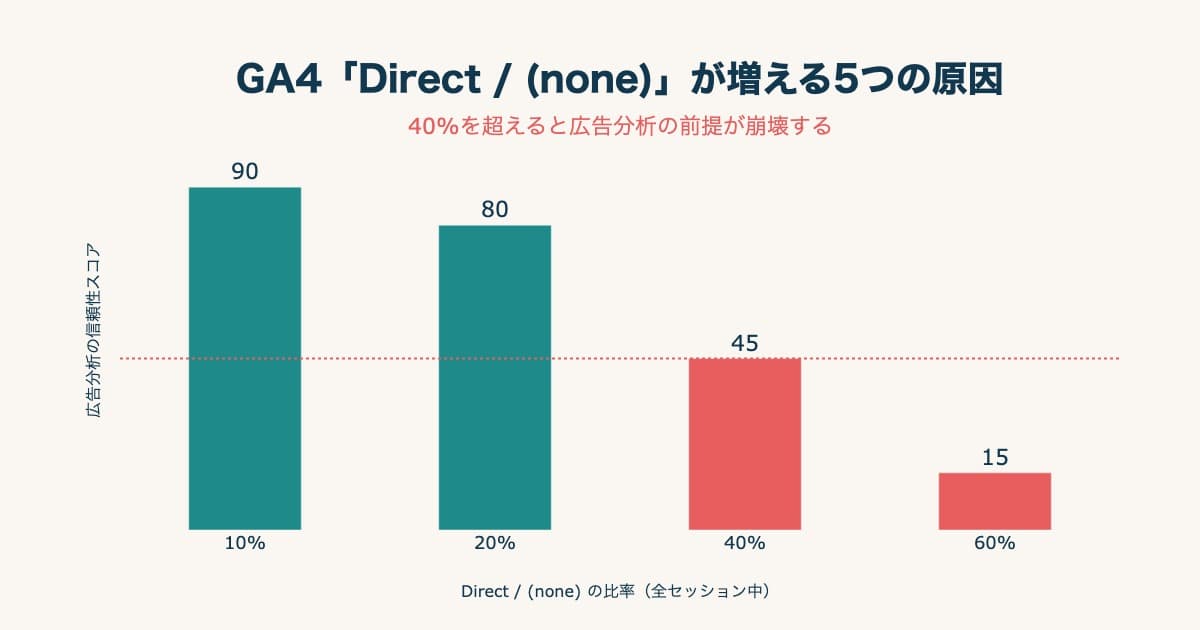
Note that a source landing in not set or unassigned "because GA4 could not decide which channel it was" is a separate story. That is a classification problem, on a different axis from this article's "the row itself never appears, or gets rounded away" (the difference between GA4's (not set) and (other)). Sources skewing toward Direct or (none) also have a different cause (why GA4's Direct/(none) grows).
2. (other) is a cardinality limit#
Bottom line: "(other)" is a row that bundles low-frequency values together because GA4 has a limit on how many distinct values (rows) it can handle at once. It happens for processing reasons, not for privacy.
Cardinality is how many distinct values a dimension contains. It becomes a problem in dimensions with thousands or tens of thousands of values — search terms, product names, landing pages, campaigns. GA4 keeps the most-shown values as individual rows first, and bundles everything beyond the limit into "(other)."
So the contents of "(other)" are a collection of low-frequency values, each small on its own but many in number — a long tail. When this swells, the numbers for fine-grained sources or per-product break-outs stop being visible. We do not assert the exact row count here, because the published figure can change, but it is enough to remember: the more distinct values a dimension has, the more easily it gets rounded into "(other)."
The fixes point toward shortening the date range or narrowing the scope with filters. Even so, seeing every low-frequency value fully broken out is, realistically, hard within the range of standard reports.
3. Data thresholds are Google Signals privacy protection#
Bottom line: a "data threshold" is a mechanism where, when Google Signals is on, GA4 automatically hides some numbers to keep individuals from being identified in data with a small user count. It stands out most in age, gender, and interest reports.
Google Signals is a feature that uses the information of signed-in Google users to enable cross-device analysis and estimates of age and gender. Handy, but with a small-sample dataset there is a risk that "the one person who fits this condition must be them" — an individual gets exposed. So GA4 automatically hides data where the head count falls below a threshold.
There are three clues for spotting it. It tends to happen in demographic reports. Numbers vanish when you shorten the range or filter narrowly. And the report carries a marker noting that a threshold has been applied. Both the trigger and the target differ from "(other)," which rounds because there are too many values.
Known directions for avoiding it are turning Google Signals off, or exporting raw data to BigQuery. But each has a cost. Turn Signals off and you avoid the threshold, but you also lose the demographic information itself — age, gender, and so on. Exporting to BigQuery is technically heavy to set up and operate, and does not run as a side task. It is realistic to understand that neither is a workaround you can use lightly in day-to-day operations — a "try it once" is one thing.
RevenueScope's solution
Bottom line: RevenueScope shows average dwell time, RPS, and bot-excluded sessions by source, one row at a time — without rounding away the low-frequency sources. It does not bundle them into "(other)" at a limit or hide them behind a threshold like GA4. It does not restore GA4's (other); it is designed not to have the same blind spot in the first place.
RPS is revenue per single visit, calculated by dividing revenue by session count (what RPS means and how to use it). Let's look at real demo data. Over 90 days at the sample EC store, even the fine-grained sources each stay as their own row.
Sessions and RPS by source (90 days, sample EC)
| Source | Sessions | RPS |
|---|---|---|
| Google Search | 814 | 304 yen |
| ChatGPT | 210 | 622 yen |
| Gemini | 77 | 431 yen |
| Copilot | 25 | 376 yen |
| Bing | 23 | 0 yen |
Fictional EC with sample data (RevenueScope demo)
Bing with only 23 sessions and Copilot with 25 both stay as their own row instead of being bundled into "(other)." So a "small but selling" source and a "getting traffic but not selling" source can both be compared side by side, as they are. The same holds at the search-query level: for each search term it keeps "how much it contributed to revenue" as an estimated figure (estimated contribution per search term, not revenue per product). For instance, at this sample EC the search term "organic cotton t-shirt" had an estimated revenue of about 340,000 yen. This estimate leans conservatively low, and because it is derived from GSC it covers Google Search only and comes with a 2-3 day delay.
RevenueScope's numbers come from its own measurement and complement GA4. It specializes in revenue by source, page, and search query, and excludes bot inflation based on behavior (how bots distort your traffic sources). Without rounding or hiding, it gets you to a state where revenue by source can be compared side by side. That is what RevenueScope does.
FAQ#
Q. Is there a setting to get rid of "(other)"?
There is no setting to remove it completely, because the cardinality limit is by design. Shortening the date range or narrowing the scope can make "(other)" smaller. But seeing every low-frequency value as-is is, realistically, hard within the range of standard reports.
Q. Can data thresholds be turned off?
Turn Google Signals off and you avoid the threshold. But you lose demographic information itself, like age and gender. Exporting raw data to BigQuery is another direction, but it is technically heavy to set up and operate and does not run as a side task. Both are choices with a cost.
Q. Can I tell whether "(other)" or a threshold is happening?
Yes. If "(other)" shows up in a dimension with many distinct values (search terms, product names), it is cardinality. If numbers get hidden in a demographic report when the user count is small, a threshold is the likely cause. The causes differ, so isolate which one it is before you act.
Summary#
If rows disappear in GA4, don't panic. There are two separate causes. "(other)" is aggregation from a row-count limit and has nothing to do with privacy. "Data thresholds" are privacy protection when Google Signals is on, and stand out in demographic reports. Isolate which one is happening first, then choose the fix. In either mechanism, GA4 rounds away or hides fine-grained sources. If you want to compare how each source contributes to revenue, switching to a way that neither rounds nor hides in the first place is the shortcut.
See which ads actually drive revenue, at a glance
Free up to 5,000 sessions/month, AI connection included. No credit card required. Up and running in 5 minutes.