
Open "Explore" in GA4's left menu and you face a wall of unfamiliar screens: free form, funnel exploration, path exploration, segment overlap. Explorations are unintuitive enough that even marketers with several years of experience end up googling how to use them every time — and struggling here has little to do with your skill level. So if Explorations makes you feel lost, it is not your fault. Here's the short answer: for ecommerce revenue decisions, you need just two explorations. This guide covers when standard reports stop being enough, and how to use those two.
Table of Contents
TL;DR#
-
Explorations is a workbench for building combinations standard reports don't offer
Standard reports are the set menu; Explorations is the buffet. You don't need to master all of it.
-
Ecommerce revenue decisions need two: free form and funnel
Free form for channel × new-vs-returning cross-tabs; funnel for finding where shoppers drop off.
-
Extend data retention to 14 months before you start
The default is 2 months — leave it unchanged and Explorations can only analyze the last 2 months.
1. What Explorations is — and how it differs from standard reports#
Bottom line: Explorations exists to build the combinations that standard reports don't offer.
GA4 has two layers of reporting. "Reports" in the left menu are standard reports — fixed screens Google assembled for you. "Explore" is a free-analysis workbench where you place any dimension in rows and any metric in columns to build your own tables and charts. If standard reports are a set menu, Explorations is a buffet where you pick the ingredients.
As covered in How to Read GA4 Reports: Ecommerce Needs Just Three, three standard reports cover day-to-day revenue checks. Explorations only enters the picture when a question comes up that those three can't answer.
One pitfall to handle first: data retention. By default, GA4 keeps the detailed data Explorations relies on for only 2 months [1]. If you haven't changed it, the moment you think "let me compare with the same month last year," the data is already gone. Go to Admin → Data retention and switch it to 14 months now.
2. When do you need Explorations? Three tests#
Bottom line: open Explorations only when your question involves a combination, a filter, or a mid-journey view.
A common pattern: teams only open GA4 when something changed — yet standard dashboards rarely answer the actual question, what changed. Standard reports tell you something moved. Digging into why means stitching screens together — and that is exactly where Explorations earns its place.
Concretely, reach for Explorations when a question matches one of these three tests.
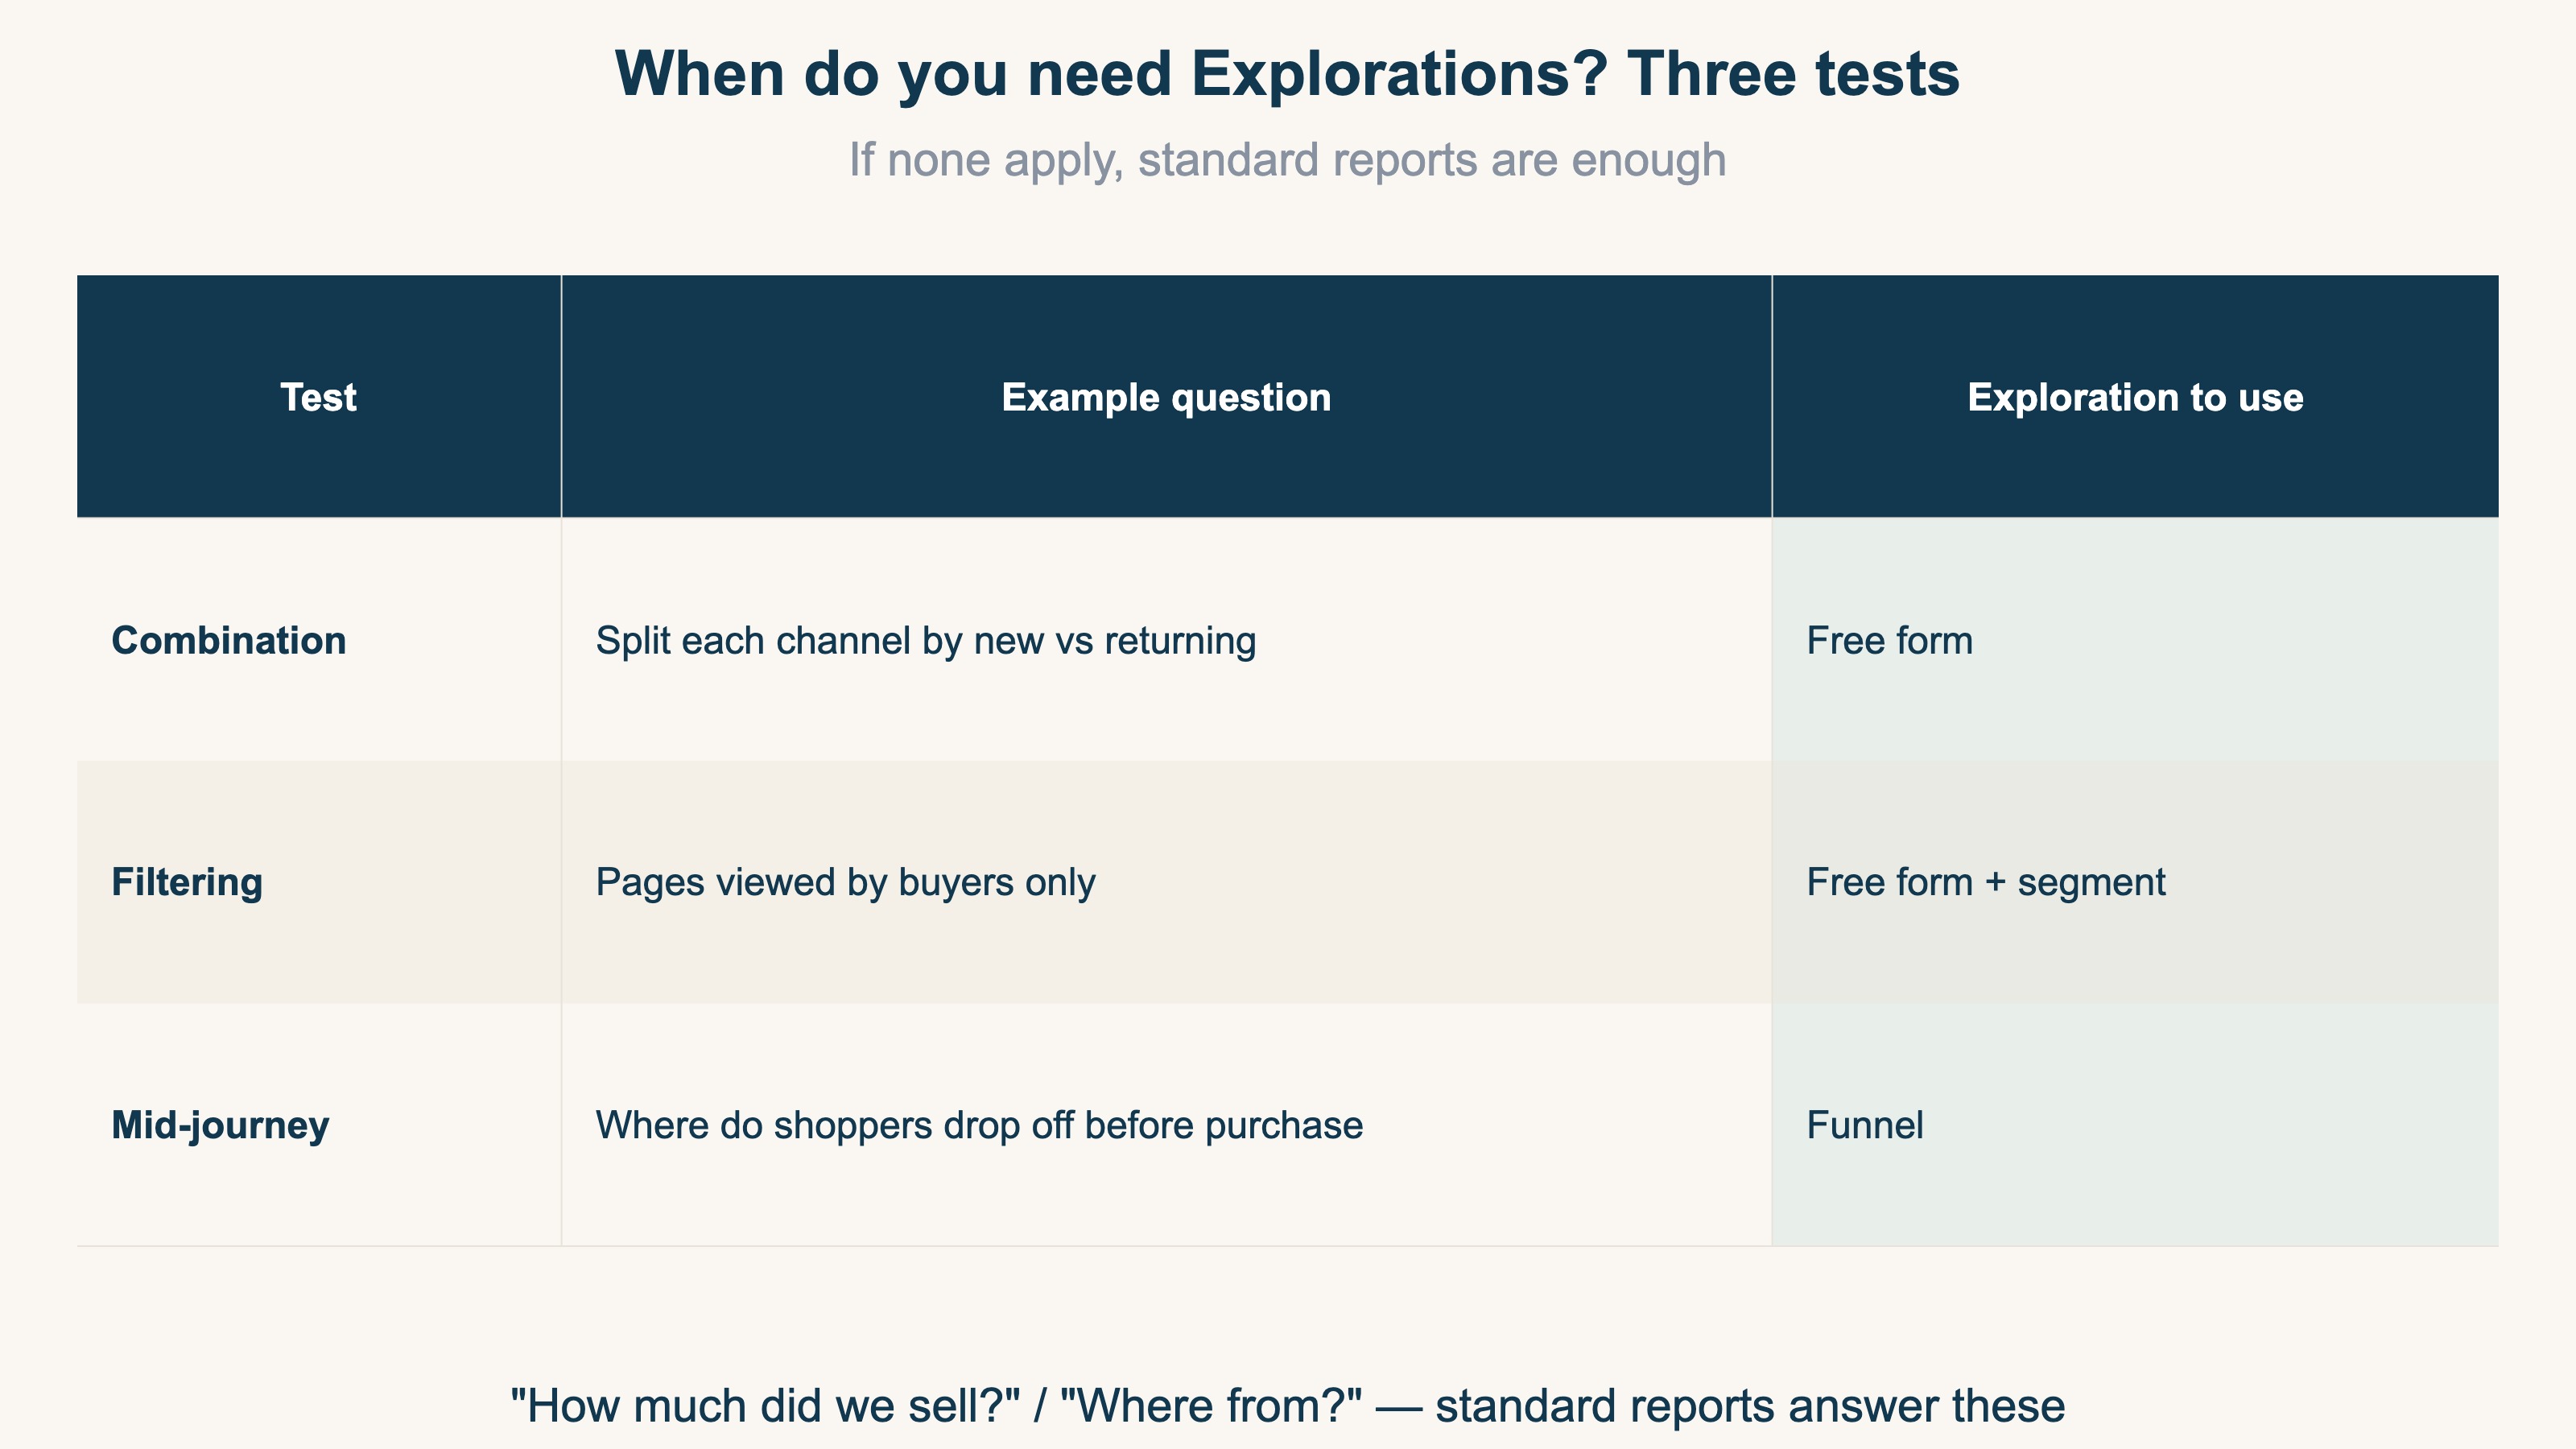
Put the other way around: questions that match none of the three — "How much did we sell this month?", "Where did visitors come from?" — are fully answered by standard reports. No exploration needed.
3. Ecommerce needs just two explorations#
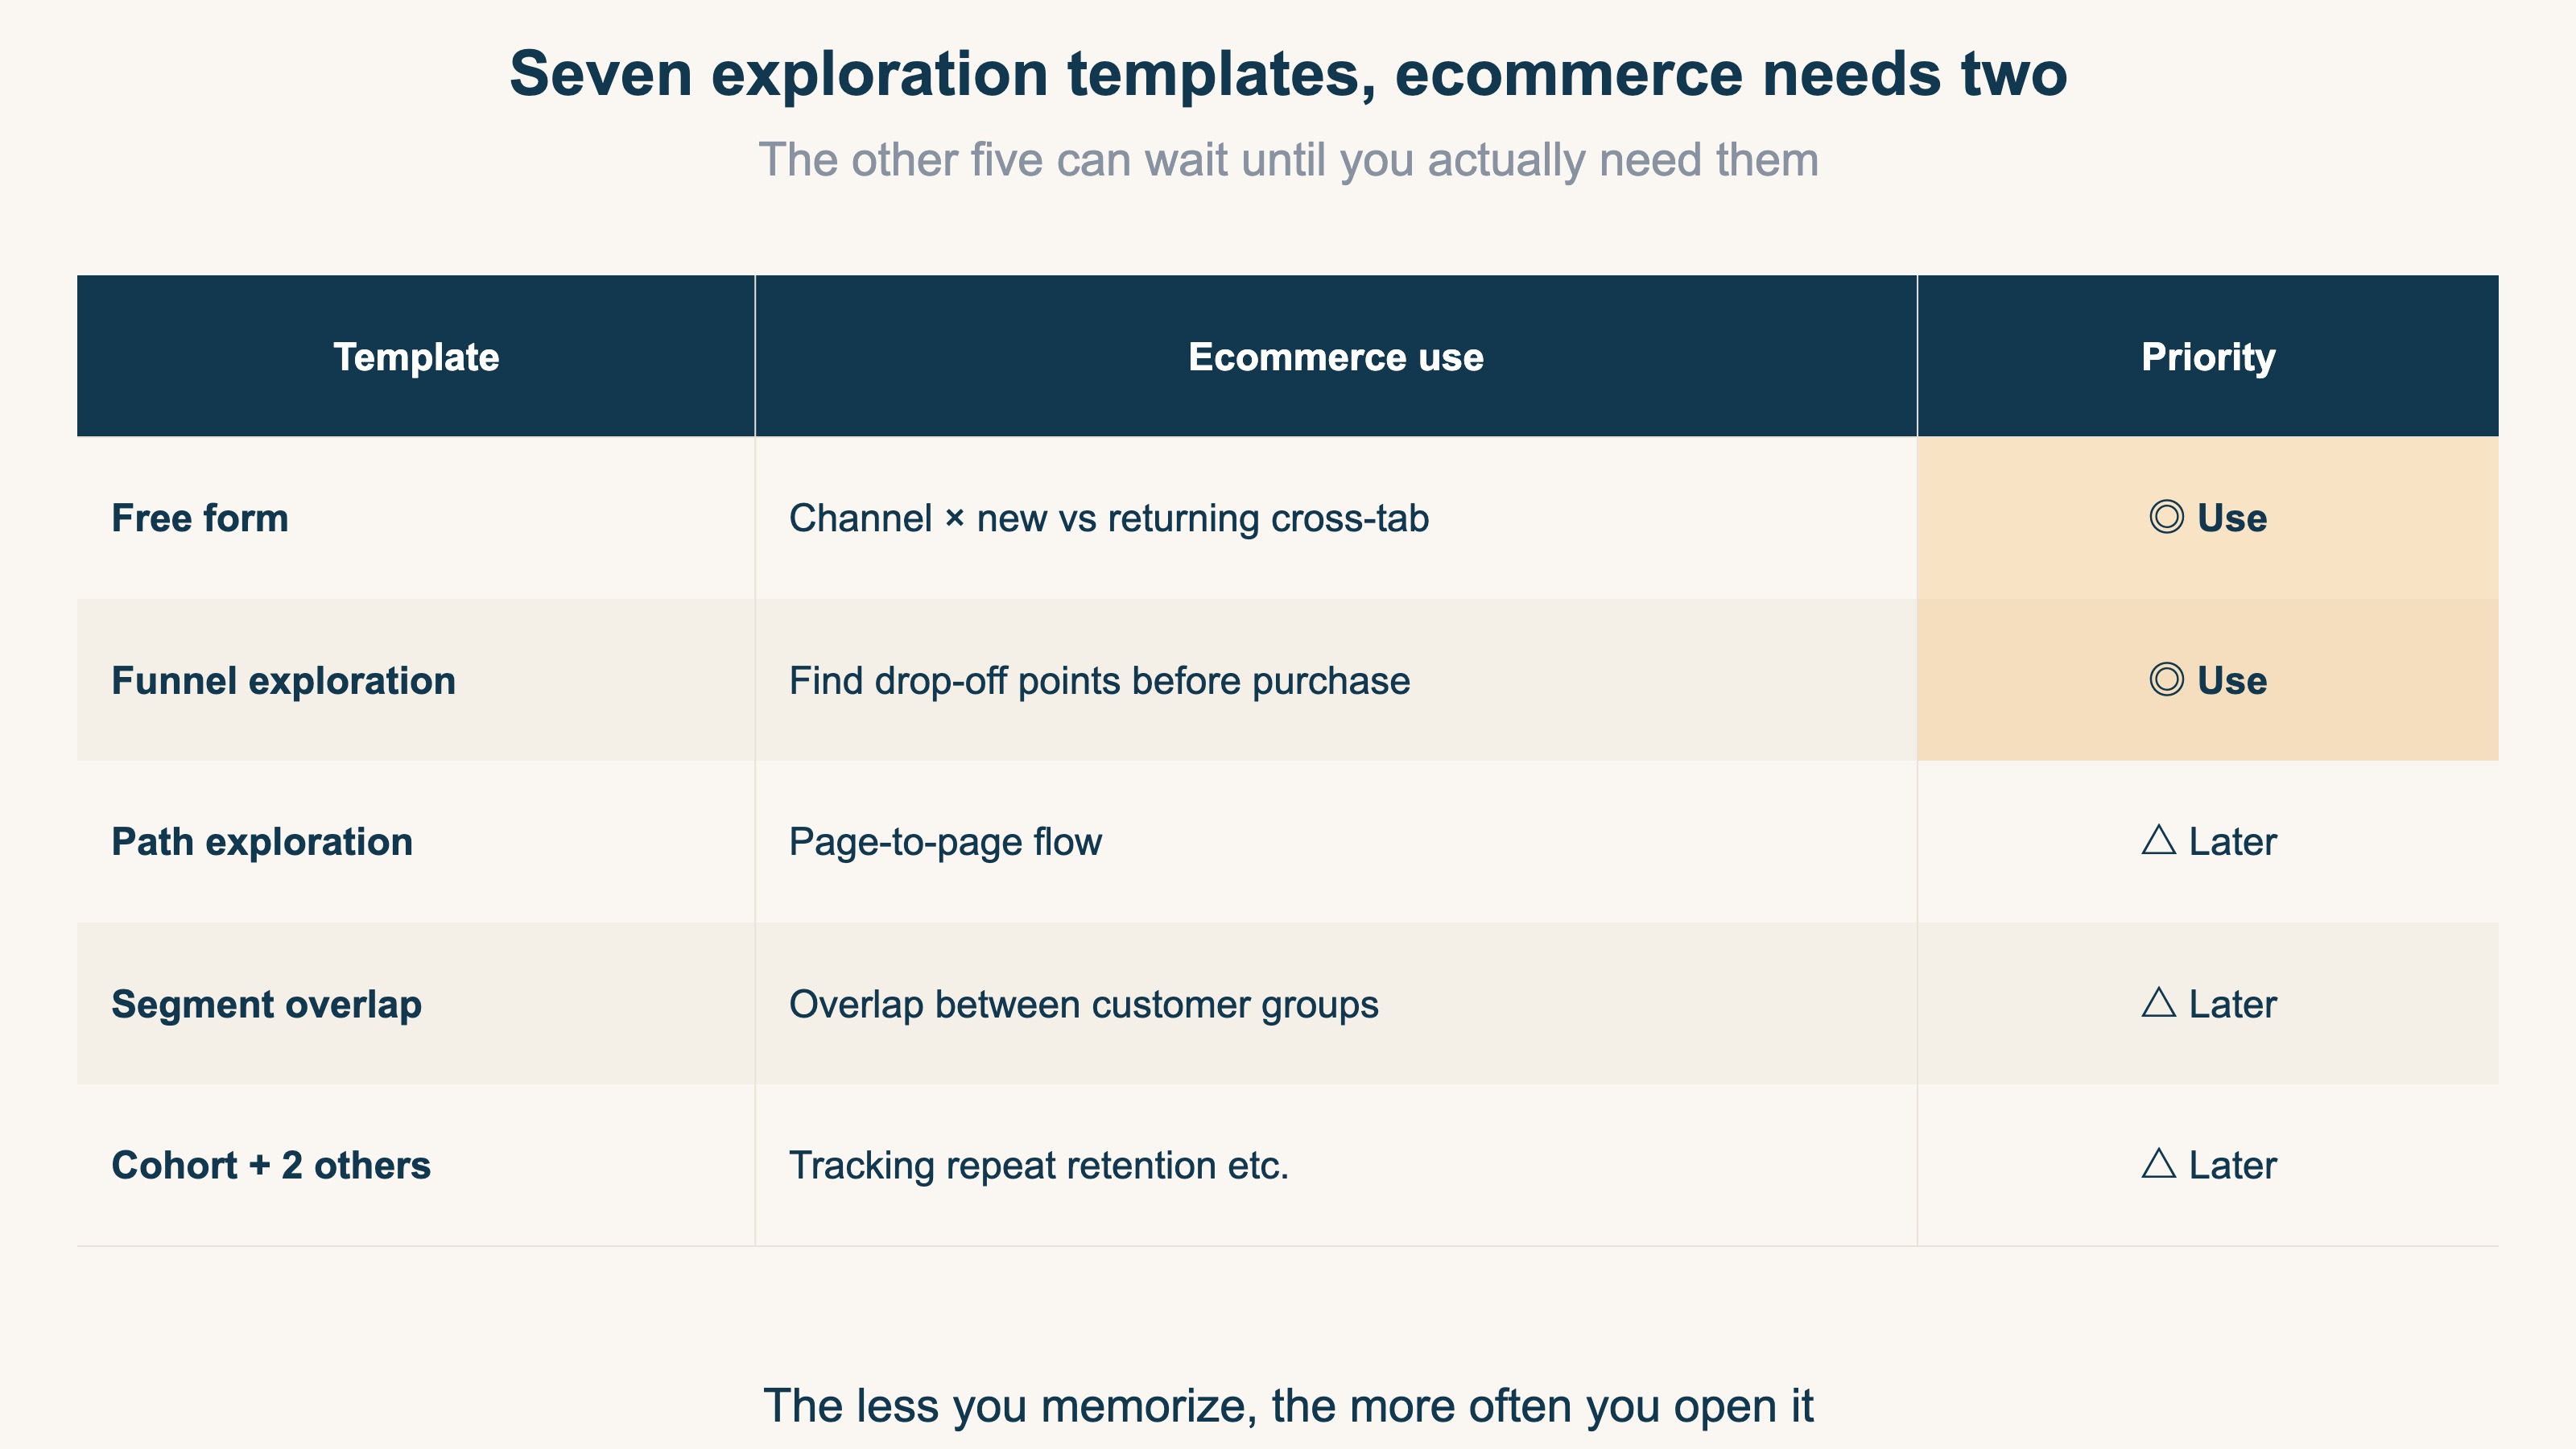
Bottom line: master "free form" and "funnel," and ecommerce revenue analysis is covered.
Explorations offers seven templates, but you don't need path exploration or cohort analysis. Even people who took a GA4 course a year ago often forget how these work — features you don't use, you forget. Two is enough.
Free form — the channel × new-vs-returning cross-tab#
The highest-payoff use in ecommerce is crossing acquisition channels with new vs returning visitors. Three steps:
- Pick "Free form," and place "Session default channel group" in rows
- Place "New / established" in columns
- Place "Purchase revenue" and "Sessions" in values
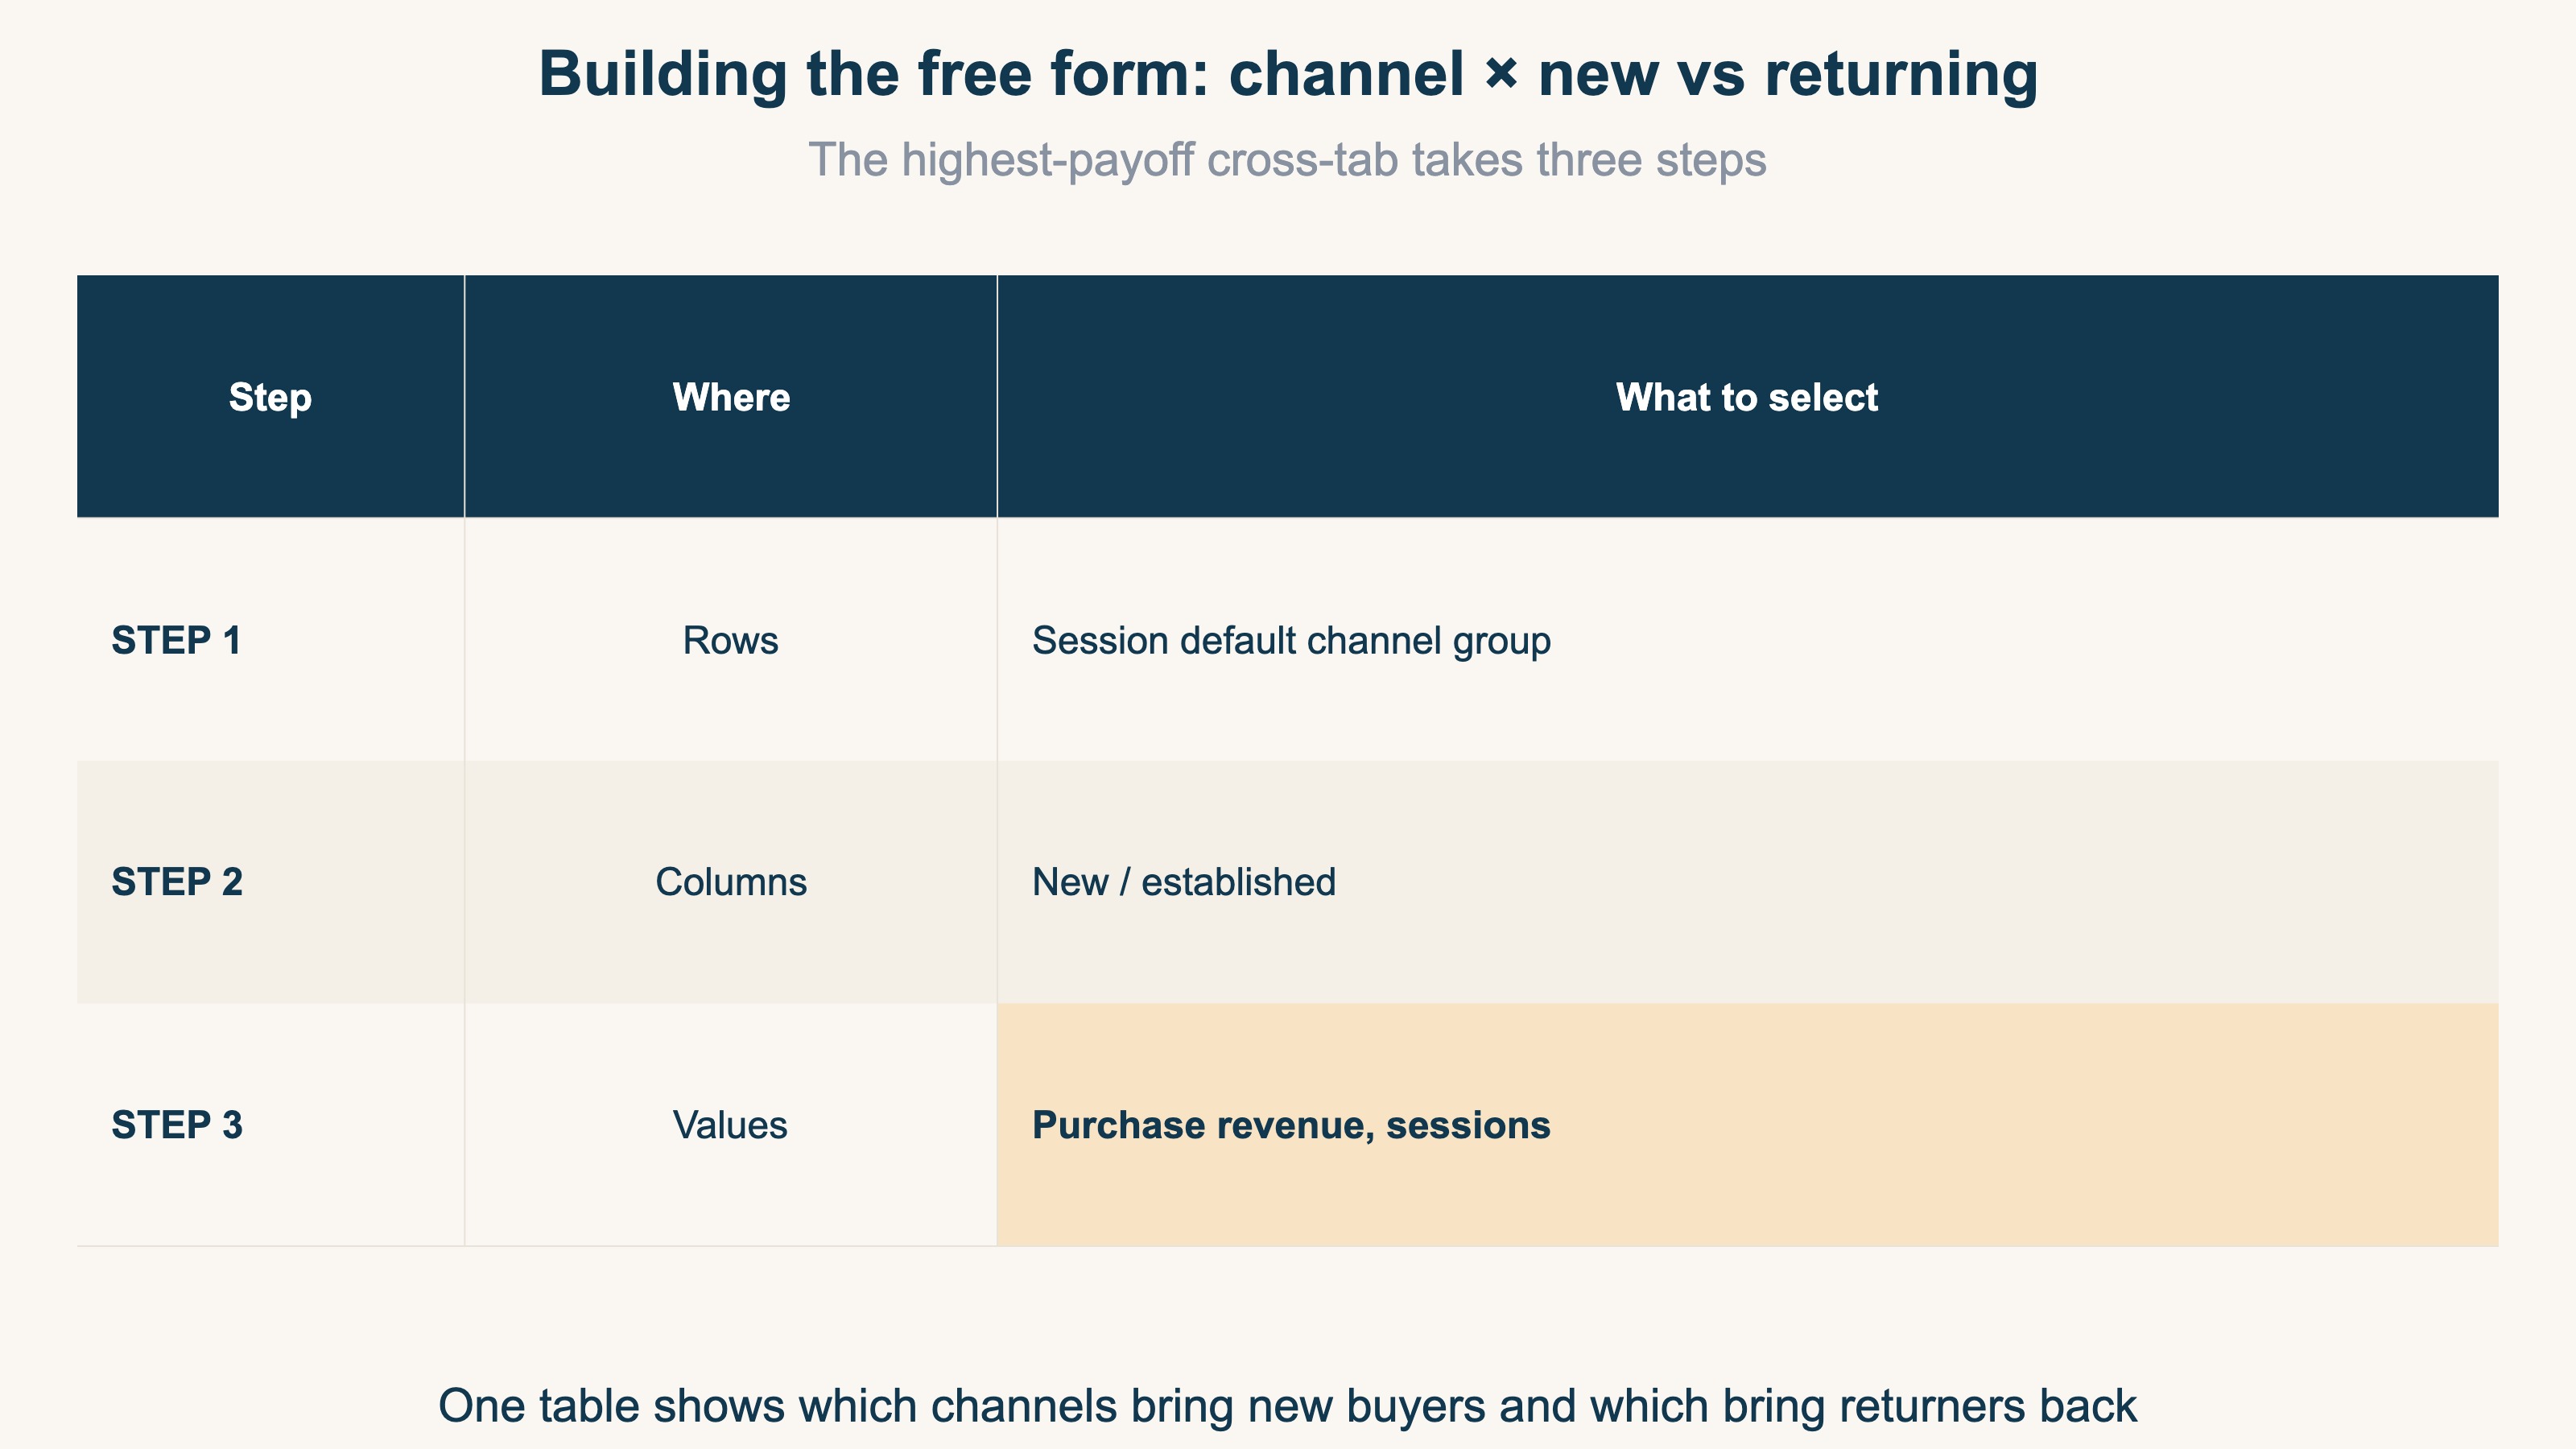
Now one table shows which channels bring in new buyers and which channels returning customers come back through. You might find paid search drives mostly new-customer revenue while returners arrive via email and social. Once that structure is visible, you can budget "new-customer acquisition" and "bringing returners back" as two separate decisions.
Funnel — find the drop-off point before purchase#
The second one is funnel exploration. It shows, stage by stage, where shoppers leave on the way from product page → cart → checkout → purchase. Heavy drop-off after add-to-cart points at shipping costs or checkout friction; heavy exits from product pages point at pricing or photos. The setup steps and a standard ecommerce funnel design are covered in the complete GA4 ecommerce funnel guide. For this article, just remember: when you need the drop-off point, it's funnel.
RevenueScope solution
Bottom line: before you build an exploration, the "new vs returning revenue" view is already one screen away.
If you read the three-step recipe above and thought "that still sounds like work" — the effort isn't the only problem. Beyond the assembly work, GA4 Explorations has a structural limit. First, bot (automated crawler) sessions mix into the channel numbers, dragging revenue per session (RPS) below its real level. Second, even if you want the new-vs-returning revenue efficiency every week, Explorations assumes you rebuild it from scratch each time — you can't keep it as a standing screen.
RevenueScope is a tool where the aggregations ecommerce actually needs are pre-built — with bots already excluded. Open the session attributes tab and revenue, sessions, and RPS (revenue per session) are already split by new vs returning visitors. Beyond skipping the row-and-column assembly, the numbers aren't dragged down by bot traffic, and you see the same screen every week.
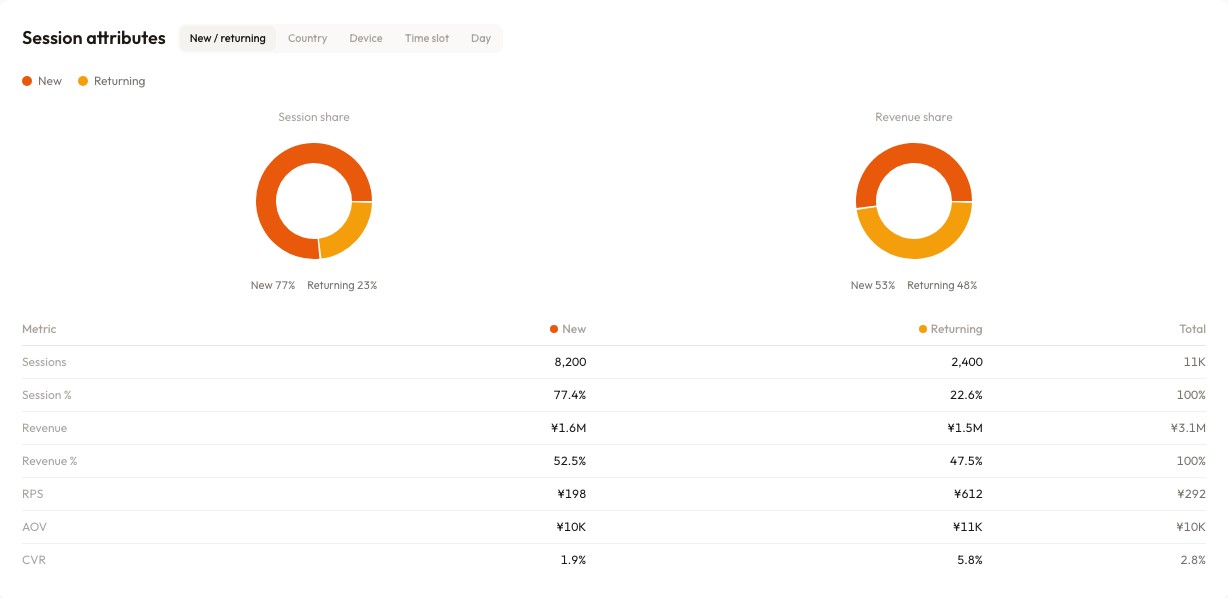
In the screen above (demo data shown), returning visitors' RPS is ¥612 — roughly three times the ¥198 of new visitors. New visitors bring more absolute revenue, but per-session efficiency belongs overwhelmingly to returners. Once you see that, the next move writes itself: shift part of the budget toward channels that bring returning customers back. No exploration required — the decision inputs are already on one screen.
Explorations' strength is building any combination you want. But the combinations you check weekly converge fast. The realistic split: view the recurring combinations — bot-excluded and already assembled — on a standing screen, and save Explorations for the genuinely one-off questions. That removes both the assembly cost and the distortion.
FAQ#
Q1. Can I share an exploration with teammates?
Yes. Use the share icon at the top right of the exploration. Note that shared users can only view it — editing requires duplicating it first.
Q2. Why do exploration numbers differ slightly from standard reports?
They're computed differently. Standard reports read pre-aggregated tables, while Explorations computes from raw data on the fly, so sampling and thresholds can introduce small gaps. Fine for spotting trends; not suited for reconciling financial figures.
Q3. If I master Explorations, do I still need a paid analytics tool?
For exploratory questions that change every time, GA4 Explorations is enough. But Explorations is exposed to bot contamination and isn't suited to reproducing the same view accurately every week. For "checking the same combination every week," a tool with bot-excluded, pre-assembled views wins on both time and accuracy. They serve different jobs — use both, not either-or.
Conclusion#
- Explorations builds the combinations standard reports don't have. You don't need to master every template
- Ecommerce revenue decisions need two: free form (channel × new vs returning) and funnel (drop-off points)
- Switch data retention from 2 to 14 months before you start
- For combinations you check every week, a pre-assembled screen — bots excluded and new-vs-returning RPS already split — is faster and more accurate than building an exploration
See which ads actually drive revenue, at a glance
Free up to 5,000 sessions/month, AI analyst included. No credit card required. Up and running in 5 minutes.
References#
[1] Google Analytics Help "Data retention" 2026