
Open your analytics and one page's page views (PV) are climbing. And still, signups and inquiries don't grow. Run an online store and you hit this kind of flat feeling. Your traffic should be working, yet somehow it stalls just short of revenue. The cause may be that the page is getting visited but not read.
Here's the first thing this article wants to say. If you're fixing a page that draws traffic but produces no results, the number to watch is scroll-reach rate. Scroll-reach is how far down a page people get — for example, the share of visits that reach the point 80% of the way down the page. PV only tells you how many people came; scroll-reach tells you whether the people who came read on or left partway. A page with high PV but low reach is getting traffic yet having its content thrown away unread — the most wasteful page you have. This article walks through how to find pages like that by scroll-reach, and the order in which to fix the structure behind the drop-off.
Table of contents
Key takeaways#
- A page with high PV (the count of how many times a page was shown) but no results is, more often than not, getting visited but not read. That shows up when you look at scroll-reach rate (how far down people get). Watch PV alone and you'll never notice it.
- Bounce rate and time on page measure "did they leave at the entrance" and "how long did they stay" — different things from scroll-reach (did they read on). To avoid misreading the cause, separate the metrics first.
- You shouldn't fix every page. Start from the one page that has both high PV and low reach — set that order, and only then does your limited time actually move revenue.
1. What a high-traffic, unread page really is#
When a page has high PV but no results, the trouble is usually a structural one: high PV crossed with low reach.
PV counts how many times a page was shown, so it rises cleanly whenever your traffic works. The problem is that even when PV grows, it tells you nothing about whether those people read on. If the first view (the screen that appears before any scrolling) makes them judge "the thing I'm looking for probably isn't here," they go straight back. PV is "how many came"; scroll-reach is "how deep they read." These are two separate things.
Here, let me separate the often-confused metrics in a line. Bounce rate looks at the share of sessions that started on a page and left without seeing any other page; exit rate looks at the share where a page was the last one viewed — and both are different from scroll-reach (how far down a page people read). The difference between the metrics is laid out in "Bounce rate versus exit rate." This article handles, of those, the state of "they're coming but dropping off unread," through scroll-reach.
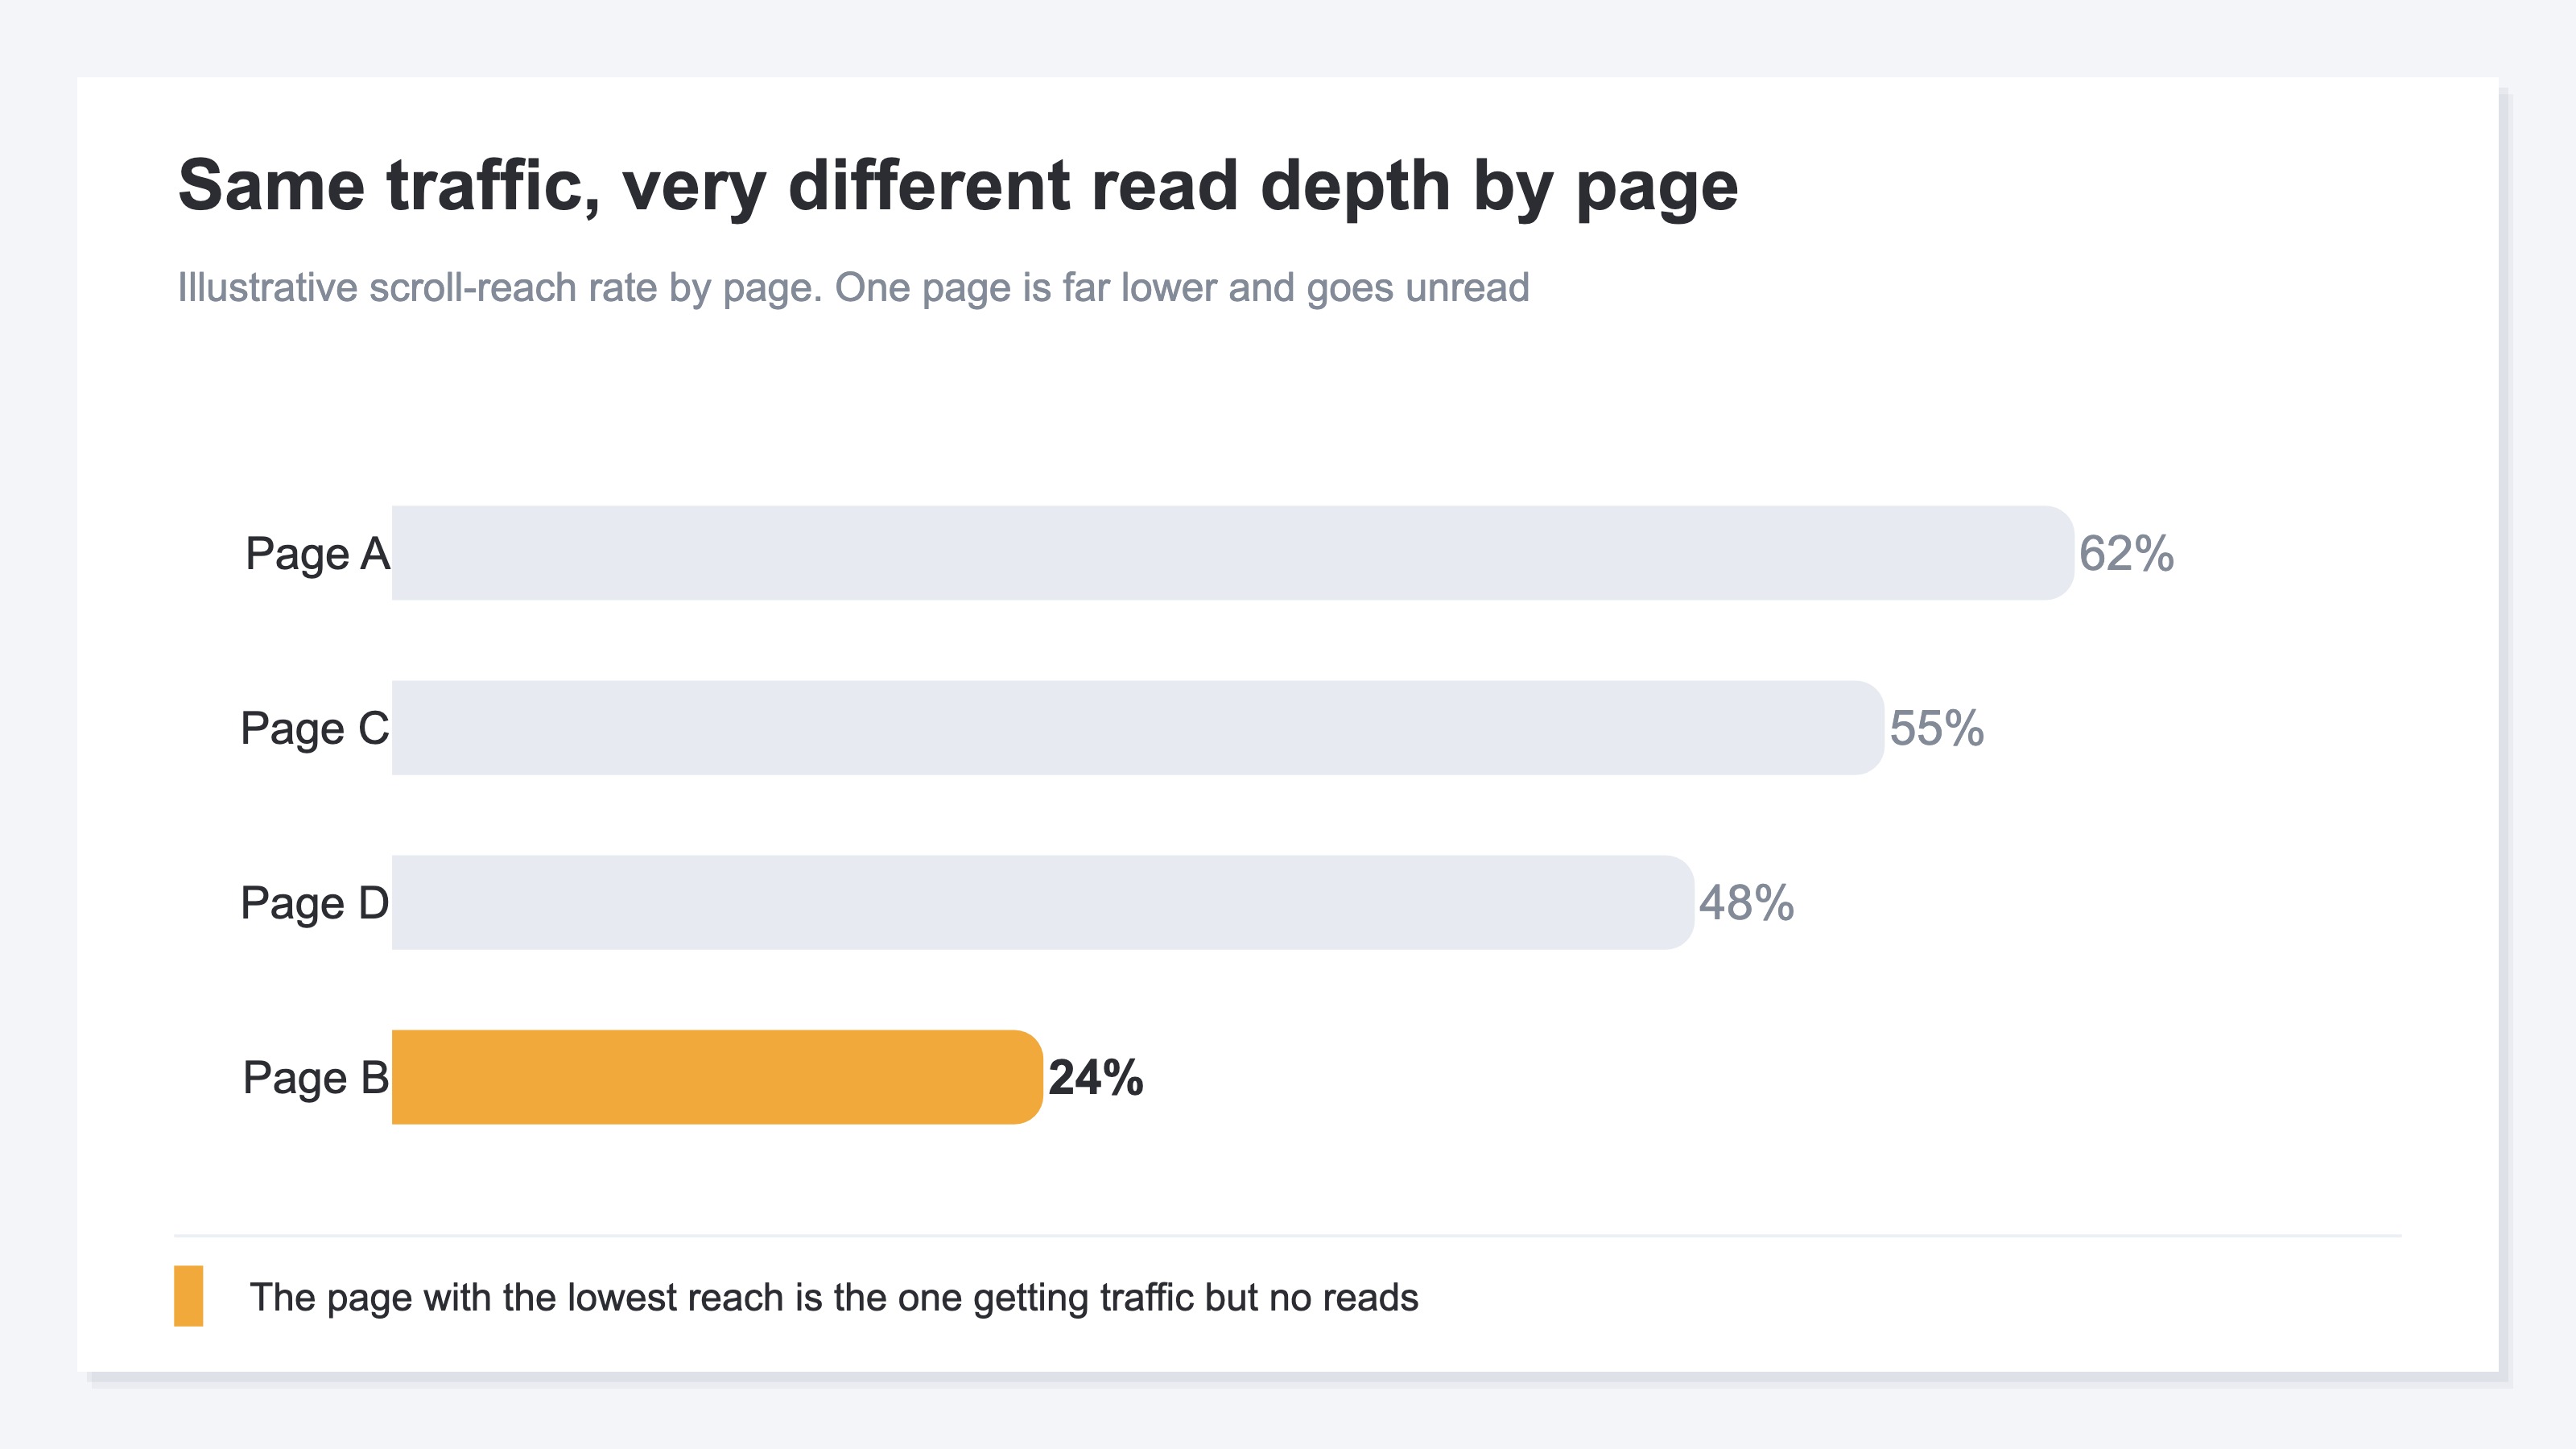
Why does "high PV, low reach" happen? Because PV and reach are decided by separate forces. PV grows through acquisition (ads, search, social), but reach is decided by the page's content — what's seen first, what order the information runs in. The harder you push acquisition, the more PV climbs; but if the content is left untouched, reach stays low. So the very page pulling the most traffic ends up the least read — a reversal that happens routinely. That's the real shape of the invisible loss buried among your ordinary pages.
2. Pin down where people leave with scroll-reach#
The key to finding what to fix is to break scroll-reach down further — to "at which depth did it suddenly fall."
Knowing a page's overall reach is low doesn't, by itself, tell you where people left. So, starting from where they begin reading, you look at how many remain at each depth — a quarter, half, three-quarters, finished (the still-reading rate). Almost always, you'll find one depth where people drop off in a cluster. That spot is just upstream of the structure causing the drop-off.
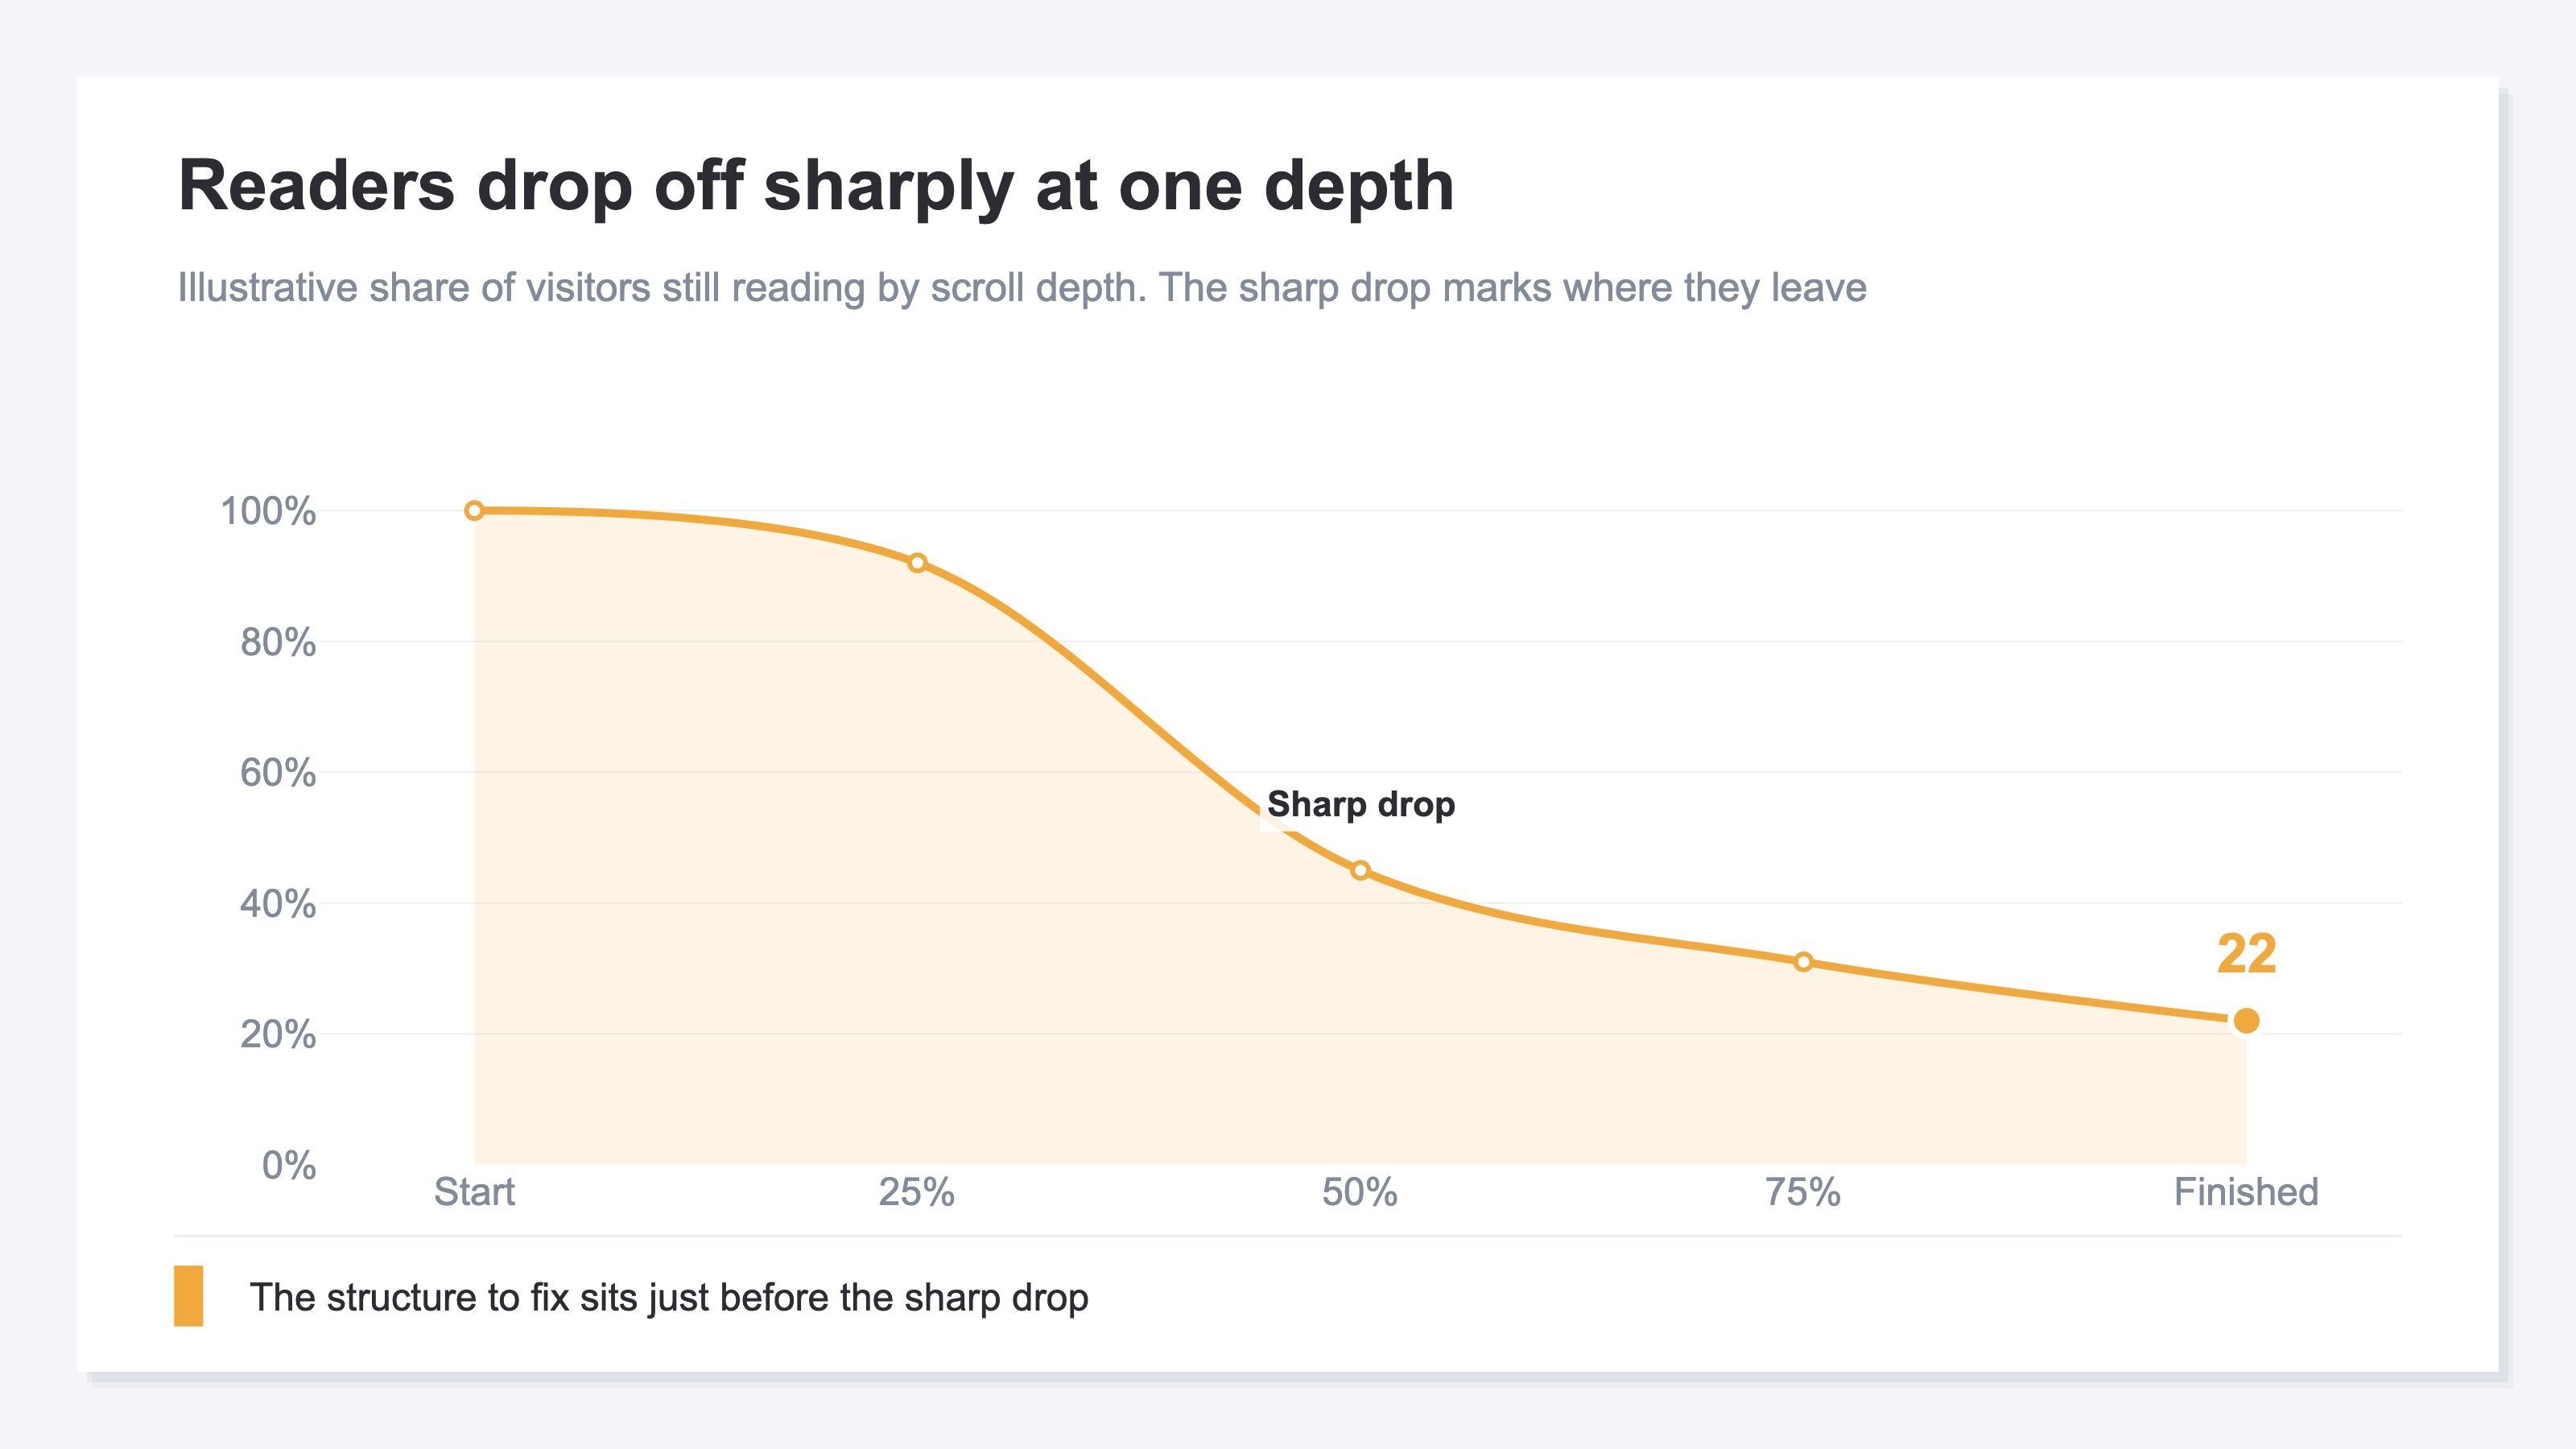
The depth where the sharp fall happens carries meaning. If people drop just below the first view, the opening screen made them judge "this isn't for me." If they drop in the middle, the order of information doesn't fit, and they lose patience before reaching what they wanted to know. If they drop just short of the finish, the last nudge — the signup button or the path to the next page — is hard to find. The depth where they leave tells you the place to fix.
You can roughly see this kind of depth-by-depth drop-off in GA4 too, by building your own event that records scroll-reach and switching it page by page. But scroll-reach isn't a metric provided out of the box, so you end up building the event yourself and switching pages one at a time to redo the tally. The basics of tracing where people left through a funnel (the stages from arrival to exit) are covered in how to see funnels and drop-off points in GA4; but the moment you try to compare scroll-reach across pages, the work grows with every page you want to see.
3. Fix the structure behind the drop-off#
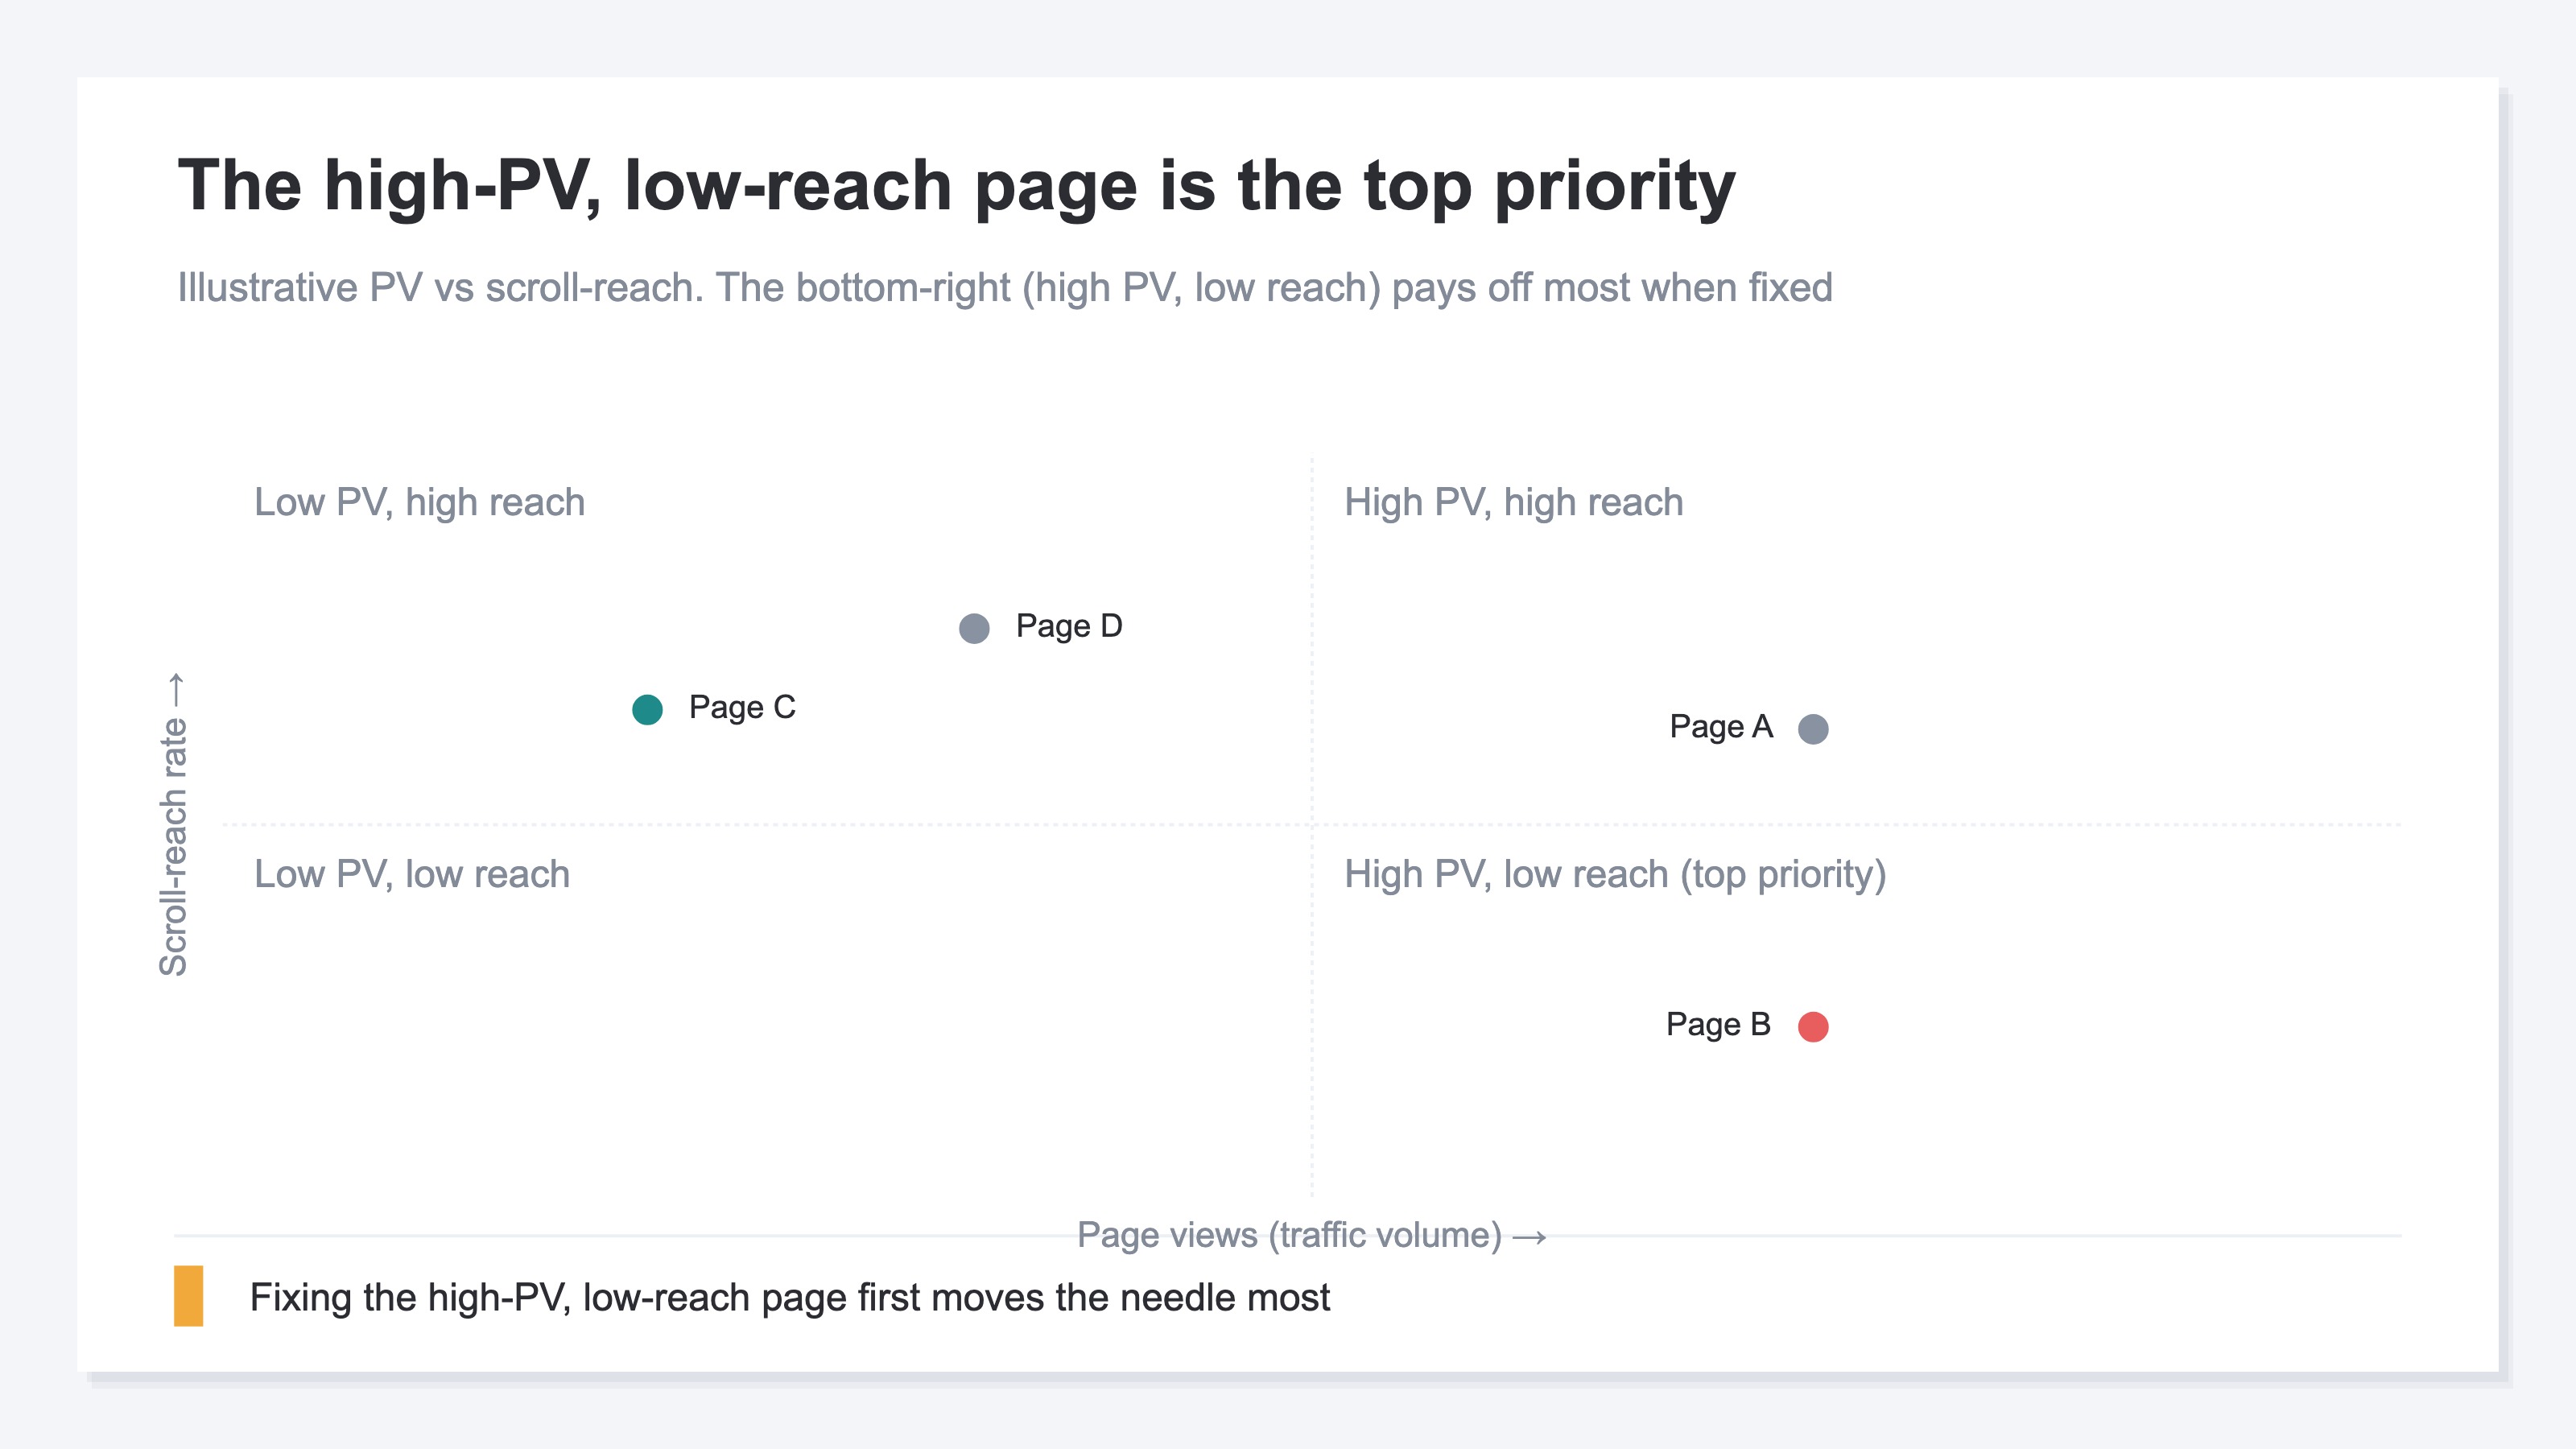
What you fix is three structures — the first view, the order of information, the path to the next step — and not across every page, but starting from the one page narrowed down by PV crossed with reach.
Once you can see where people fall, the targets to fix narrow to three. First is the first view. Does the opening screen convey at a glance that "the answer you're after is here"? Just rewriting the headline and first few lines into a form that states things squarely along the visitor's purpose can sharply cut the drop-off right below it. Second is the order of information. Is what they want to know pushed to the back? Bring the conclusion, the price, and who it's for to the front, and send the supplements to the back, and the mid-page drop-off eases. Third is the path to the next step. For someone who read on, is the button to a signup or the next page in the right place? Drop-off just short of the finish usually stalls right here.
That said, if you try to fix every problem you found across all pages at once, they all end up half-done. Set an order. The criterion is PV (acquisition volume) crossed with reach. A page with high PV and low reach — many people are coming, yet it isn't being read — pays off most when fixed. Conversely, fixing a page with low reach but small PV barely moves the whole.
Let me make the boundary clear. What this article covers reaches as far as the structural fix — which page, and how to fix it. What scroll-reach means in the first place, and why it works as a leading indicator upstream of reaching the signup button — that definition is laid out separately in "Measuring acquisition quality with read rate." This article narrows to the step before that: which spot, and how, to fix.
The idea itself isn't hard. What's hard is keeping it up every time. Which page is high-PV and low-reach — to know that, you have to produce reach per page, cross it against PV, and check the depth-by-depth fall as well. On top of that, many analytics tools don't offer scroll-reach as a headline metric, so you build it yourself and redo the tally while switching pages by hand. A simple idea, yet the effort grows with every page you want to see. If you want to see reach trends by entrance or channel, how to compare acquisition channels works alongside this too.
RevenueScope's solution
When you try to find unread pages by scroll-reach, you end up against the same wall. You know PV and reach are decided by separate forces — yet producing reach per page, crossing it against PV, time on page, and bounce rate, and checking the depth-by-depth fall is heavy enough that you run out of energy before you reach the "one page to fix."
RevenueScope holds that cross from the start, as a per-page list. It outputs each page's scroll-reach (reaching the 80% point) alongside PV, average time, bounce rate, and period-over-period change in one screen (display uses demo data), so you can see at a glance which page is "getting visited but not read." Ask it, and it comes back like this.
| Page | PV | Reach | Avg. time | Bounce | vs. prev. |
|---|---|---|---|---|---|
| Product list | 4,200 | 61% | 95s | 42% | +8% |
| Feature page | 3,800 | 24% | 31s | 71% | +22% |
| Case studies | 1,100 | 55% | 88s | 48% | -3% |
| FAQ | 900 | 64% | 102s | 39% | +1% |
The most telling read in this table is the feature page. Its PV of 3,800 is among the highest, and at +22% period-over-period its acquisition is growing. And yet its reach is only 24%, average time 31 seconds, bounce rate 71%. In other words, plenty of people are coming, but they leave almost without reading. From here the next move comes into view: now, while acquisition is growing, fixing this page's first view and order of information would let more people read it on the same traffic — so the first thing to touch is the feature page.
Let me make one thing clear. What RevenueScope outputs reaches as far as per-page scroll-reach, PV, average time, bounce rate, and period-over-period change. It does not output page-level revenue figures — how much revenue a page generated per visitor, or its conversion rate (CVR). It assembles the material for which page to fix, but the final call on whether and how to fix it is yours. When you want to step into per-page revenue, "Per-page revenue efficiency" is the entry point to what comes next.
FAQ#
Q1. My PV is climbing but revenue isn't growing. Where on the page should I look?
PV reflects only "how many came." Whether the people who came read on, you see through scroll-reach. A page with high PV but low reach is getting traffic yet being left unread. First check the reach of your high-PV pages, and fix the low ones. The traffic is already there, so it works cheaper and faster than adding new acquisition.
Q2. If I lower the bounce rate, will the page get read?
Bounce rate and scroll-reach are different things. Bounce rate is the share who left at the entrance; scroll-reach is the depth people read to. Even with the same bounce rate, reach can differ widely. If you want to know whether a page is being read, look at scroll-reach and the depth-by-depth fall, not the bounce rate.
Q3. I found several pages to fix. Which do I start with?
Don't pick by low reach alone — multiply it by the page's PV (acquisition volume). Fixing a small-PV page barely moves the whole. Start with the page that has high PV and low reach. That's where fixing it matters most.
Summary#
A page with high PV (the count of how many times a page was shown) but no results is, more often than not, getting visited but not read. Because PV reflects only how many came, whether they read on shows up only when you look at scroll-reach. And bounce rate and time on page are different metrics from scroll-reach, so confusing them sends you after the wrong cause.
The spot to fix can be named by breaking reach down by depth and seeing where people drop off in a cluster. Depending on where they fall, you fix one of three structures — the first view, the order of information, the path to the next step. And rather than fixing every page at once, you start from the one page with high PV and low reach. First, take the page pulling the most traffic and check its reach once. The page that's coming but going unread may be buried right there.
See which ads actually drive revenue, at a glance
Free up to 5,000 sessions/month, AI analyst included. No credit card required. Up and running in 5 minutes.
References#
- [1] Ministry of Economy, Trade and Industry "Survey on Electronic Commerce" (2024)
- [2] Baymard Institute (2024)
- [3] Nielsen Norman Group (2024)
- [4] Google Analytics Help "Scrolls (enhanced measurement)" (URL unconfirmed)