
"Bounce Rate is high, that's a problem, right?" "What's the difference between Bounce Rate and Exit Rate?" — these are the two metrics most often confused on the analytics floor. On top of that, the move from Universal Analytics (UA) to Google Analytics 4 (GA4) redefined Bounce Rate completely and removed Exit Rate from the default reports.
This article walks through the difference between Bounce Rate and Exit Rate and contrasts the UA and GA4 definitions. But knowing the definitions is not enough: to turn an exit into a budget or fix decision, you need to see "which channel that exit came from and how much revenue it produced" — and that view does not exist in standard GA4 reports. This article goes that far.
Table of Contents
TL;DR#
-
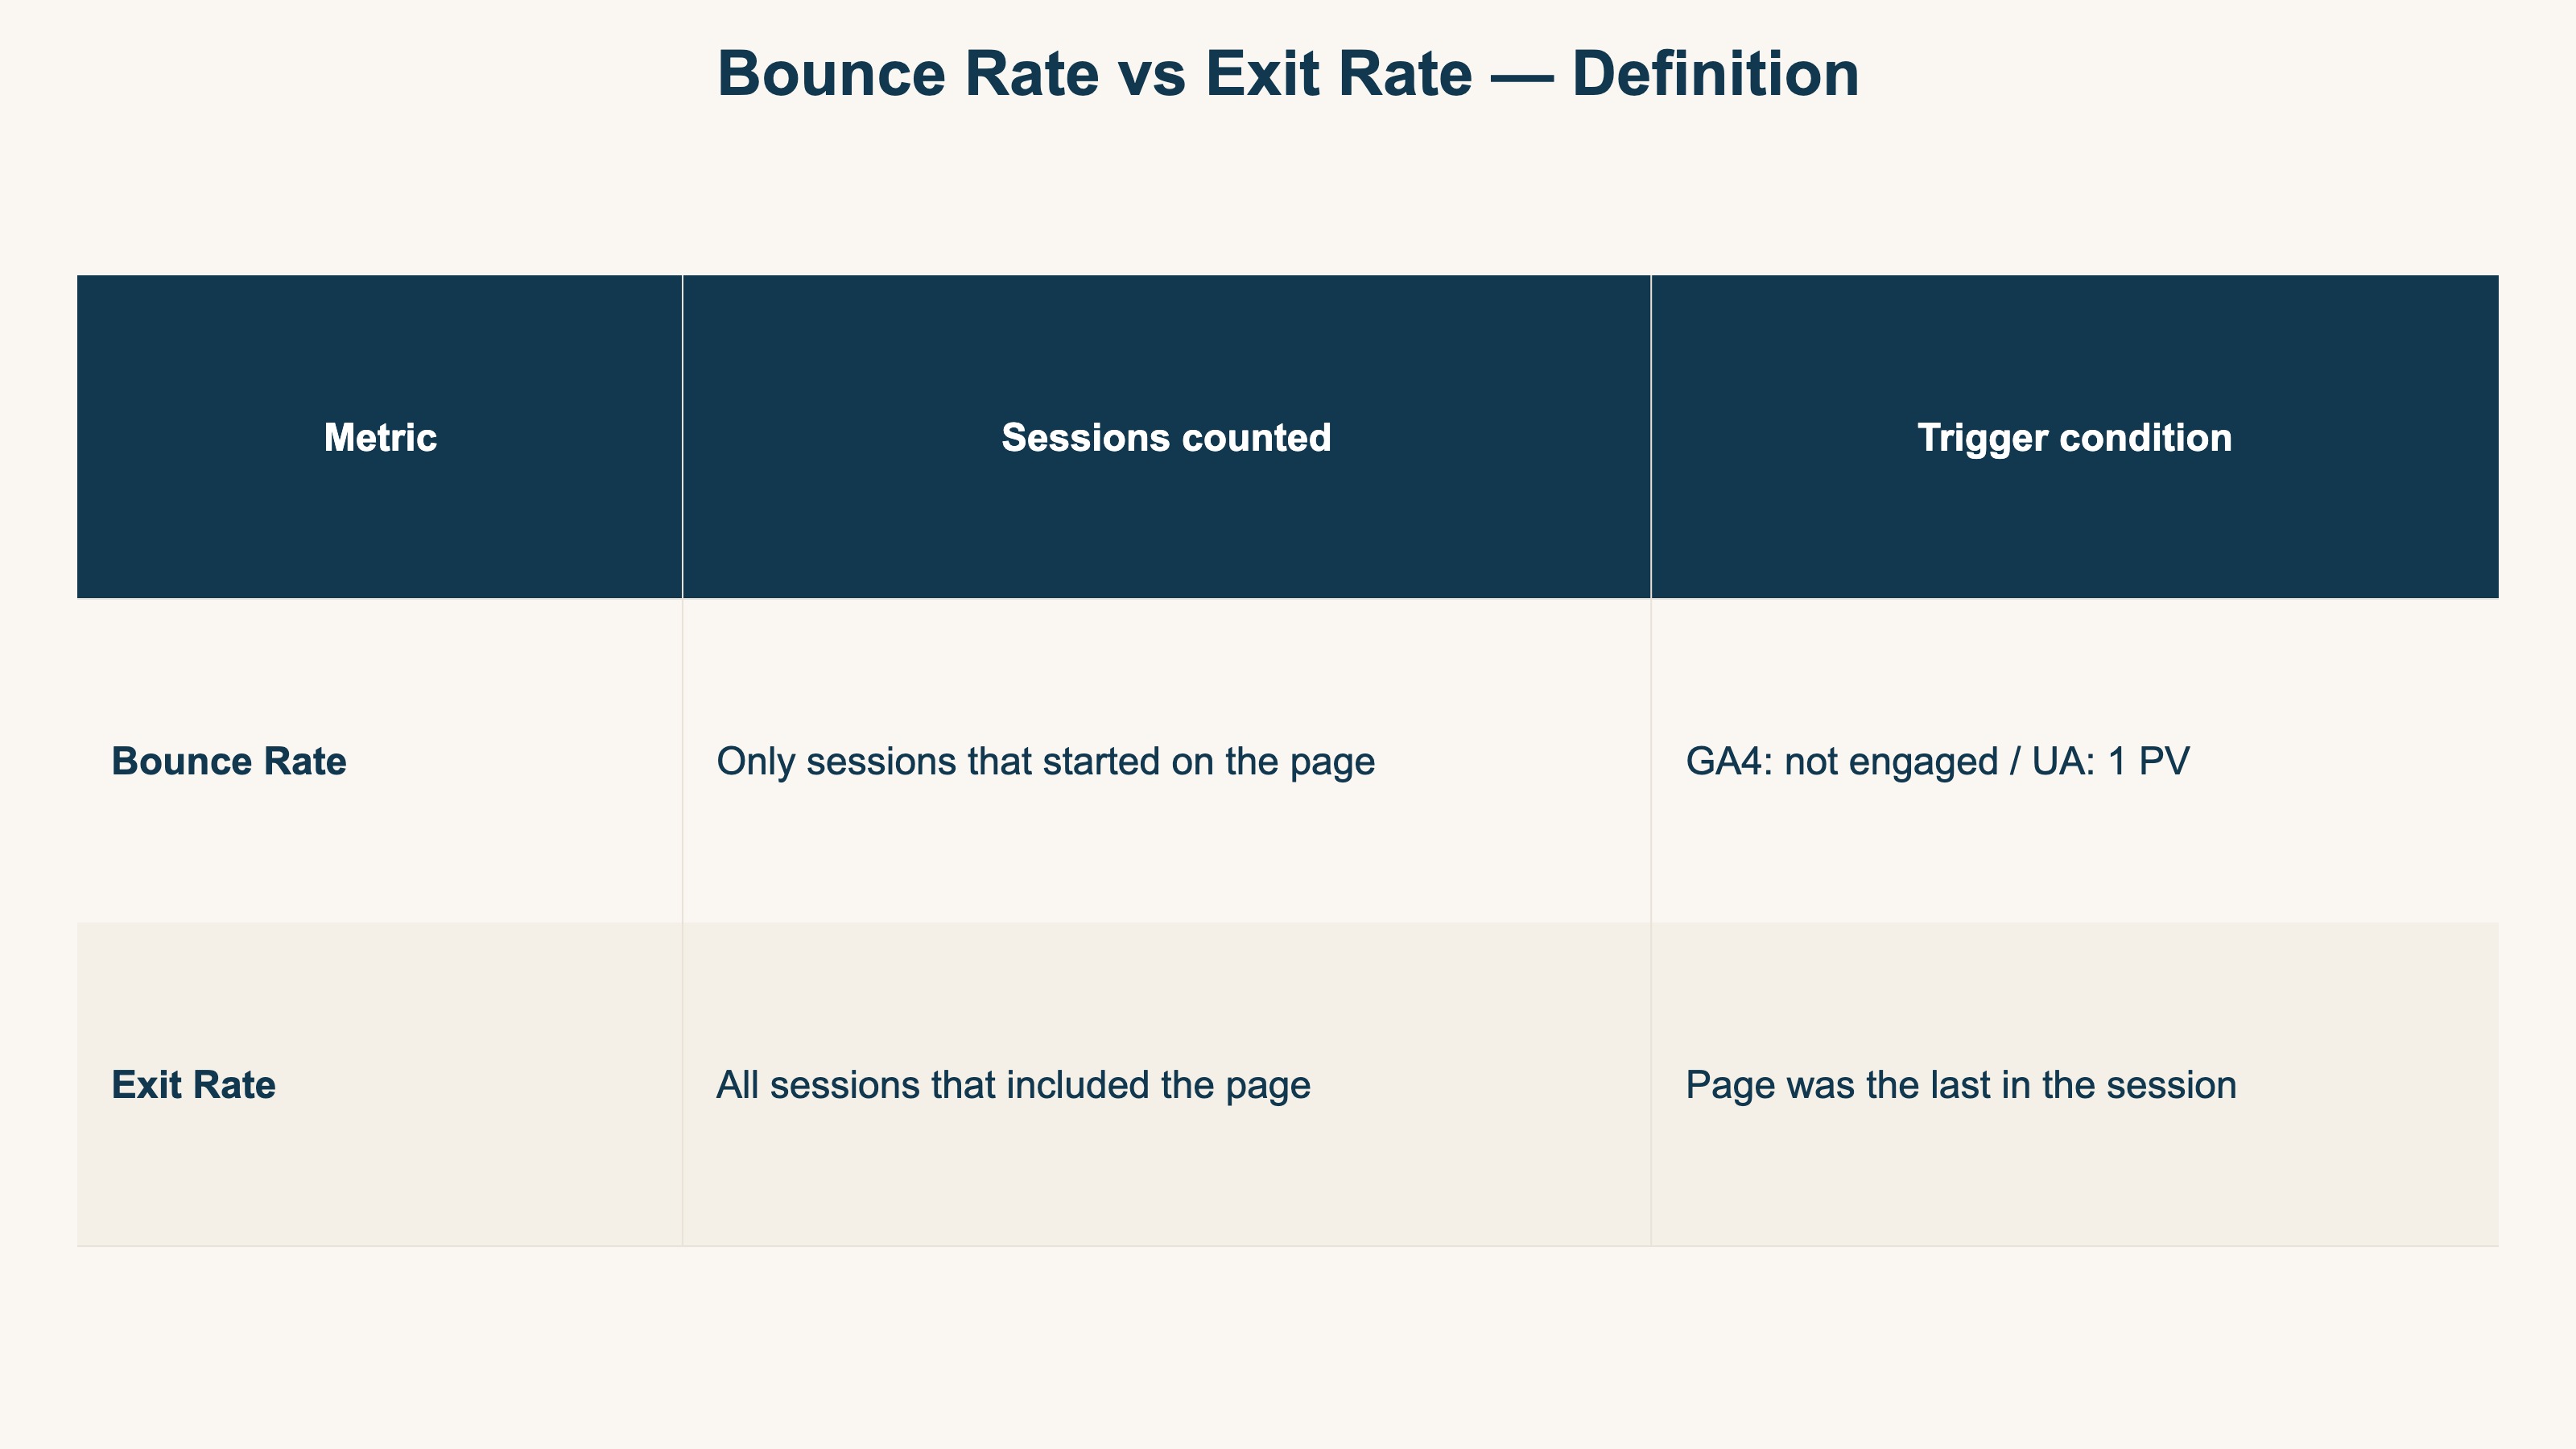
Different sessions are counted
Exit Rate counts every session that included the page. Bounce Rate counts only sessions that started on that page[2]
-
GA4 redefined Bounce Rate
What used to mean "single-page session" in UA now means "session without engagement" (1 minus Engagement Rate) in GA4[1]
-
"Exit quality" is read as revenue by channel — and that does not line up in standard GA4
A high Bounce Rate or Exit Rate is not automatically bad. Combining it with RPS (Revenue Per Session) is the call — but pairing exits with revenue by channel has no built-in view in GA4 and must be assembled by hand every time
1. Bounce Rate: the metric GA4 redefined#
Bottom line: Bounce Rate means very different things in GA4 and UA. The classic "single-page session" shortcut is dead in GA4, where it now means "session without engagement."
Bounce Rate means very different things in GA4 and Universal Analytics. The classic UA shortcut "percentage of single-page sessions" no longer holds in GA4.
Bounce Rate in UA (the old definition)#
In UA, Bounce Rate was "the percentage of sessions that started with the page where there was only one pageview"[2].
The shorthand "people who left after seeing only one page" became the standard mental model.
Bounce Rate in GA4 (the new definition)#
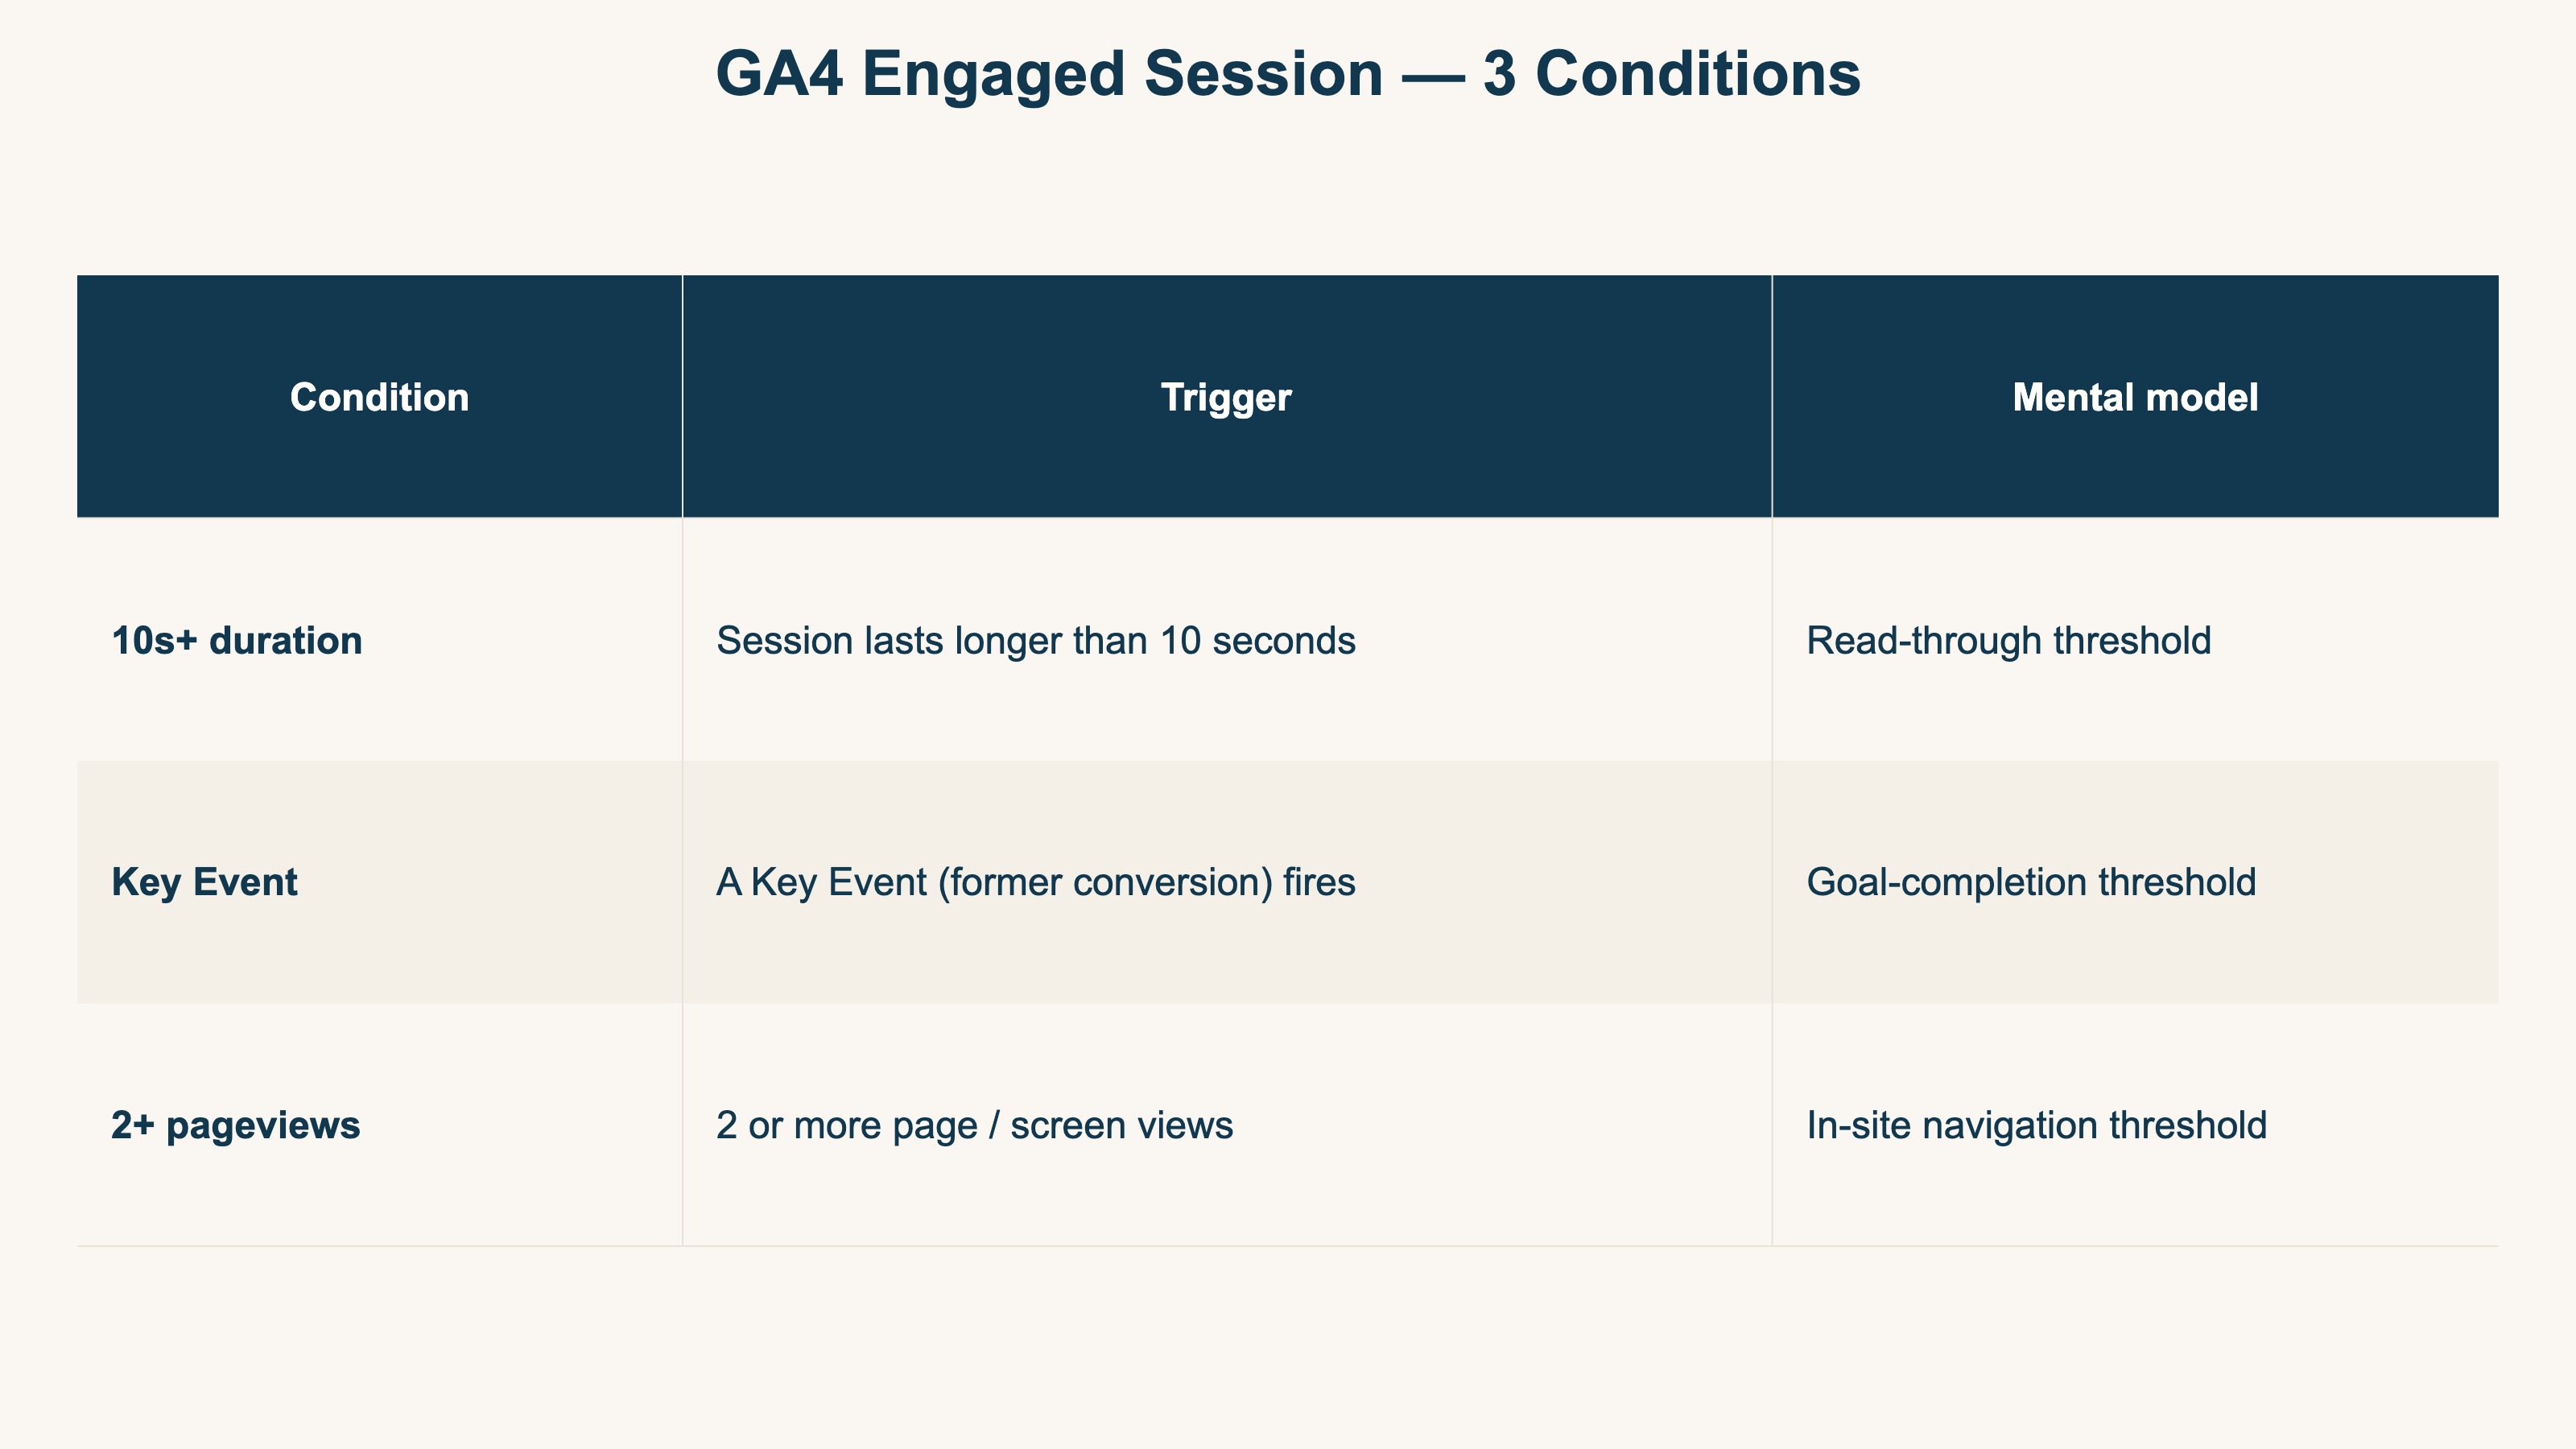
GA4 redefined Bounce Rate as "the percentage of sessions that were not engaged" (1 minus Engagement Rate)[1].
A session counts as engaged when any one of the following is true[1].
- The session lasts longer than 10 seconds
- A Key Event (formerly Conversion) fires
- There are 2 or more page or screen views
A single-page visit that lasts more than 10 seconds is no longer a bounce. Conversely, a 2-page visit under 10 seconds with no Key Event can still be counted as a bounce.
The simple "high Bounce Rate equals bad" reading is even harder to defend in GA4. Whether a sub-10-second exit means "bounced" or "read through" depends entirely on the page's purpose.
2. Exit Rate: where each page becomes the last stop#
Bottom line: Exit Rate is the share of sessions that ended on a page, out of all sessions that passed through it. The decisive difference from Bounce Rate is the session pool. GA4 dropped it from default reports.
Exit Rate is the percentage of sessions including the page where that page was the session's last[2].
Exit Rate = Sessions that ended on the page / All sessions that included the page
The fundamental difference from Bounce Rate is the session pool. Bounce Rate's denominator is sessions that started on the page. Exit Rate's denominator is every session that passed through the page.
GA4 dropped Exit Rate from default reports#
UA had Exit Rate as a default column. GA4 does not list Exit Rate as a default metric[3].
To approximate exit behavior in GA4, you can use Path Exploration, the distribution of session_end events, or a combination with Engagement Time. But all of these tell you only which page the session ended on. Whether that exit came from a channel that actually generates revenue never appears on the same screen as the exit itself — that is the point this article builds to.
3. Bounce Rate vs Exit Rate at a glance#
Bottom line: across four lenses — sessions counted, numerator, GA4 treatment, and use — the two split into "entry-page evaluation (Bounce)" and "per-page exit degree (Exit)."
A side-by-side table makes the difference clearer.
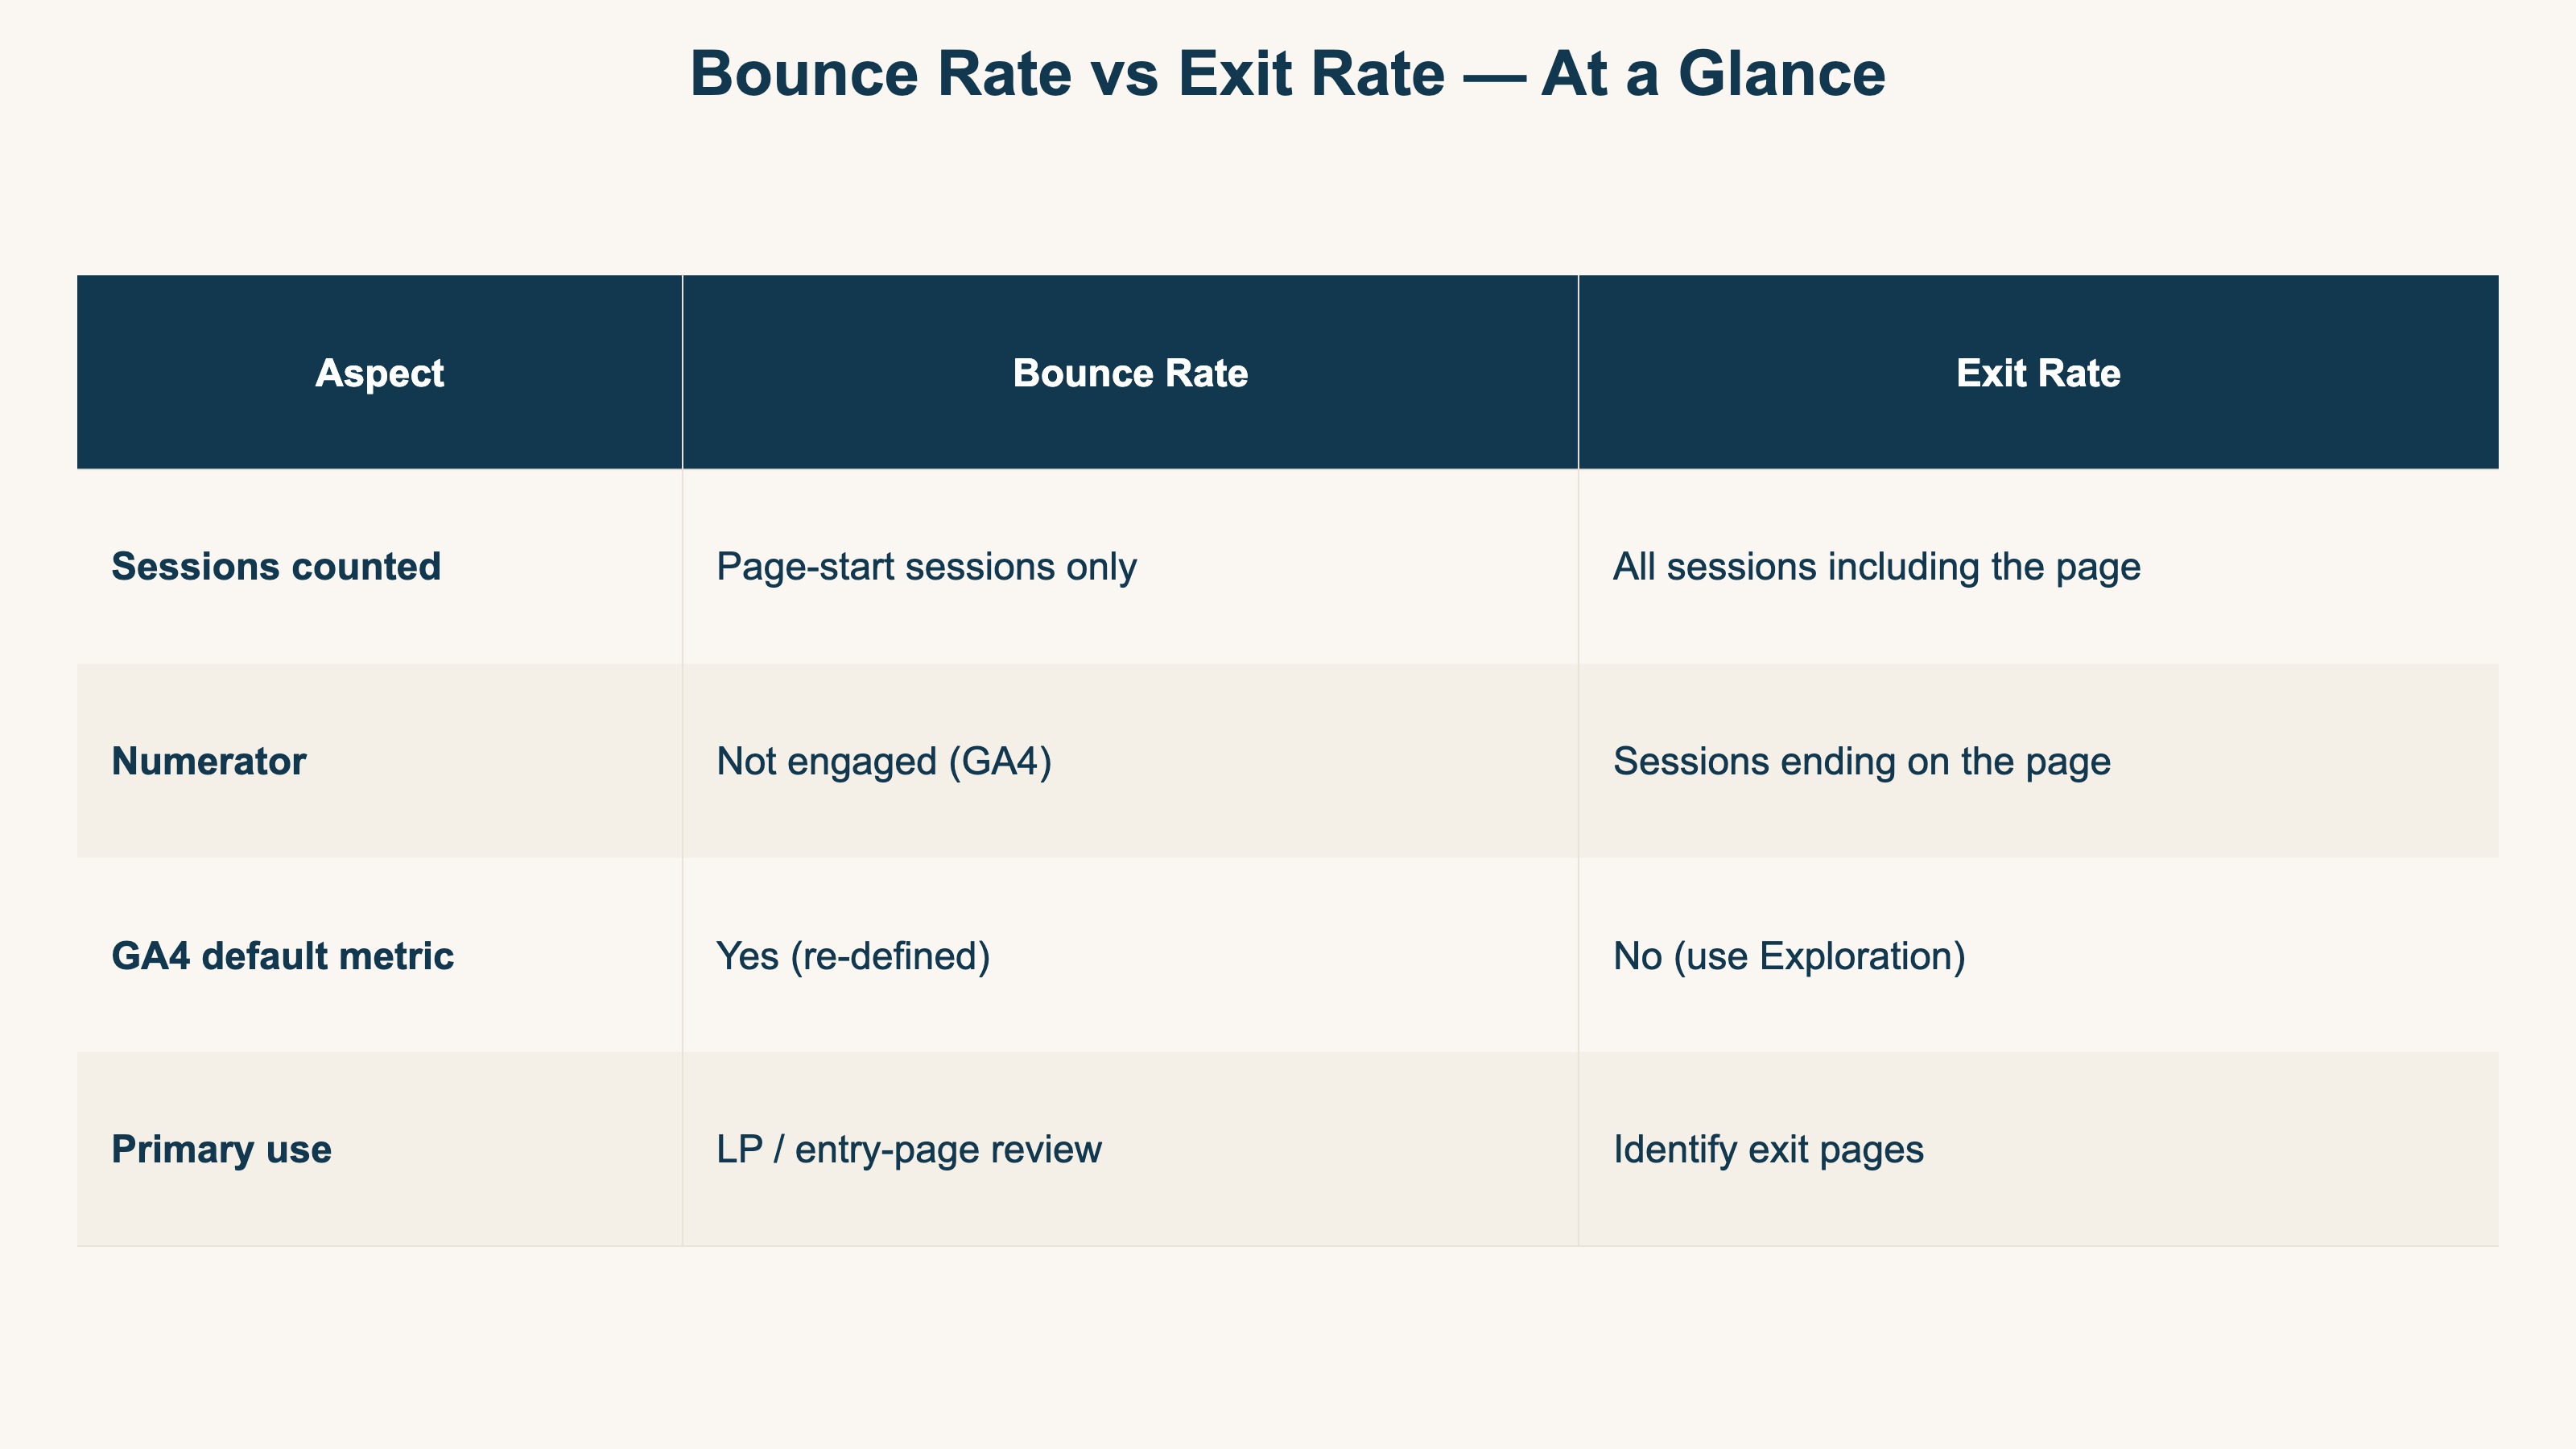
| Aspect | Bounce Rate | Exit Rate |
|---|---|---|
| Sessions counted | Sessions that started on the page | All sessions that included the page |
| Numerator | Not-engaged sessions (GA4) | Sessions ending on the page |
| GA4 default metric | Yes (re-defined) | No (use Exploration) |
| Primary use | LP / entry-page evaluation | Identify exit pages |
A simpler analogy:
- Bounce Rate = the share of visitors who turned around at the front door (entry-page lens)
- Exit Rate = the share of visitors who walked out from each room (per-page lens)
4. From a revenue lens: are they "bad" metrics?#
Bottom line: neither metric is "high equals bad." Where and in what context the exit happens is the real signal. But "look at context" is where everyone gets to — the hard part is pairing the exit with channel-level revenue, which GA4 has no built-in way to do.
Both metrics are often labeled "high equals bad", but in practice that shortcut breaks down quickly.
When high Bounce Rate is fine#
- Single-page LPs: a landing page that completes purchase or inquiry on one screen will, by design, see almost everyone "leave after one page". A 90% Bounce Rate is healthy if CVR is good
- Article media: search visitors who read an article and return to results are technically "bounces" but completed the page's actual job
When Exit Rate is a problem#
- EC product detail pages: if buyers with intent are dropping off here, the button placement, stock indicator, or shipping copy all become candidates
- Mid-funnel checkout steps: when the cart → shipping → payment sequence shows a spike on one step, form design is the natural suspect
In other words, where the bounce or exit happens, and in what context, is the actual signal. But most people can reach that conclusion. The genuinely hard part is the next step: was that exit from a channel that actually makes money? The same high exit rate calls for opposite moves depending on whether the visitors who left were no-revenue traffic or buyers who already converted.
5. EC operators should read "exit quality" with RPS#
Bottom line: judge an exit by whether revenue rises. Cross Exit Rate with RPS (Revenue Per Session) and the fix priority across pages starts to surface.
Both metrics ultimately need to be judged against revenue. The lens for that is RPS.
Use RPS (Revenue Per Session) to read "exit quality"#
RPS = Revenue / Sessions. It expresses how much revenue one session generates.
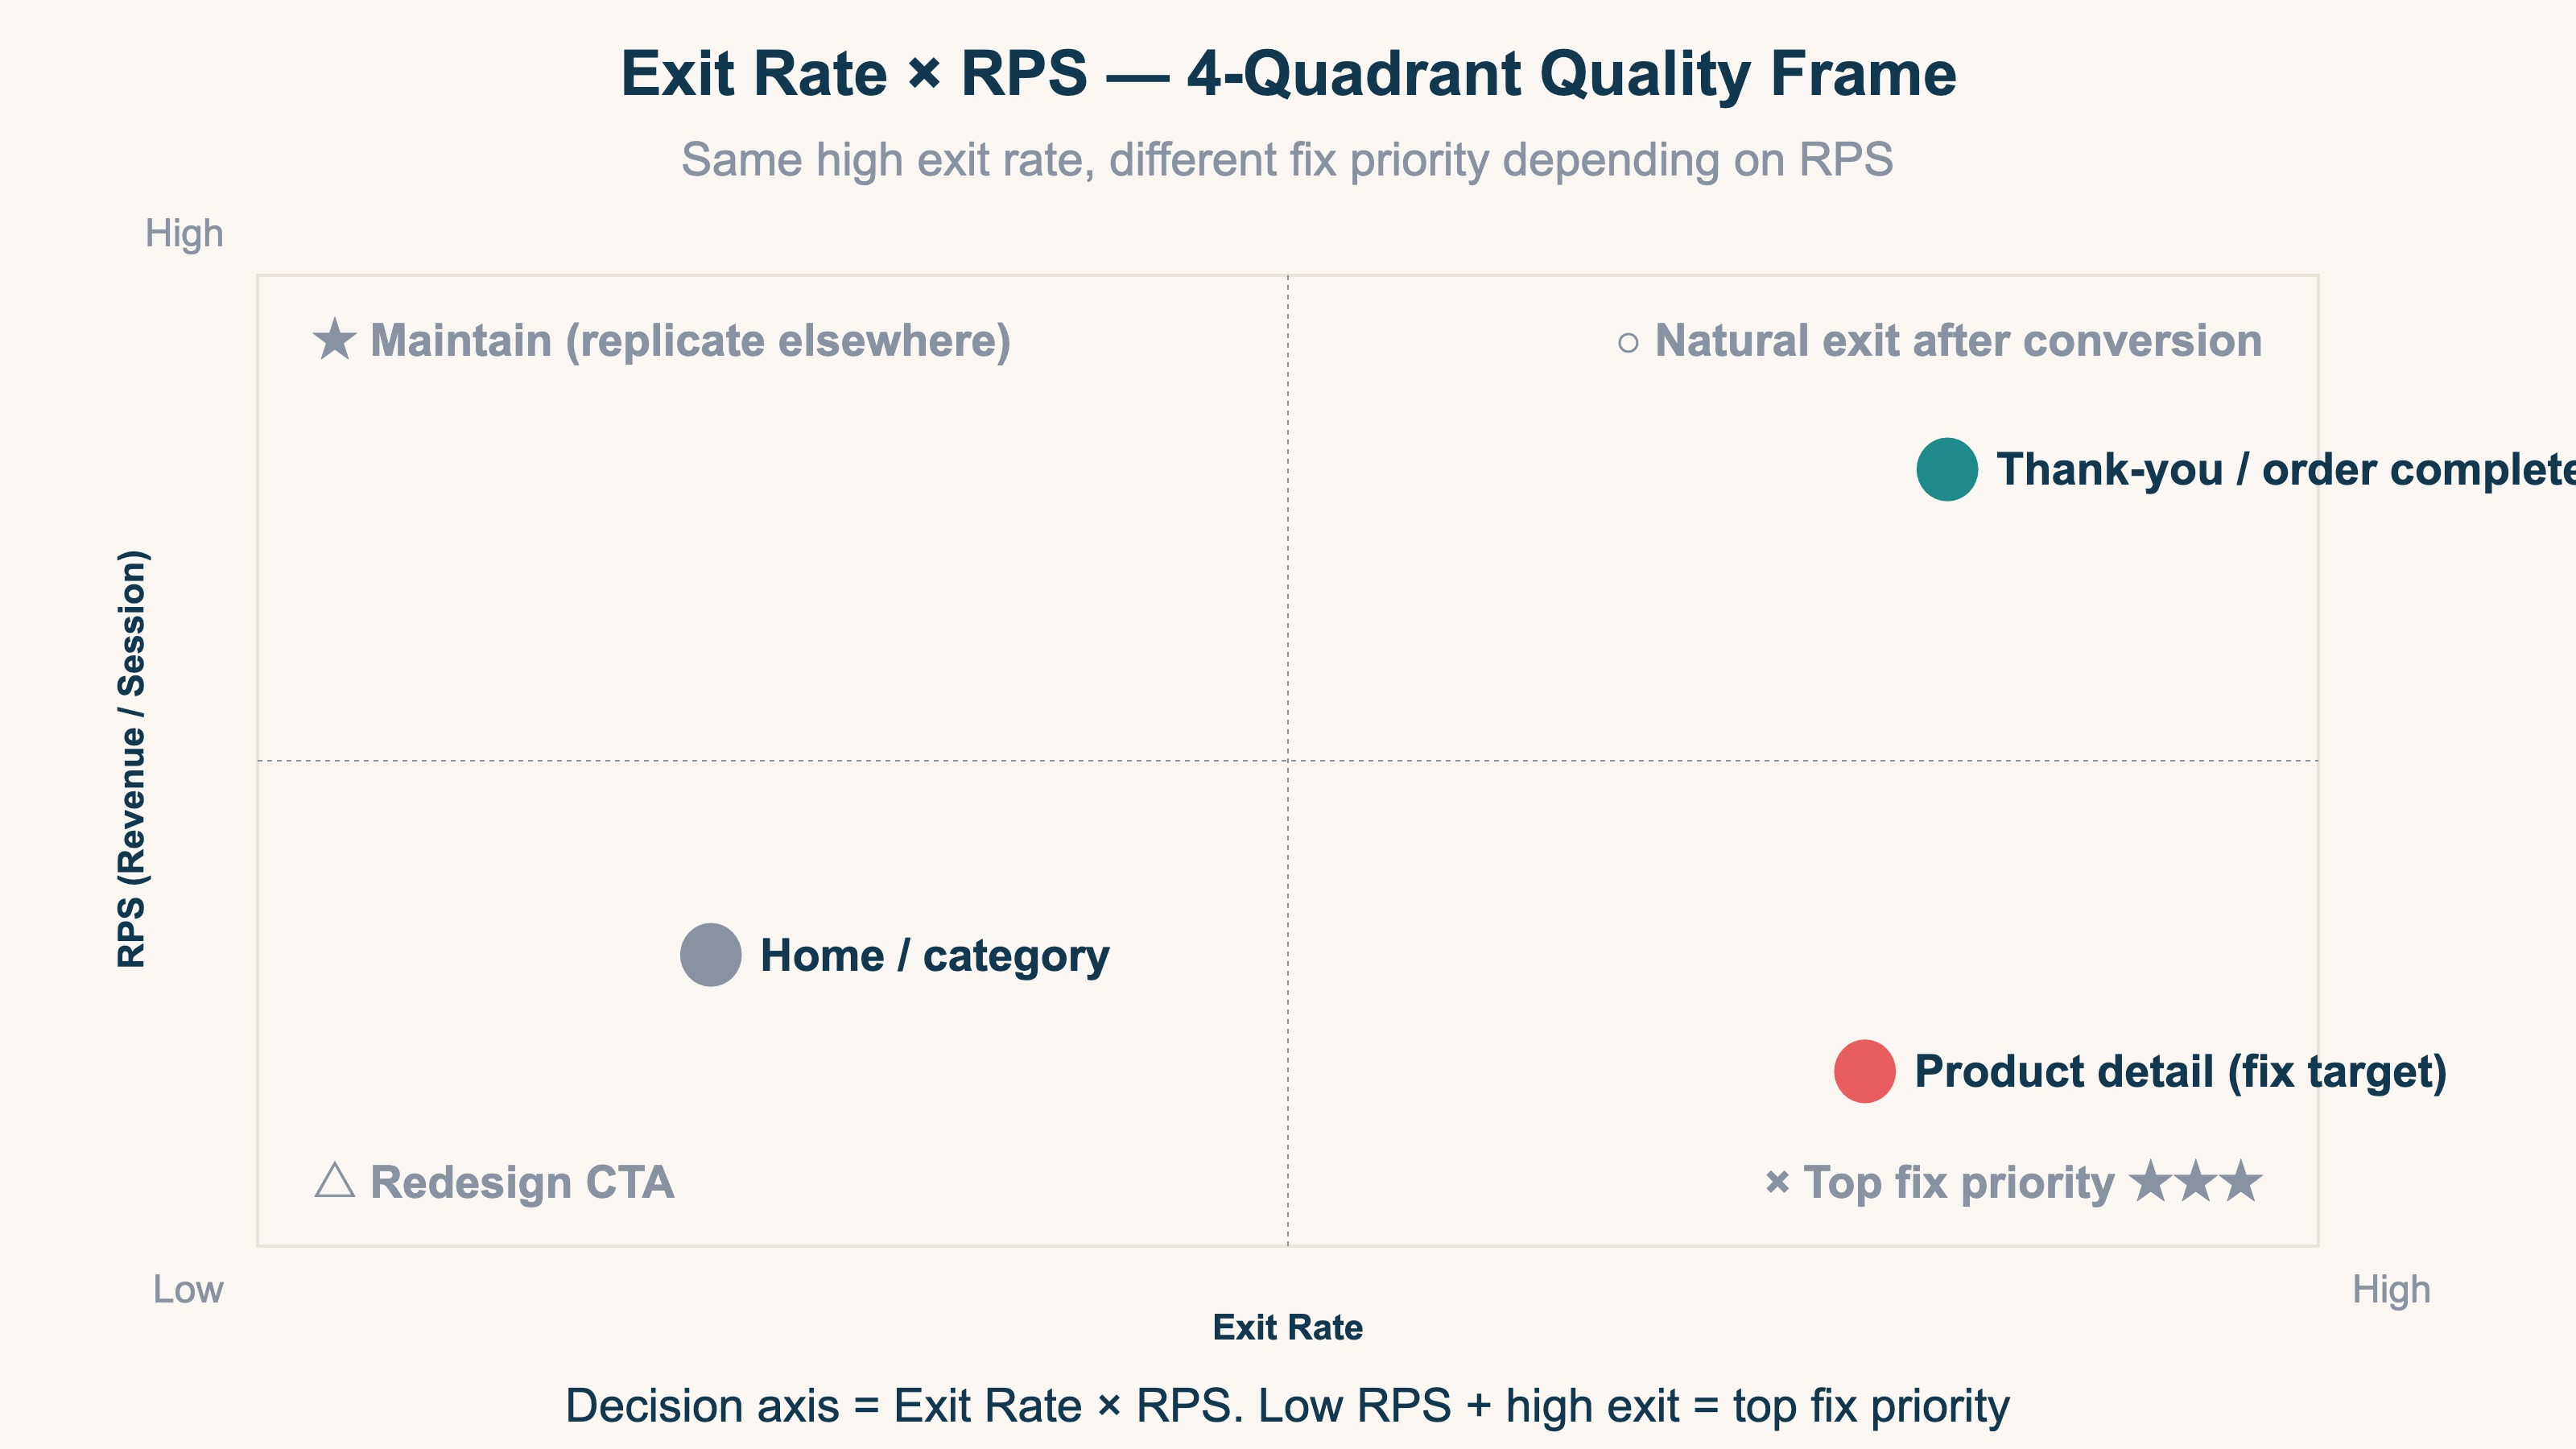
Crossing Exit Rate with RPS splits exits by "quality." A high-exit, low-RPS page is the largest revenue leak and the top fix priority, while a high-exit, high-RPS page is usually a natural exit after conversion and barely needs touching. Reading "Exit Rate × RPS" beats chasing the rate alone (the same idea sits behind the revenue dashboard design).
But the moment you try to read "Exit Rate × RPS" by channel, you hit a wall. In GA4, exits live in Path Exploration, RPS is a manual revenue ÷ sessions calculation, and channels are yet another report — three screens, never one. The next section is about crossing that wall.
RevenueScope solution
Bottom line: "read exit quality as revenue, by channel, on one screen" — that view is structurally absent from standard GA4. RevenueScope fills it.
GA4 shows you where exits happened (Path Exploration), how much a session earned (manual math), and which channel sent the visit (the acquisition report) — each on a separate screen. To answer "do the channels landing on this high-exit page actually generate revenue," you have to hand-assemble all three every time. A view that lines up exits and revenue efficiency by channel, with bots excluded, on one screen does not exist in GA4's defaults.
RevenueScope replaces that hand-assembly with a permanent view. Add one tag to GA4 and revenue, RPS (revenue per session), AOV, and CVR show up by channel on one screen. Even on a high-exit page, whether the channels sending that traffic generate revenue is a separate question — so exit quality is judged by channel-level revenue efficiency.
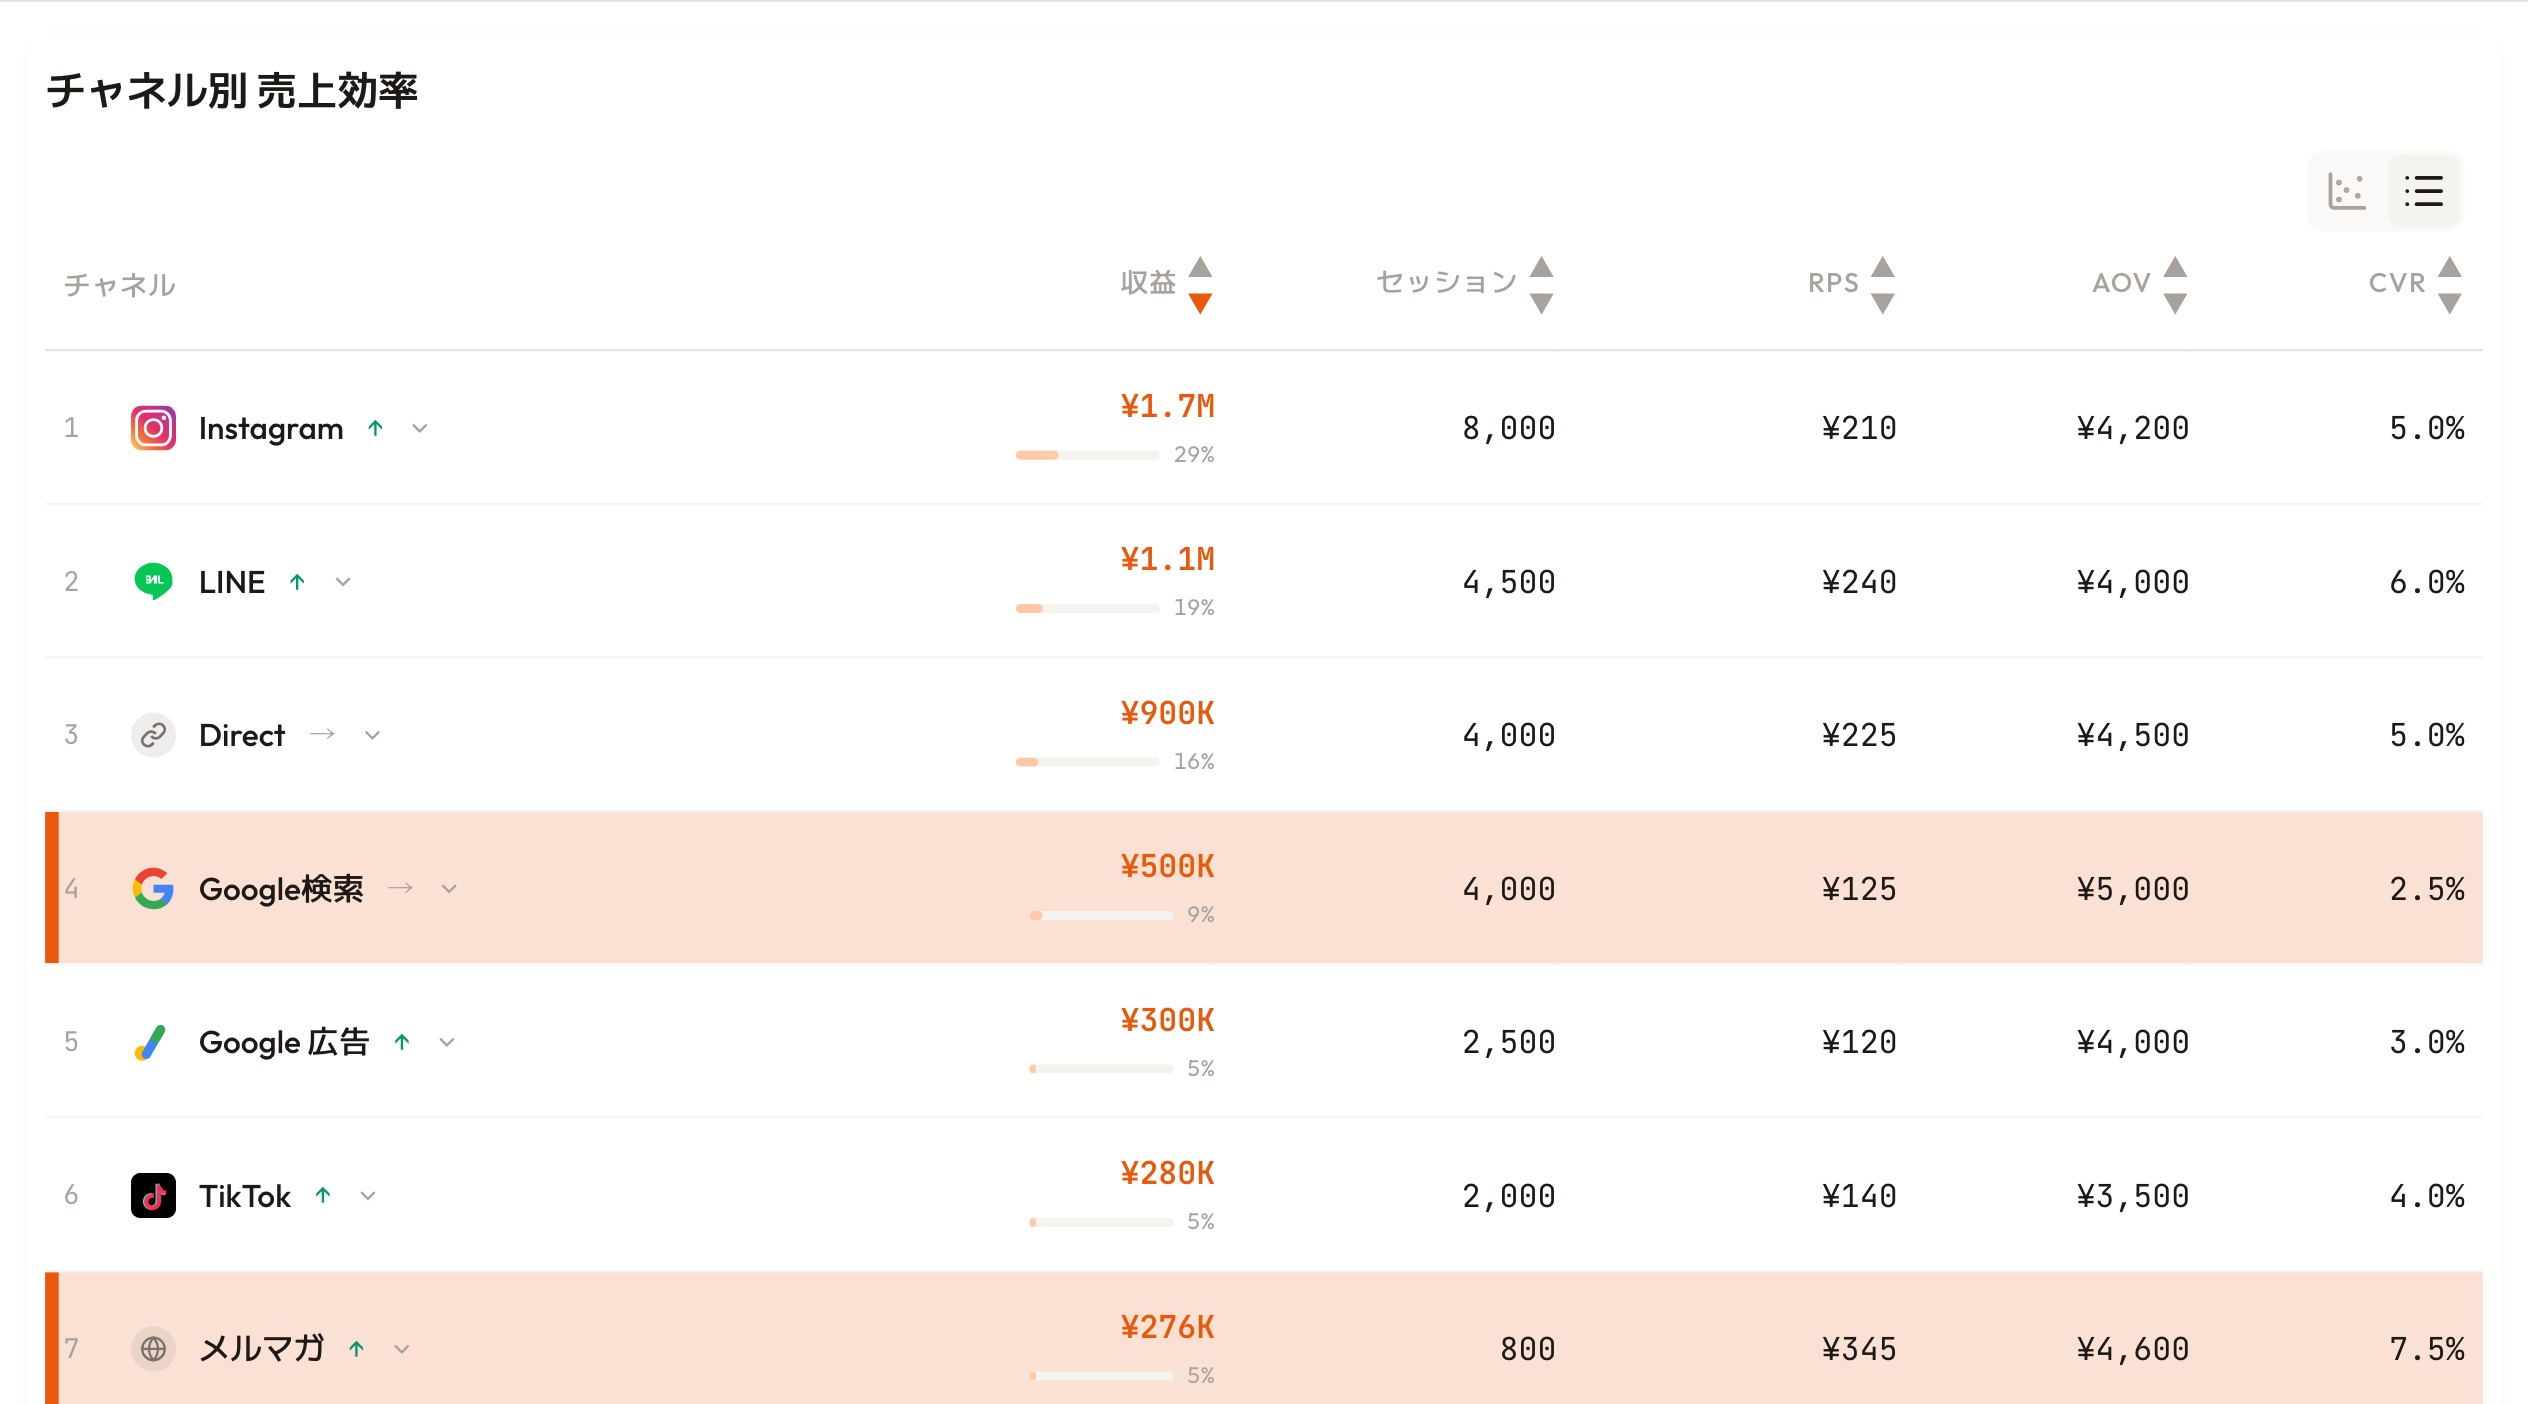
RevenueScope's dashboard (demo data shown). Decide fix priority by revenue efficiency per channel, not by exit rate alone.
On a high-exit page fed by your top-RPS channel, the exit is mostly "left after converting" and drops down the priority list. If the lowest-RPS channels cluster there instead, that page is your biggest revenue leak. You pick which page and which channel to fix next by real revenue numbers, not by the rate. That's the next step toward not leaving Exit Rate as a "bad metric."
Related basics#
For the full Web Analytics 101 thread, see the rest of the series.
- Part 1 Events vs Sessions in GA4 — what each one actually counts
- Part 2 Sessions vs Page Views vs Users
- For GA4 traffic source quirks: Why GA4 direct/none traffic increases
- For revenue per session: RPS complete guide
FAQ#
Q1. Is GA4's Bounce Rate lower than UA's?
In most cases yes. GA4's Bounce Rate is "not engaged" — meeting any one of (10s+ stay / Key Event / 2+ PV) keeps the session out of the bounce bucket, so the bar is more lenient than UA's[1].
Q2. How do I see Exit Rate in GA4?
GA4 does not include Exit Rate as a default metric. Use Path Exploration or aggregate session_end events to approximate it[3]. But that only tells you which page the session ended on; pairing that exit with the channel it came from and the revenue it produced lives on separate screens, so the channel-level read still takes manual work.
Q3. What is a "good" Bounce Rate target?
There is no universal target — it depends on industry and page intent. Article media routinely sit at 70 to 90 percent, EC product detail pages at 40 to 60 percent, and single-page LPs can be healthy above 90 percent. Rather than chasing a target number, judge it against your own channel-level RPS and CVR.
Summary#
- Bounce Rate and Exit Rate count different session pools (Bounce = page-start only / Exit = all sessions through the page)
- GA4 redefined Bounce Rate as "not engaged" and dropped Exit Rate from default reports
- A rate's height alone does not decide good or bad — where and in what context the exit happens is the signal
- But the real goal is to read exit quality as channel-level revenue (RPS) and decide where to fix next — a one-screen view GA4 has no built-in way to produce, requiring exits and revenue to be hand-paired by channel every time
See which ads actually drive revenue, at a glance
Free up to 5,000 sessions/month, AI analyst included. No credit card required. Up and running in 5 minutes.
References#
- Google Analytics Help "[GA4] Engagement rate and bounce rate"
- Google Analytics Help "The difference between Exit Rate and Bounce Rate"
- Google Analytics Help "Metrics comparison: GA4 vs Universal Analytics"


