"Sessions are the number of visitors, right?" "Page views are high, so traffic is healthy." — when someone is starting out with web analytics, these are the very first three metrics to trip them up. Sessions, page views, and unique users (UU) look similar, but they count different things and are used for different decisions.
This article walks through what each metric counts, how they relate (PV ≧ Sessions ≧ Users), which one EC operators look at first, and how GA4 reports them. It then connects "scale (counts)" to the earning power that sits just beyond it.
Table of contents
TL;DR#
-
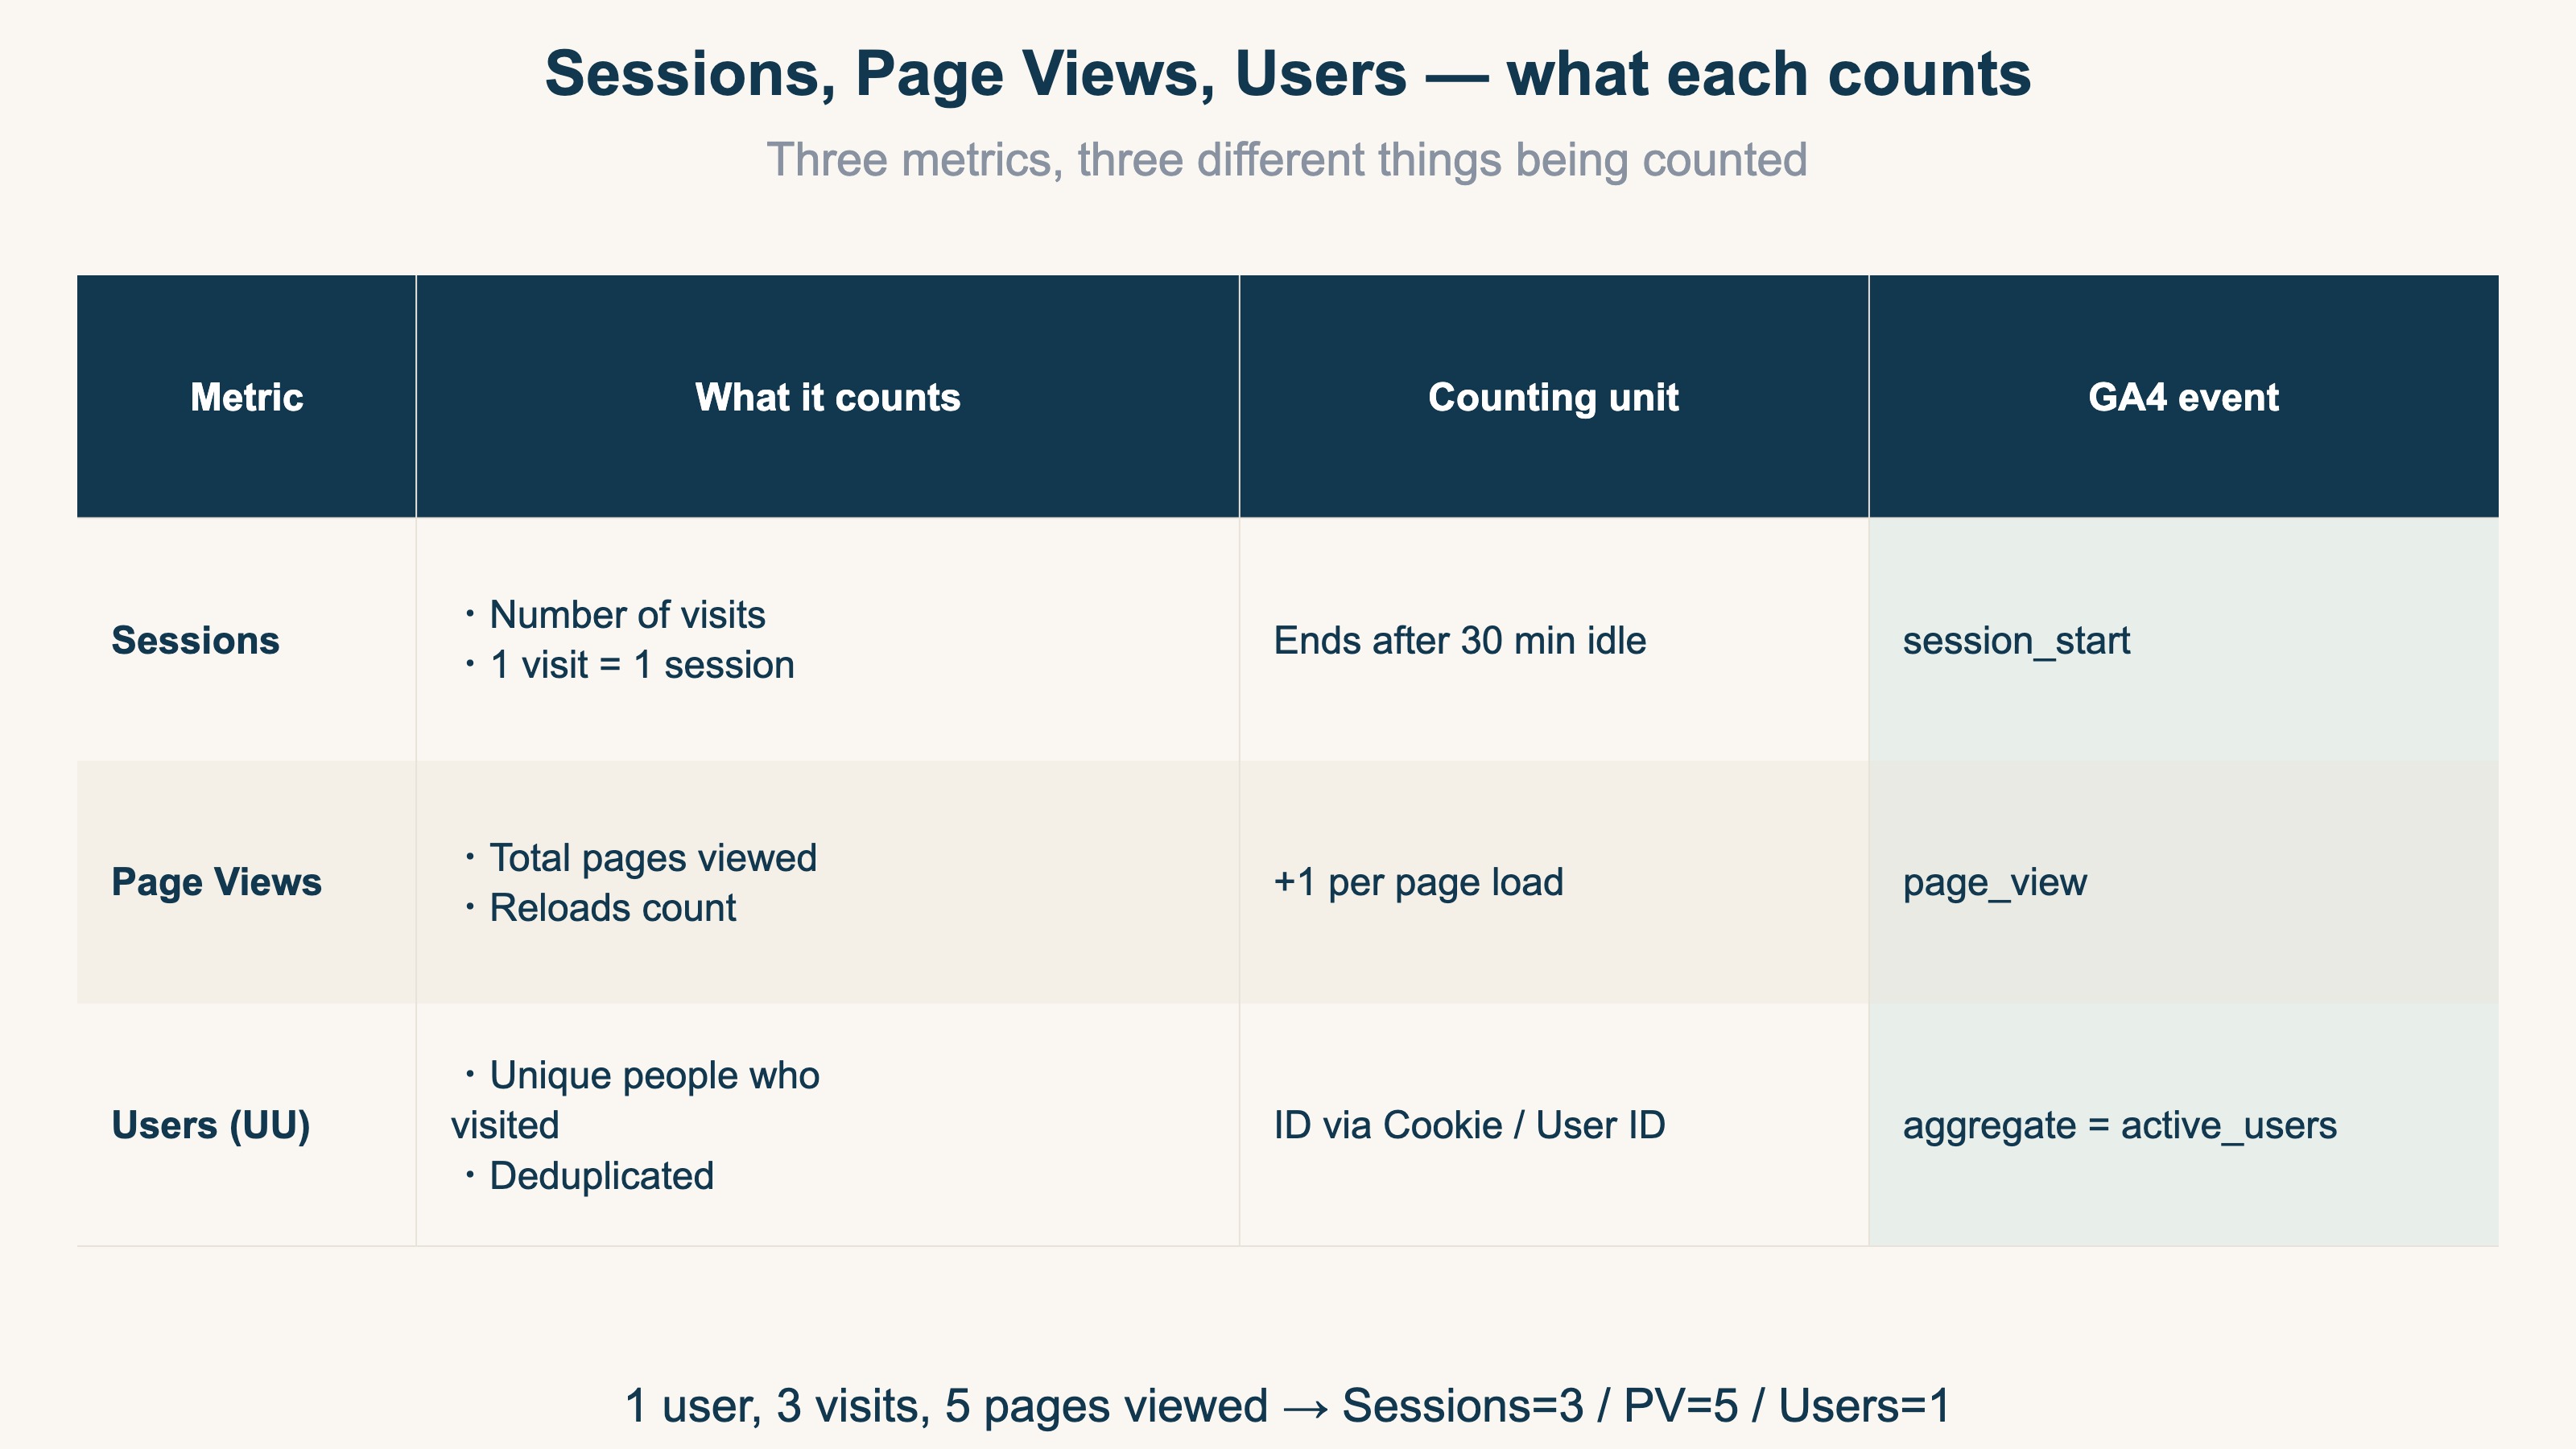
The three metrics count different things
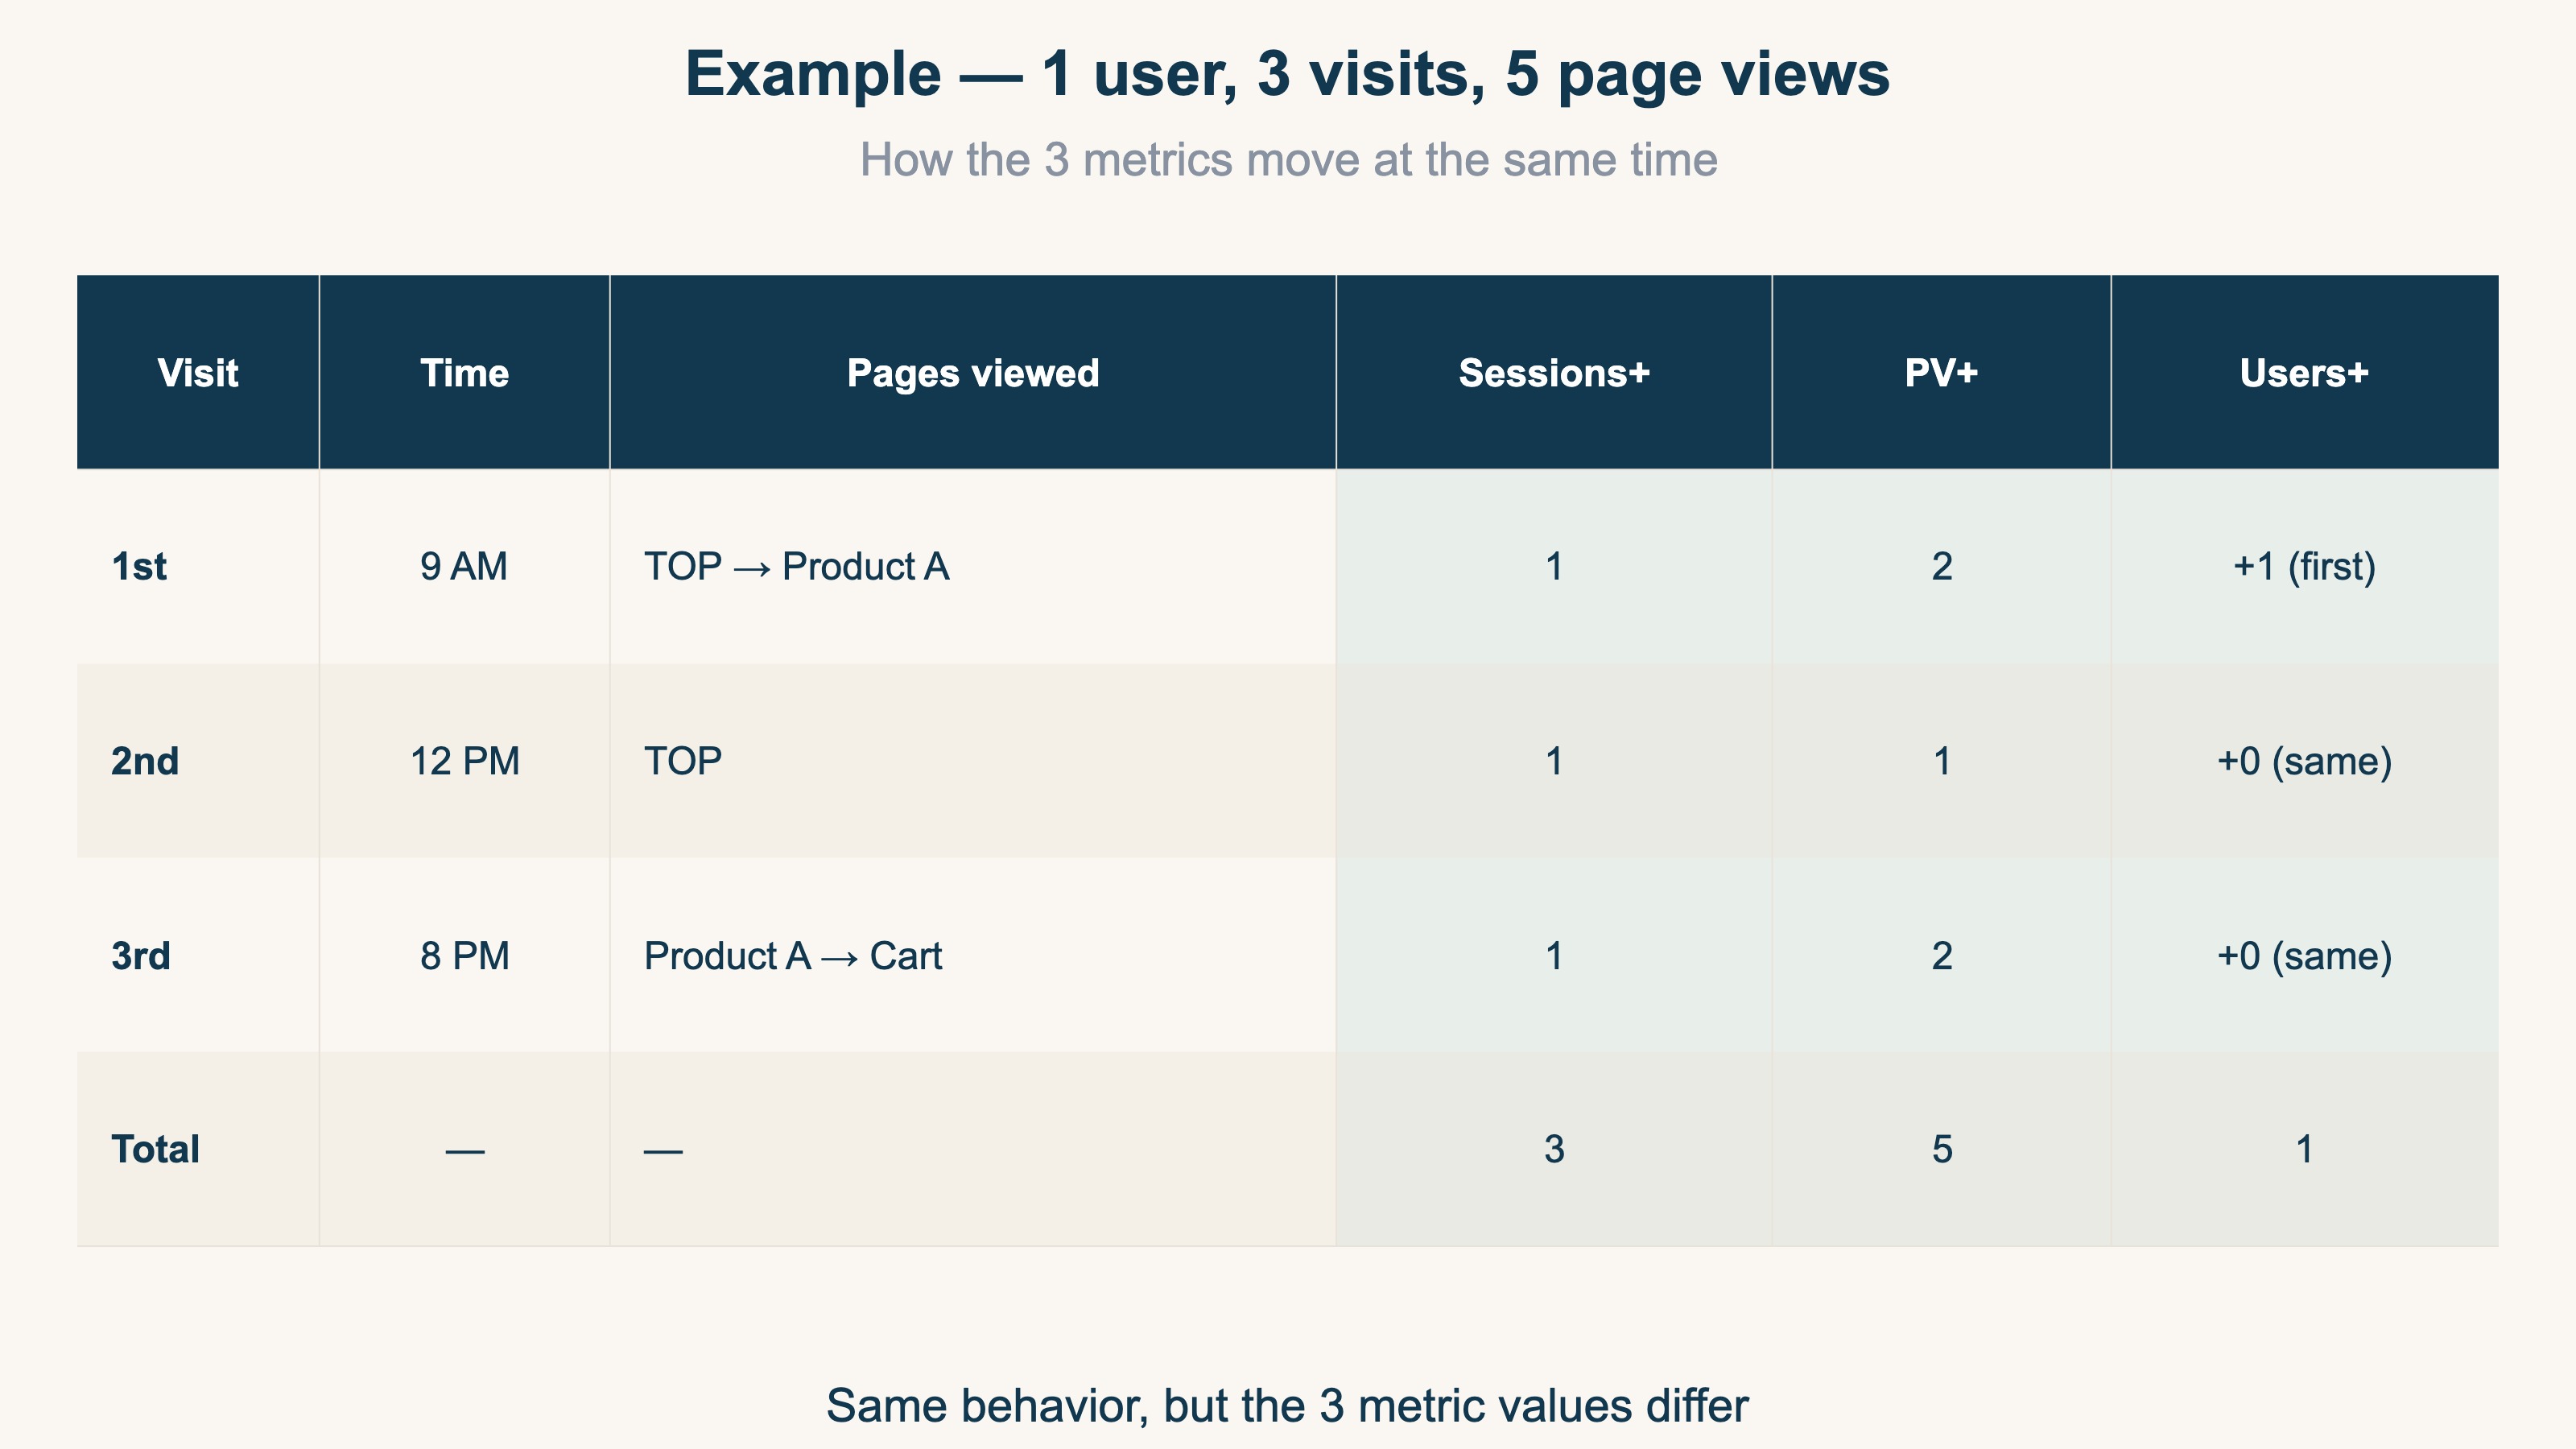
Sessions = number of visits, Page views = pages opened, Users (UU) = number of people who visited. The same person visiting 3 times and viewing 5 pages produces Sessions=3 / PV=5 / Users=1
-
The base inequality is PV ≧ Sessions ≧ Users
A person typically visits multiple times and views multiple pages per visit, so PV is always largest and Users is always smallest
-
For EC operators, look at Users first (reach)
How many people came (Users), then how often they return (repeat), then how much they explore (engagement). Reading PV alone is risky
-
Earning power sits beyond scale
Users, sessions, and PV only show scale. Which visits actually earn revenue is read with revenue per session (RPS)
1. What are sessions: counting visits#
Conclusion: sessions count "how many times people came to the site". It is not a headcount.
A session is the time period during which a user interacts with a site, counted from arrival to leaving as a single unit[1].
Counting rules:
- A session ends automatically after 30 minutes of inactivity
- A new day (midnight) starts a new session
- Closing the browser ends the session
If someone visits at 9 AM, views 3 pages, leaves, and returns at 8 PM the same day, that counts as 2 sessions. Even within the same day, a gap longer than 30 minutes creates a new session.
Common confusion: "Sessions = visitor count" is wrong. The same person visiting 5 times a day produces 5 sessions. Visitor count (Users) is a separate metric.
In GA4, every session start fires a session_start event, incrementing the count by 1. A session_id groups all the actions (page views, clicks, purchases) inside that window.
2. What are page views (PV): pages opened#
Conclusion: PV is one count for every time a page is opened. Opening the same page twice creates 2 page views.
Counting rules:
- Every page load counts (including reloads)
- Viewing 5 product pages produces PV = 5
- Returning to the same page adds another count
A flow of "Home → Product A → Home → Product B → Cart" produces PV = 5. Home was visited twice, so it counts twice.
Common confusion: "High PV = popular site" is wrong. A small group clicking around repeatedly can inflate PV. Always read it alongside PV ÷ Sessions (engagement depth).
In GA4, PV is recorded as the count of page_view events[2]. Reports show it as "Views" or "Page views", but internally it is just the count of page_view events.
3. What are users (UU): counting people#
Conclusion: UU is the number of distinct people who visited in a given period, with duplicates removed[4].
Counting rules:
- Identified via Cookie or User ID
- The same person visiting 10 times still counts as 1 user
- Visiting from another browser or device produces a separate user (different Cookie)
Suppose monthly UU = 1,000 with 200 repeat visitors averaging 3 visits each. New-user sessions = 800, repeat-user sessions = 200 × 3 = 600, so total monthly sessions = 1,400.
Common confusion: "UU = exact number of real people" is wrong. Cookie deletion and multi-device use inflate it; rejected Cookie consent deflates it. This gap cannot be fully fixed by GA4 or RevenueScope — both treat UU as an approximate headcount.
In GA4, this appears as "Active Users"[3]. A user is marked active when an engagement session occurs, or when a first_visit event (first-time visit record) fires.
4. How the three relate: look at users first#
Conclusion: the three are linked by PV ≧ Sessions ≧ Users. For EC operators, the first metric to read is Users (how many people came).
The base inequality is:
PV ≧ Sessions ≧ Users
A person usually makes multiple visits, and each visit views multiple pages, so PV is the largest and Users is the smallest. Equality only holds in the extreme case where every user makes one single-page visit.
The derived combinations are what actually matter in practice:
| Combination | Formula | What it tells you |
|---|---|---|
| Engagement | PV ÷ Sessions | Pages viewed per visit |
| Repeat rate | Sessions ÷ Users | Visits per user |
| Interest depth | PV ÷ Users | Pages per user |
For EC operators, the priority order is:
- Users — "how many people are coming" (reach)
- Sessions ÷ Users — "how often do they come back" (repeat rate)
- PV ÷ Sessions — "are they exploring the site" (engagement)
Reading PV alone is risky. A small group can produce inflated PV while new-user inflow is actually zero.
But everything above only reveals "scale (how many)". With the same Users and the same sessions, which of those visits earns revenue does not show up in any of the three metrics. The largest channel is not always the one that earns the most.
Looking at "scale" and "earning power" together changes how you read each channel. Earning power is expressed as revenue per session (RPS = revenue ÷ sessions; see the RPS guide).
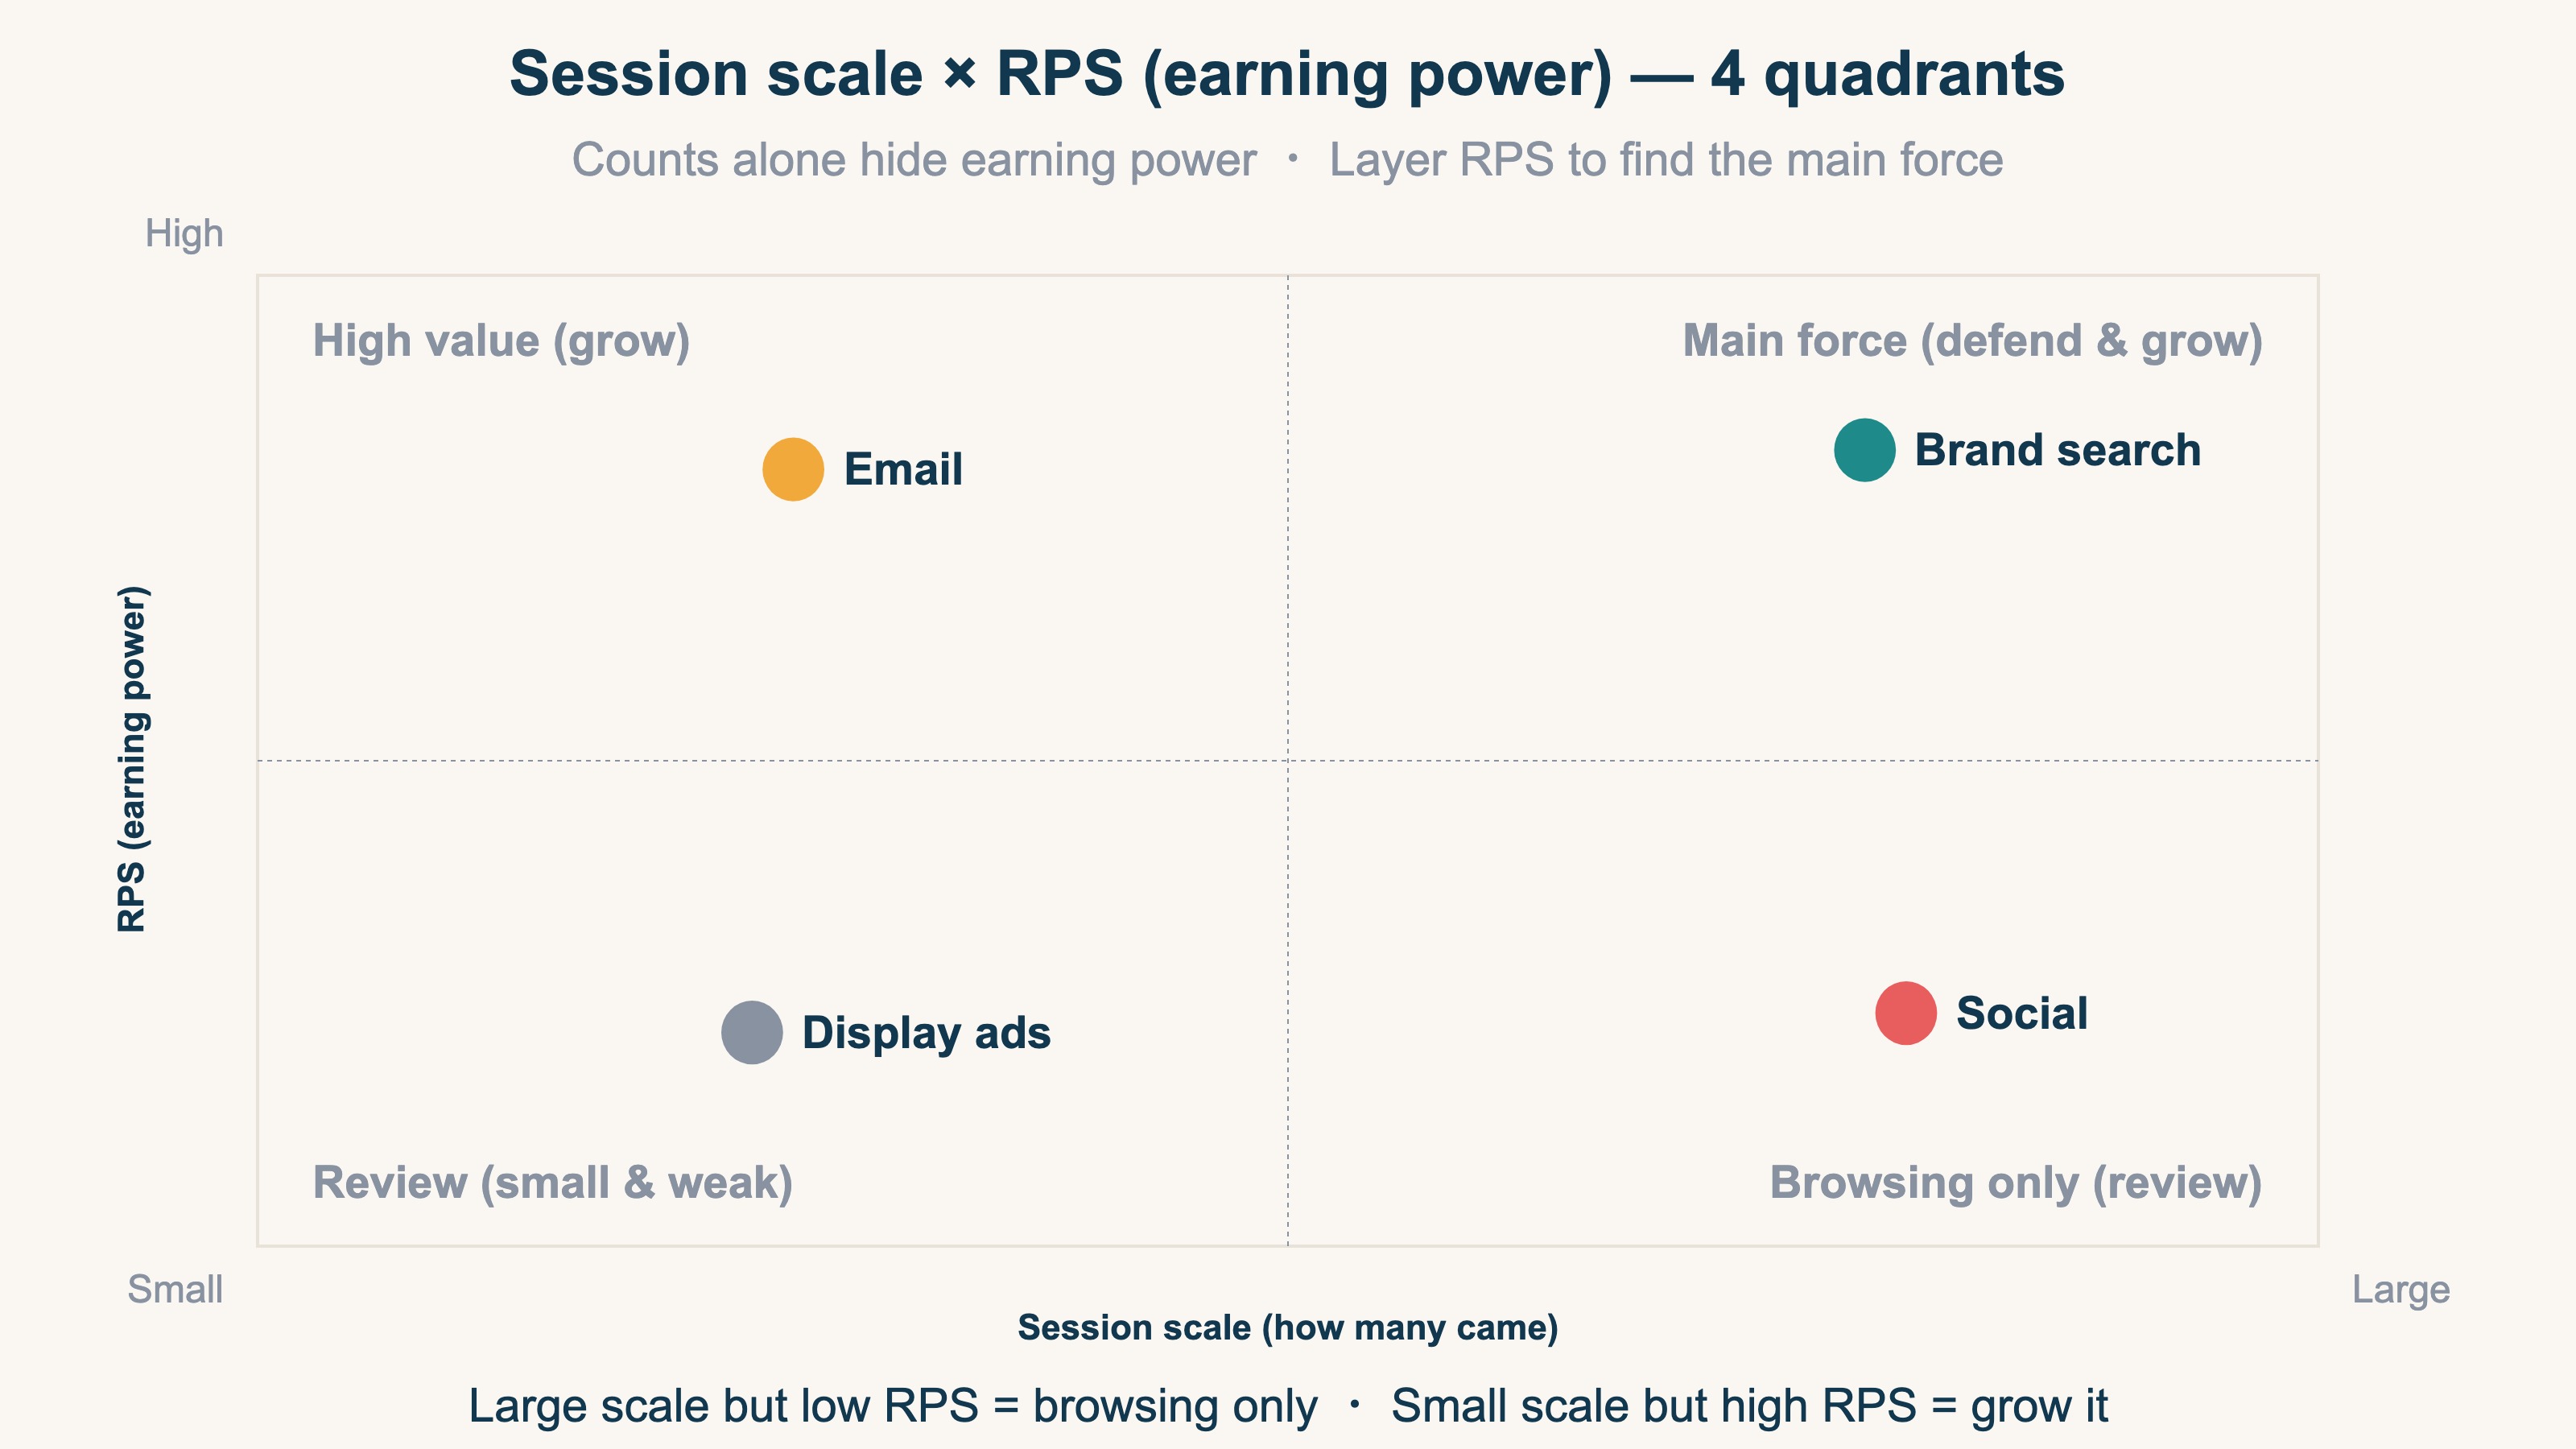
For example, social channels often have many sessions but low RPS — "browsing only". Email, by contrast, can have few sessions but high RPS, marking it as a channel worth growing. Scale alone hides this difference.
5. How GA4 reports the three metrics#
Conclusion: GA4 uses an event-based model, so all three metrics appear as aggregations of specific events.
GA4 switched its measurement model to event-based[5]. This is a fundamental shift from the previous Universal Analytics (UA) session-based model.
Page view, click, scroll, purchase — every action is recorded as an "event". Sessions = count of session_start fires, PV = count of page_view fires, Users = the number marked active. The words "sessions" and "page views" remain, but underneath they are all event aggregations.
How event count and session count differ, and why the numbers diverge, is covered in part 2 of the series, GA4 events vs sessions.
RevenueScope solution
Conclusion: sessions and UU count "how many came (scale)" accurately. But "which visits earned revenue" does not line up on one GA4 screen. That is the gap RevenueScope fills.
GA4 shows session counts in its acquisition report and revenue in its monetization report — on separate screens. A view that lines up channel-level revenue efficiency (RPS) and new-vs-returning revenue on a single screen is not part of the standard product. You can build it yourself in GA4 Explorations, but defining the metrics, segments, and channel conditions by hand every time is heavy and brittle. Understanding the three metrics is easy; producing "which visit earned" across channels every time, by hand, does not last.
RevenueScope removes bot traffic from your own first-party tracking, then lines up real revenue by channel and by new/returning, alongside RPS and average order value (AOV), on one screen. It is the layer that lets you read by earning power, not by counts.
For example, ask the AI "between new and returning visitors, which sells more efficiently?" and RevenueScope answers like this:
| Visitor type | Sessions | RPS (revenue/session) | AOV |
|---|---|---|---|
| New | 3,200 | ¥95 | ¥5,400 |
| Returning | 1,100 | ¥260 | ¥7,200 |
| Total | 4,300 | ¥137 | ¥6,000 |
Demo data. New vs returning is judged by "did they come back on a different day".
By session count alone, new visitors dominate and look like the main force. But by RPS, returning visitors earn ¥260 per visit — about 2.7× the new ones — with a higher AOV too. The pattern "new for volume, returning for earning power" was invisible in the scale metrics.
Once you can see this, the next move follows. Acquire more new visitors, or lean into retention (email, member perks)? You decide where the budget goes from earning power, not scale. That is the next move from "counts" to a revenue decision.
FAQ#
Q1. Is high PV always a sign of a good site?
No, not on its own. PV can be high while Users is low, which usually means a small group is clicking around and acquisition is weak. Read PV alongside Users.
Q2. How do I grow sessions?
You need both new-user acquisition (channel work) and retention (email, push). Retention tends to respond to email cadence and content freshness. Concrete retention tactics are covered in how to improve EC repeat rate.
Q3. Where do I see page views in GA4?
Go to Lifecycle → Engagement → Pages and screens. The display name is "Views" or "Page views", but internally it is the count of page_view events.
Q4. How do I deal with Cookie deletion and multi-device inflation for UU?
You can't fully eliminate it. Treat UU as an approximate count and focus on the direction (rising or falling) over absolute values. This is the same in GA4 and RevenueScope — tracking people to a one-person precision is structurally impossible.
Summary#
PV ≧ Sessions ≧ Users
The three metrics count different things and are linked by this inequality. EC operators look at Users first (reach), then repeat rate, then engagement.
- Sessions = number of visits
- Page views = pages opened
- Users = number of people who visited
But all of this is about "scale". The largest channel is not always the one that earns the most. The next step is to layer "earning power (RPS)" on top of scale and see which visits actually produce revenue. From there, you can decide where the budget goes.
See which ads actually drive revenue, at a glance
Free up to 5,000 sessions/month, AI analyst included. No credit card required. Up and running in 5 minutes.
References#
- [1] Google Analytics Help "About Analytics sessions" (2026)
- [2] Google Analytics Help "About events" (2026)
- [3] Google Analytics Help "Understand user metrics" (2026)
- [4] Google Analytics Help "User: definition" (2026)
- [5] Google Analytics Help "Metrics comparison: GA4 vs Universal Analytics" (2026)