Open your analytics and the first number that catches your eye is visits. More people than last month, lots of traffic on this article — when the number climbs, it feels like acquisition is going well. Japan's online retail market keeps growing year over year [1], and the competition to pull people in on a limited budget keeps getting fiercer. So naturally, your eye goes straight to "how many came."
But the first thing this article wants to offer is a slightly different view. Even if lots of people arrive, if a page is barely read before they leave, that traffic isn't "high quality." How many came (visits) and whether it was read (read-through rate) are two different things. If a page isn't read, people quietly slip away just before the sign-up or inquiry point. This article walks through, in order, how to see acquisition quality not by "how many came" but by "whether it was read — the read-through rate (the share showing how far down a page people read)," and why that becomes a leading indicator of sign-ups and revenue.
Table of contents
Key takeaways#
- Acquisition quality can't be told from visits alone. Even with lots of arrivals, if people leave partway through the body without reading, you're quietly losing them just before sign-up or purchase. How many came and whether it was read are two different things.
- Acquisition quality shows up not in "how many came" but in "how far it was read — the read-through rate." It's not unusual for the page that ranks first in visits to rank last in read-through.
- Read-through rate is only useful when you compare it page by page and entry point by entry point, not as a site-wide average. And it isn't revenue itself — it works as a precursor, a leading indicator.
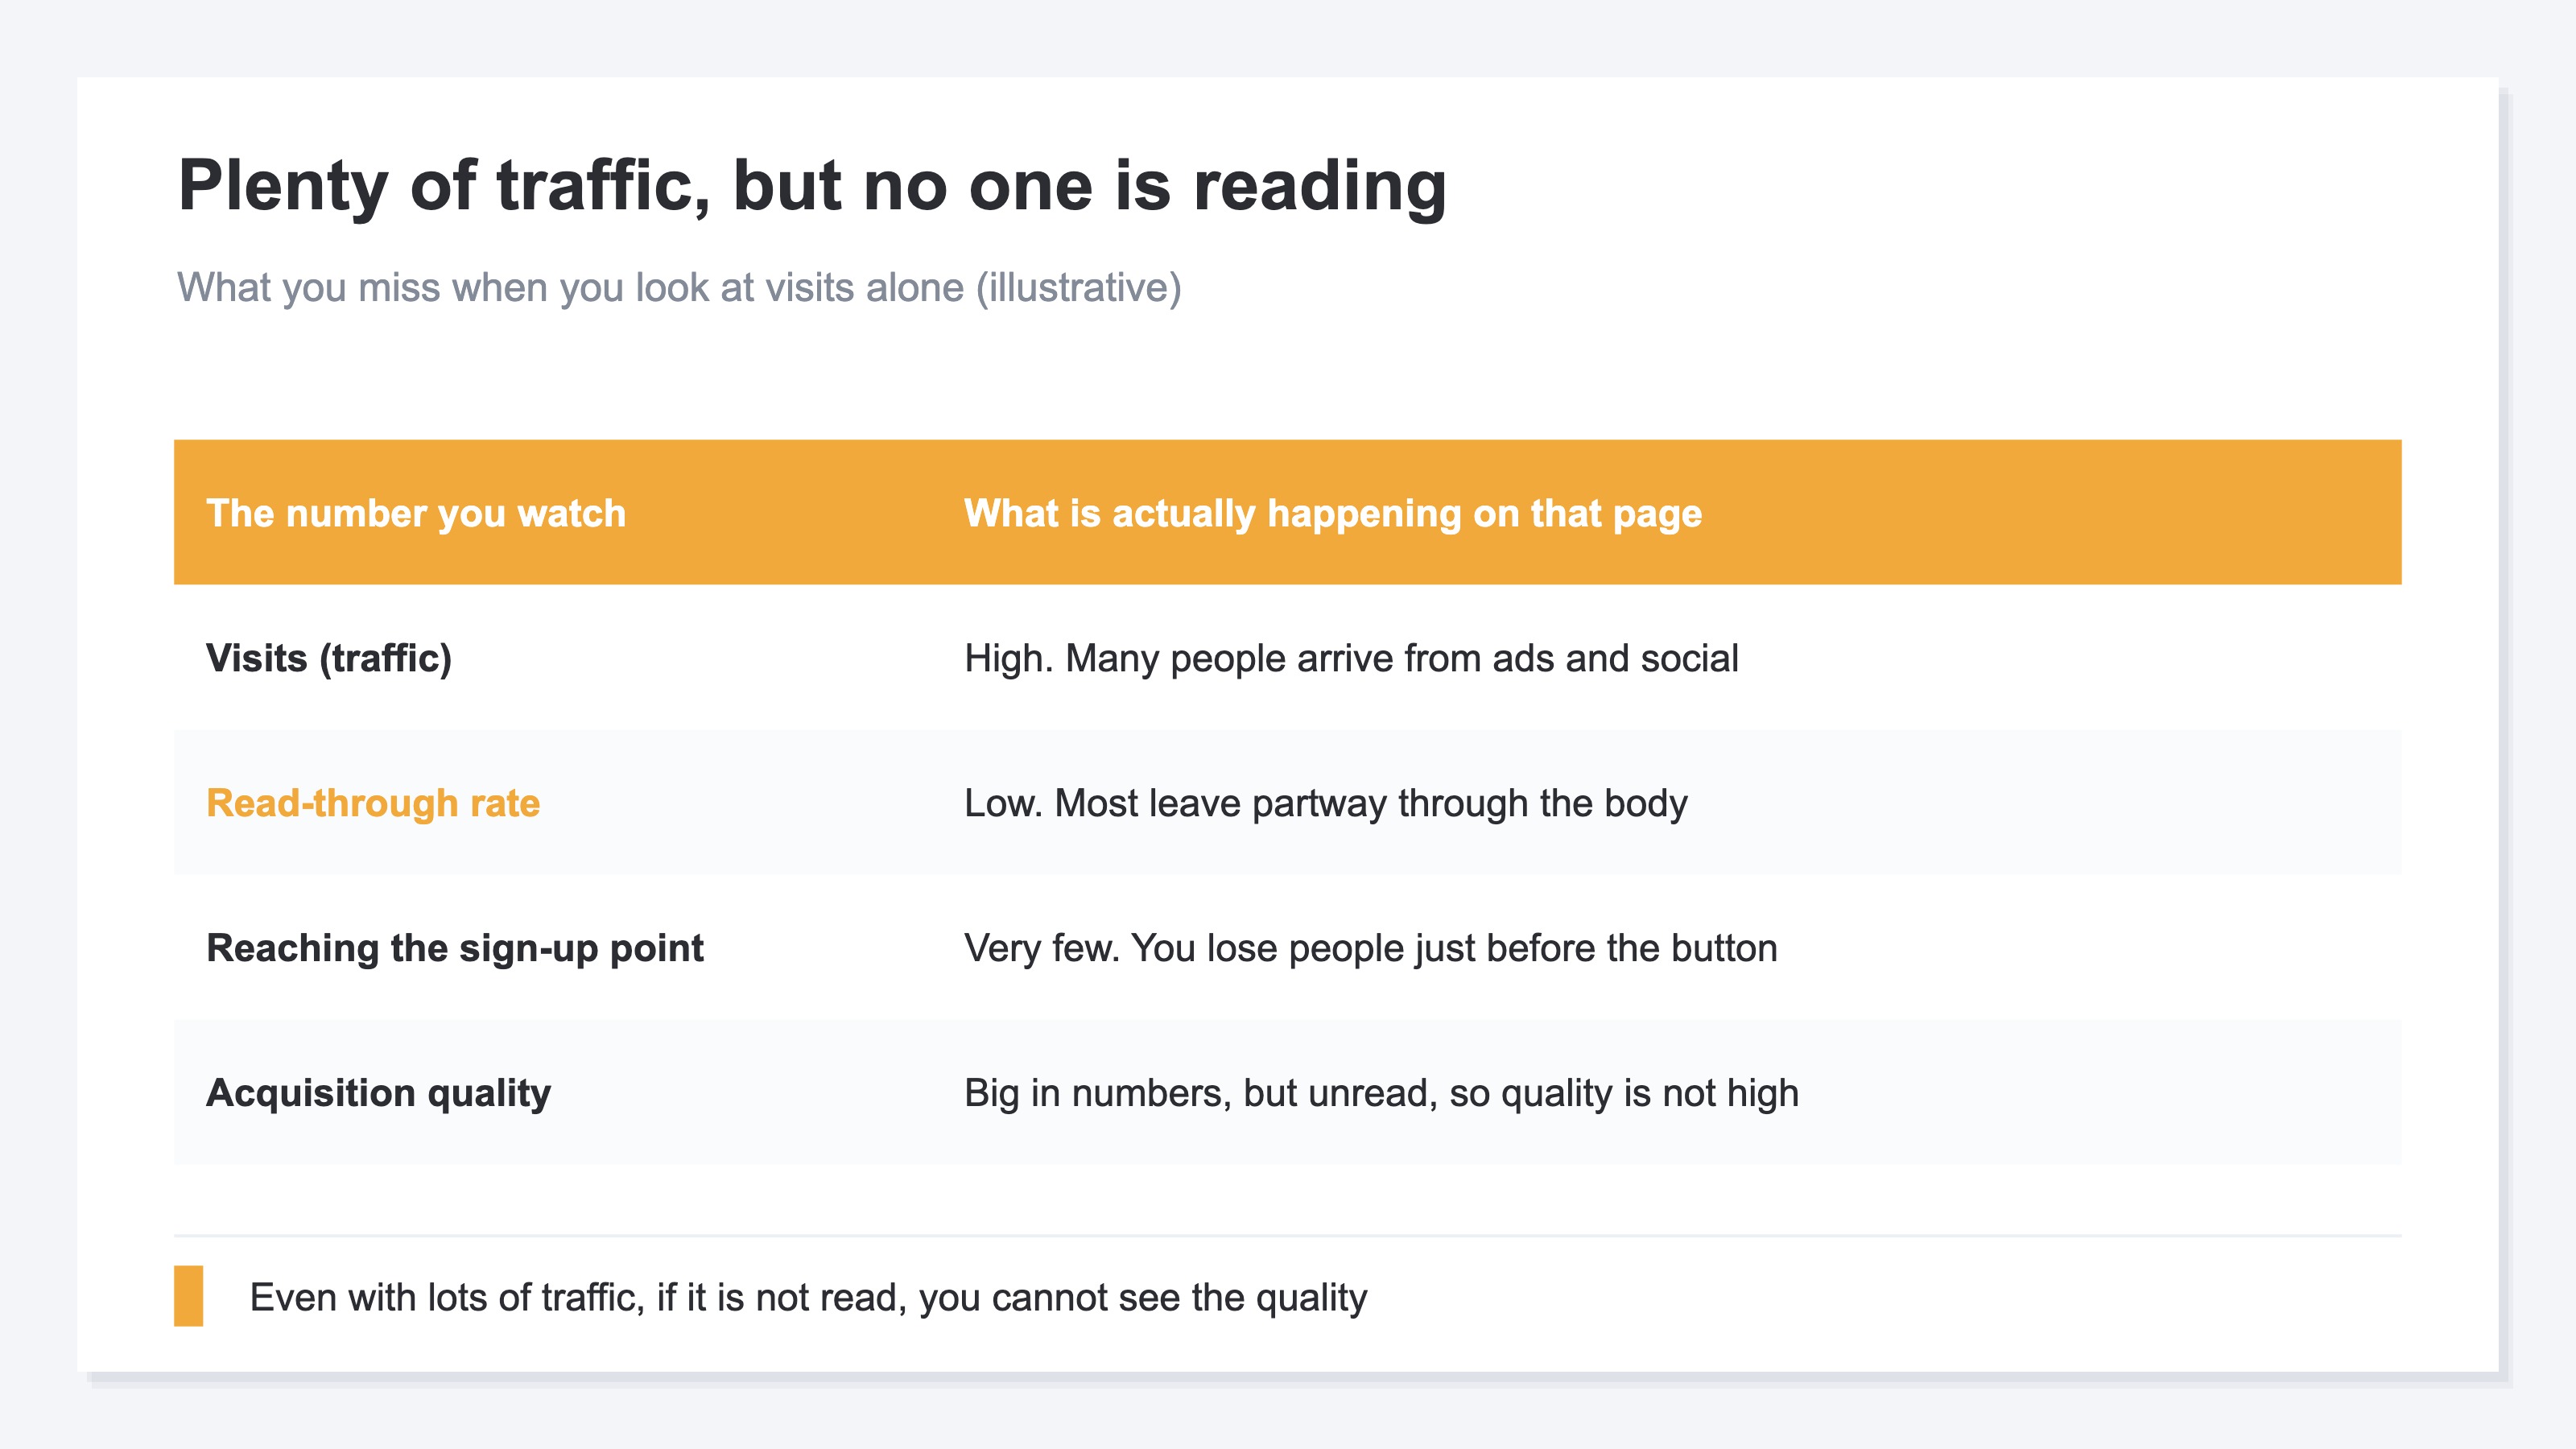
1. Visits alone can't measure acquisition quality#
Bottom line: if traffic is high but people leave without reading, acquisition quality isn't high. That's why visit count is a poor starting point for the verdict.
When you check whether acquisition went well, the easiest thing to look at is visits. A big number is reassuring, and ad and social results tend to be told in terms of "how many came." Visits (PV, sessions) do matter — without a base of traffic, nothing else gets going. The trouble is mistaking the size of that visit count alone for "quality."
Take a blog that once drew 20,000 people in a day. If it later slid to 600 a day, someone watching only the daily visit count would never notice when the quality started to crack. You can see the number rise and fall, but visits never show whether the people who arrived are actually reading. A burst of cheap traffic or social momentum can gather people for a moment, but if they're the wrong fit, they leave immediately.
In fact, search engines are said to watch "did they bounce right back, or did they actually read." A page people return from immediately is read as a weak result; a page that gets read, with dwell time and action, is read as a good one. GA4, too, has engagement metrics that reflect how much a page was read and interacted with [3]. In other words, whether a page was read becomes a stand-in metric for acquisition quality.
The single figure of visit count is a clouded mirror for acquisition quality. So what should you look at? The next chapter lays out the read-through rate that visits alone can't show.
2. Read-through rate reflects whether it was read#
Bottom line: acquisition quality shows up not in "how many came" but in "how far it was read — the read-through rate."
Read-through rate is the figure that shows how far through the body the people who arrived actually read. A common version is the share who scrolled to and reached about 80% of the body. If visits answer "how many came," read-through rate answers "of those who came, what share actually read." In GA4, by setting up an event that measures scrolling, you can capture how far down a single page was read [2].
Why does whether a page was read reflect quality? The reason is simple: when the right-fit people arrive, they usually read to the end. When the wrong-fit people arrive, they leave within the first few lines, thinking "this isn't it." So a page with a high read-through rate can be read as one where the audience and the content mesh — high-quality acquisition. Whether the content is worth reading matters too. Copy that just lists promises gets skimmed; copy that spells out why it works tends to get read to the end.
What's important here is to read read-through page by page and entry point by entry point. A site-wide average alone won't tell you which acquisition is producing quality. The page with the most visits isn't necessarily the most read.
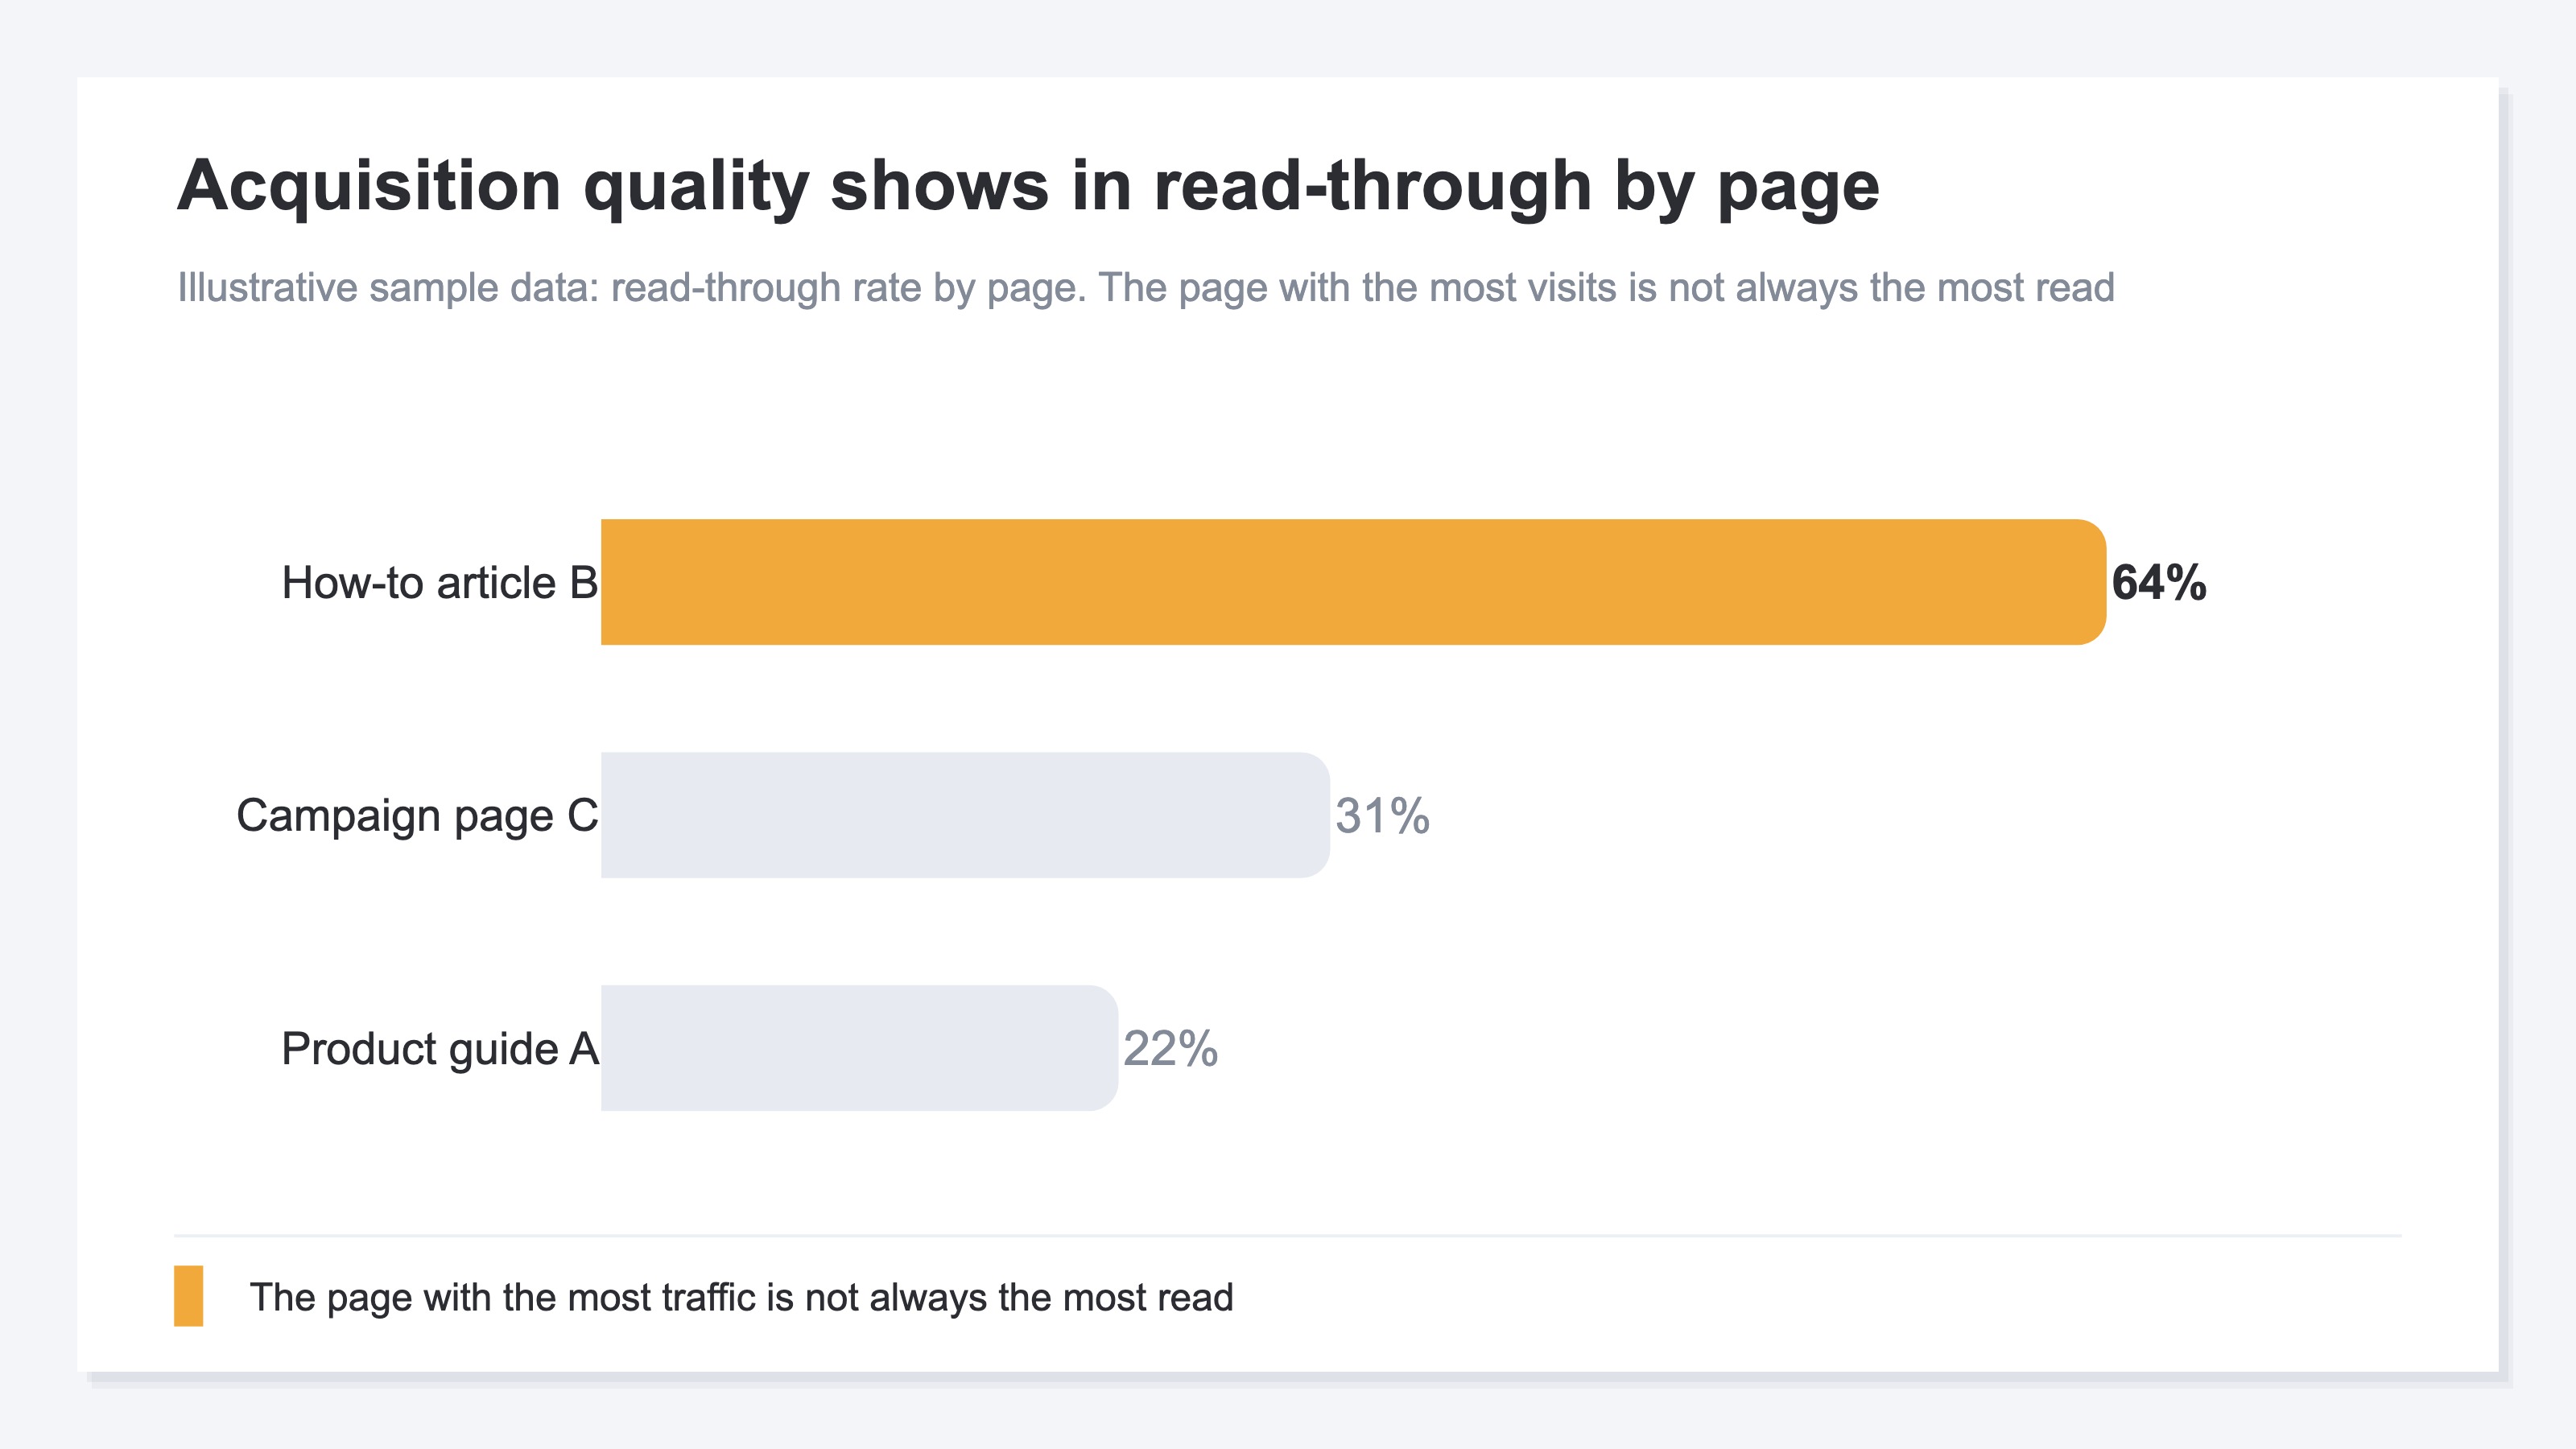
It's not unusual for the page that ranks first in visits to rank last in read-through. The next chapter looks at why this read-through rate becomes a leading indicator of sign-ups and revenue.
3. Read-through rate is a leading indicator#
Bottom line: read-through rate isn't revenue or sign-ups themselves. But as their precursor — a leading indicator — it works remarkably well.
Here's why: the sign-up button and the inquiry form usually sit near the bottom of a page. If people leave partway through the body, they never even see the button. So low read-through (a page that isn't read) means you're losing people before CV (conversion — reaching a sign-up or purchase). When read-through moves, the number of sign-ups moves a little later. Because it moves first, it earns the name leading indicator.
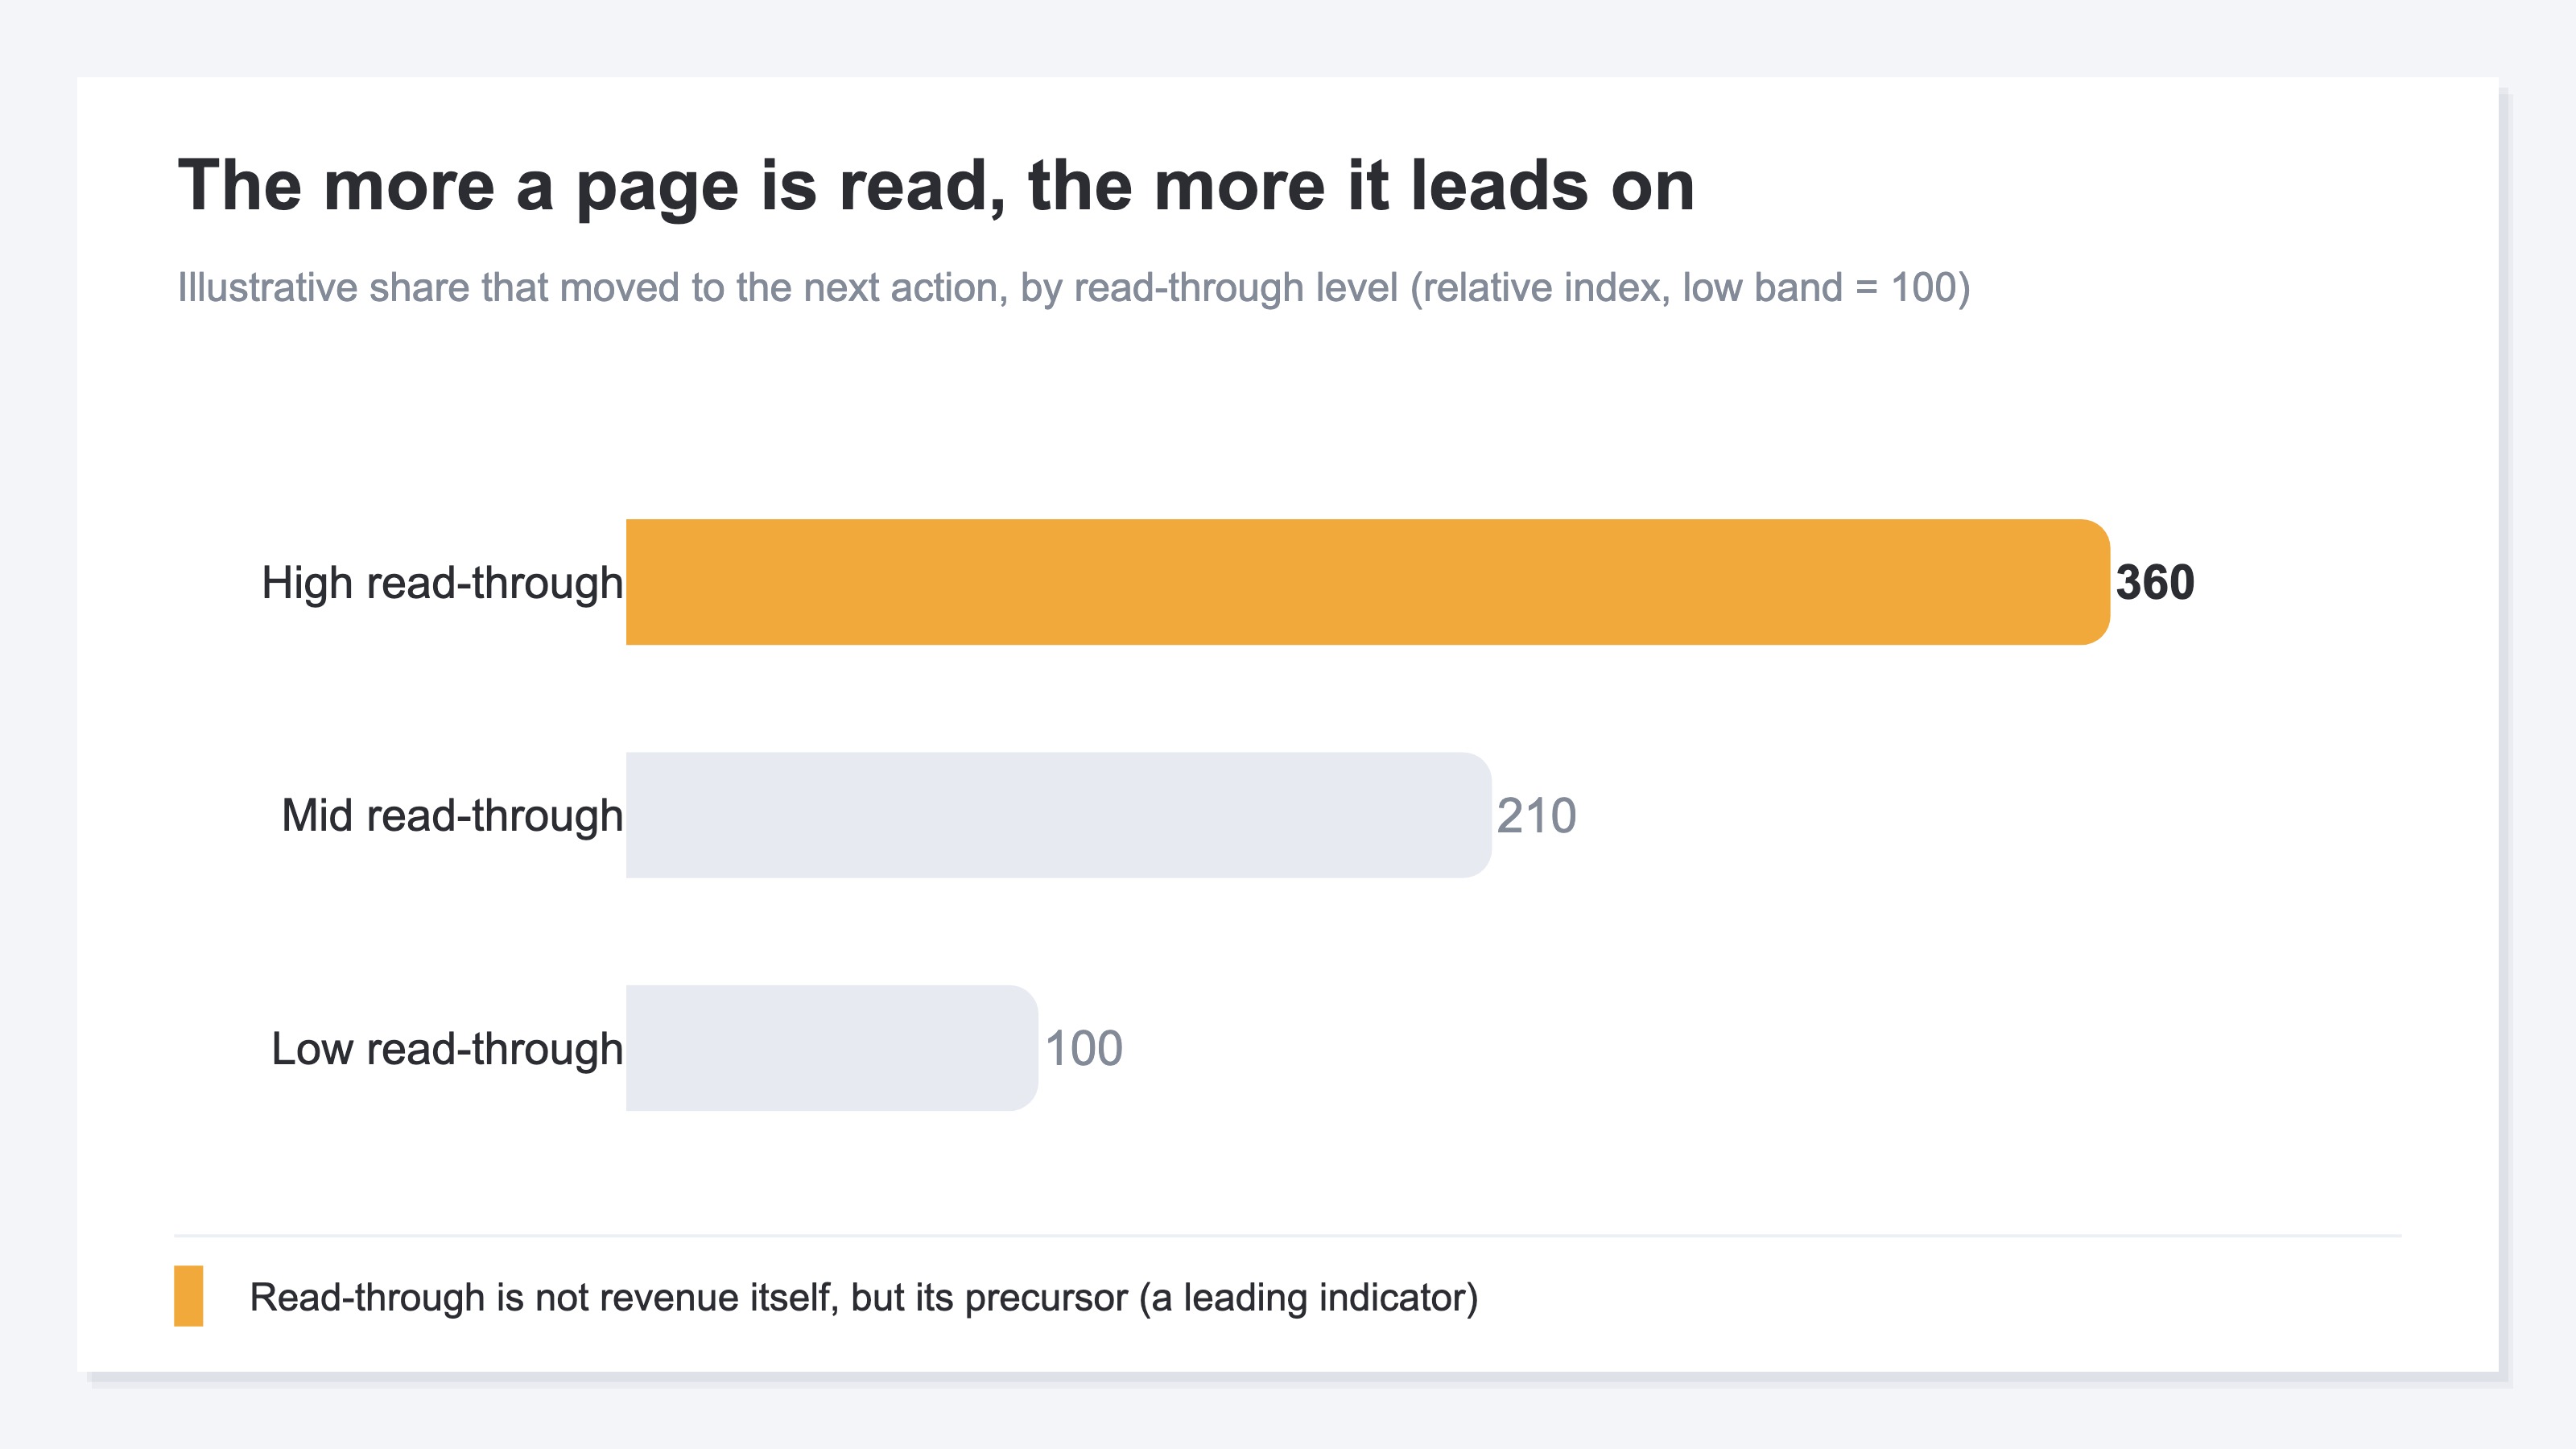
The higher a page's read-through rate, the more likely people are to move to the next action (a sign-up or the next page). Being read means you've carried people that much closer to the sign-up point.
That said, two boundaries are worth making explicit. One: read-through rate is not revenue itself. Even a well-read page won't tell you, from read-through alone, how much it directly earned. Whether it was read (a quality signal) and whether it sold (the result) are different figures. This article focuses on seeing acquisition quality by "whether it was read." The other: telling it apart from similar metrics. Bounce rate and exit rate — the share who leave right after arriving — look close to read-through but are a different thing; the distinction is laid out in "Bounce rate vs. exit rate." A heatmap, which shows where on a page people read and where they leave through shading, is a tool that complements read-through; the choices are compared in "How to choose a heatmap tool." For the difference between PV, sessions, and unique users that represent visits themselves, see "Sessions, PV, and UU," and for the first acquisition metrics to look at, see "The first three metrics for an online store."
The idea itself isn't hard. What's hard is doing this every time — splitting it page by page and entry point by entry point, and tallying it by hand. A simple idea that gets heavier the longer you keep it up.
How RevenueScope helps
Bottom line: when you try to read acquisition quality by read-through, you keep hitting the same wall — measuring "how far it was read" for each page and lining it up against visits to find, every week, the pages with lots of visits but little reading is heavy by hand. RevenueScope brings those figures onto one screen, by page.
In GA4, setting up a scroll event does let you capture how far a single page was read [2]. But once you have to aggregate that across pages and keep matching it against visits, you run out of steam before you reach the actual decision. RevenueScope lays out, on a single screen, the visit count, read-through rate (the share who read to about 80% of the body), and average dwell time for each page (display uses demo data).
| Page | Visits | Read-through (read to 80%) | Avg dwell |
|---|---|---|---|
| Product guide A | 4,200 | 22% | 38s |
| How-to article B | 1,100 | 64% | 2m 10s |
| Campaign page C | 2,800 | 31% | 51s |
The most telling read in this table is that Product guide A, with the most visits (4,200), has the lowest read-through at 22%. By visit count alone A looks like the star pupil, but nearly 80% of arrivals leave partway through the body. Meanwhile How-to article B, with about a quarter of the visits (1,100), has 64% reading to the end of the body. Read by whether it was read rather than how many came, B is the higher-quality one. Watch order count alone and you'd never notice. From here the next move comes into view: A likely has a flood of wrong-fit arrivals, so review its entry points (traffic sources and opening lines); conversely, growing acquisition that resembles the well-read B adds higher-quality visits.
Let's be clear about one thing. What RevenueScope outputs, by page, is visit count, read-through rate, and average dwell time. Visit count and average dwell can also be viewed broken down by entry point (channel), but read-through rate is aggregated at the page level — it does not yet output read-through split by entry point. Nor does it output page-level revenue (how much a given page earned). Read-through rate is a quality leading indicator that sits just before sign-up or purchase; it is not revenue itself. And because the live read-through figures are still accumulating, the table above is sample (illustrative) data. RevenueScope assembles the material for deciding which pages' acquisition to fix or to scale, but the final call is yours.
FAQ#
Q1. I get plenty of traffic, but revenue isn't growing. Where should I look?
After visit count, look at read-through rate. Even with lots of arrivals, if people leave partway through the body — if it isn't read — you're losing them before sign-up or purchase. Look at read-through page by page and hunt for pages with lots of visits but little reading, and the acquisition to fix first comes into view. Before adding more traffic, confirm that the people already arriving are actually reading.
Q2. How high does read-through rate need to be to pass?
There's no single passing line, because it shifts with article length and purpose. What matters is comparison — page against page, entry point against entry point — more than the absolute value. Line up high- and low-read-through pages within the same site, grow acquisition that resembles the high ones, and review the entry points of the low ones. That side-by-side reading is the shortcut to raising quality.
Q3. If read-through is high, will revenue grow too?
Read-through rate isn't revenue itself — it's a leading indicator, a precursor. A well-read page has carried people closer to the sign-up point, so it does tend to lead to revenue. But how much a given page earned is measured by a different figure. Read read-through as "whether it was read — quality" and revenue as "whether it sold — the result," and keep their roles separate.
Summary#
Acquisition quality can't be told from visits alone. Even with lots of arrivals, if people leave without reading, you're quietly losing them just before sign-up or purchase. How many came and whether it was read are two different things.
Acquisition quality shows up not in "how many came" but in "how far it was read — the read-through rate." And read-through is useful only when you compare it page by page and entry point by entry point, not as a site-wide average; only then do you see which acquisition is producing quality. Read-through isn't revenue itself, but it works as a precursor — a leading indicator. Start by taking two or three of your recently well-viewed pages and lining up not just visits but read-through. The discovery that the page ranking first in visits isn't being read turns acquisition you'd been growing on instinct into moves with a reason behind them.
See which ads actually drive revenue, at a glance
Free up to 5,000 sessions/month, AI analyst included. No credit card required. Up and running in 5 minutes.