An article that was steadily pulling people in from search until last week has quietly gone thin on traffic. You open Google Search Console (GSC, the free tool for seeing how you show up and get clicked in search) to find the cause, but which of your dozens of articles slipped isn't visible at a glance. One web builder wrote, "Visits to my site have noticeably dropped over the past two months. I want to pin down what's going on." More than the drop in traffic itself, it's the work of finding "which article, and since when" that trips you up first.
This article lays out how to find content that lost search rankings — not as a one-shot picture of "rates" at a single moment (CTR or average position), but as a way to narrow it down with the position trend over time. We'll walk gently through telling the daily wobble of rankings apart from a real decline, and the order in which to start fixing the articles that need it.
Table of contents
Key takeaways#
- Hunt for an article that lost rankings with a single day's snapshot of "rates" and you mistake the daily wobble for a real decline. Rankings move up and down every day, so one day's number can't tell "a day that just happened to be bad" from "still falling."
- The key to telling them apart is to view position as a trend over time, not as a single point. Trace one article's daily and weekly position on a line, and the real decline hidden inside the small wobble starts to show.
- From there, sort the slipping ones (sliding down from a high rank) from the almost-there ones (climbing on page 2) by rank band and trend direction, and start with the articles that have the most impressions and clicks. Repeating this across dozens of articles every week and laying it all out in one list is the part that quietly gets heavy.
1. Why a single snapshot of rates misses the drop#
When hunting for an article that lost rankings, most people scan a list of CTR (click-through rate) or average position at a single moment. But a one-shot picture has two pitfalls.
The first is that rankings wobble every day. For the same article, the makeup of who's searching and what competitors do that day push the position up and down. On top of that, average position is an impression-weighted average [1], so it gets pulled toward the rank on days with heavy search volume. Judge "it dropped" from one single day and it can be back the next.
The second is the reverse. An article sinking just a little every day stays buried inside the average, so a single day's snapshot never catches it. The more gradually an article slips, the harder it is to spot in any one moment's number. That's why the starting point is a "line," not a "point" — viewing position as a trend over time.
2. View rankings as a trend, not a point#
Pick one article and trace its daily and weekly position on a line. Flip the vertical axis so that higher means a better rank, draw a dotted line for the period's average, and as the line jitters up and down, you can see whether there's a slope pulling it away from the average toward the bottom. If there's a slope, that's the real decline. Rather than cheering or despairing over a single day's swing, you judge by the direction of the line.
![]()
That said, this trend line comes with a few caveats. On any day the article didn't appear in results even once, the number itself is missing and the line breaks. You only see Google Search data, and it lags by two to three days. And what you can trace is the trend for the one article you picked. As for why the impression and click figures don't quite match the overall totals in the details, that's laid out separately in Why your Search Console clicks don't add up.
3. Sort slipping from almost there by rank band#
Even once you find an article trending downward, putting the same energy into every one of them won't last. Sort by two things — roughly where the article sits now (rank band) and whether it's rising or falling (trend direction) — and the order to tackle them comes into view.
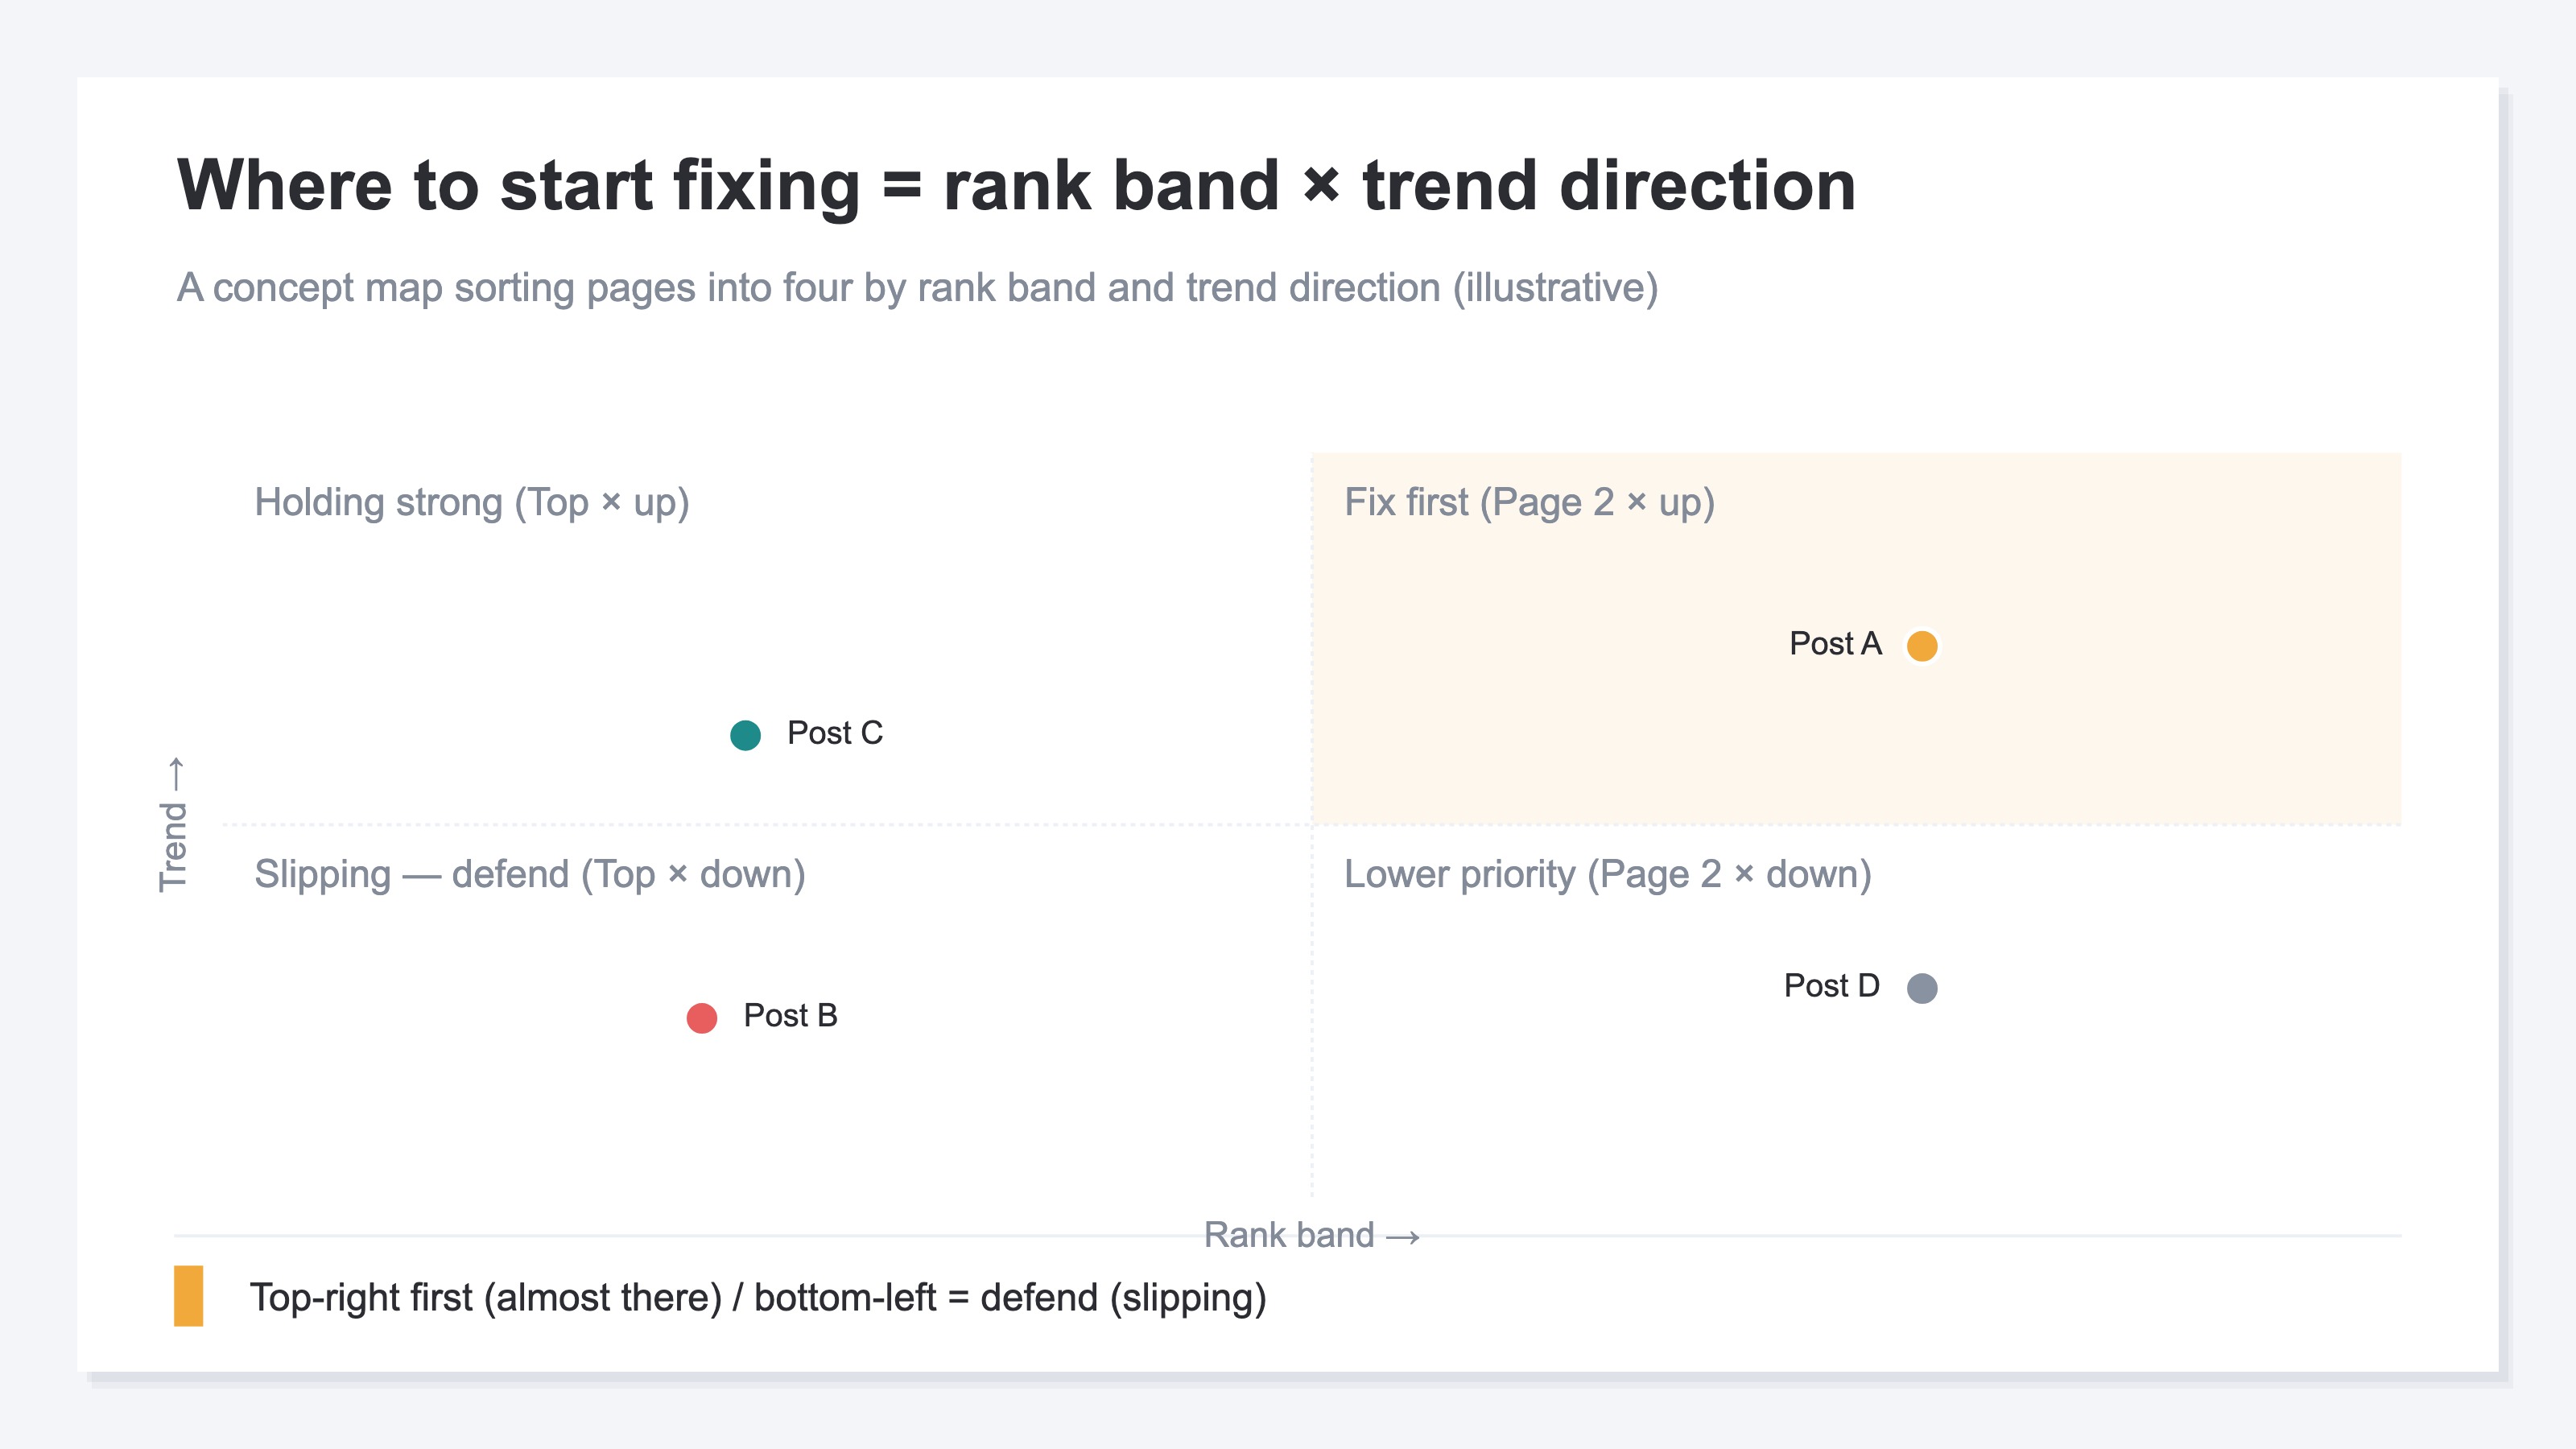
Two corners deserve your attention. One is "slipping" — an article that was ranking high but has started to fall. It was already earning clicks, so leaving it alone means losing a lot of traffic; this is the one you want to defend. The other is "almost there" — an article rising on page two (around positions 11–20). Push it a little and it lands on page one, where clicks jump; the upside is large. The way to handle these page-two candidates at the keyword level is covered in Striking-distance keywords. This article is the step before that: finding "which article" by page × time over time.
4. Find drop candidates across pages#
So far this has all been about one article at a time. In GSC too, pick one article and you can trace its position trend. What's heavy in practice is repeating this across dozens of articles every week.
To grasp which articles dropped, you first have to write out every article's impressions, clicks, and position into one list, compare against the prior period to compute how much each rank changed, and sort by the size of the drop, largest first.
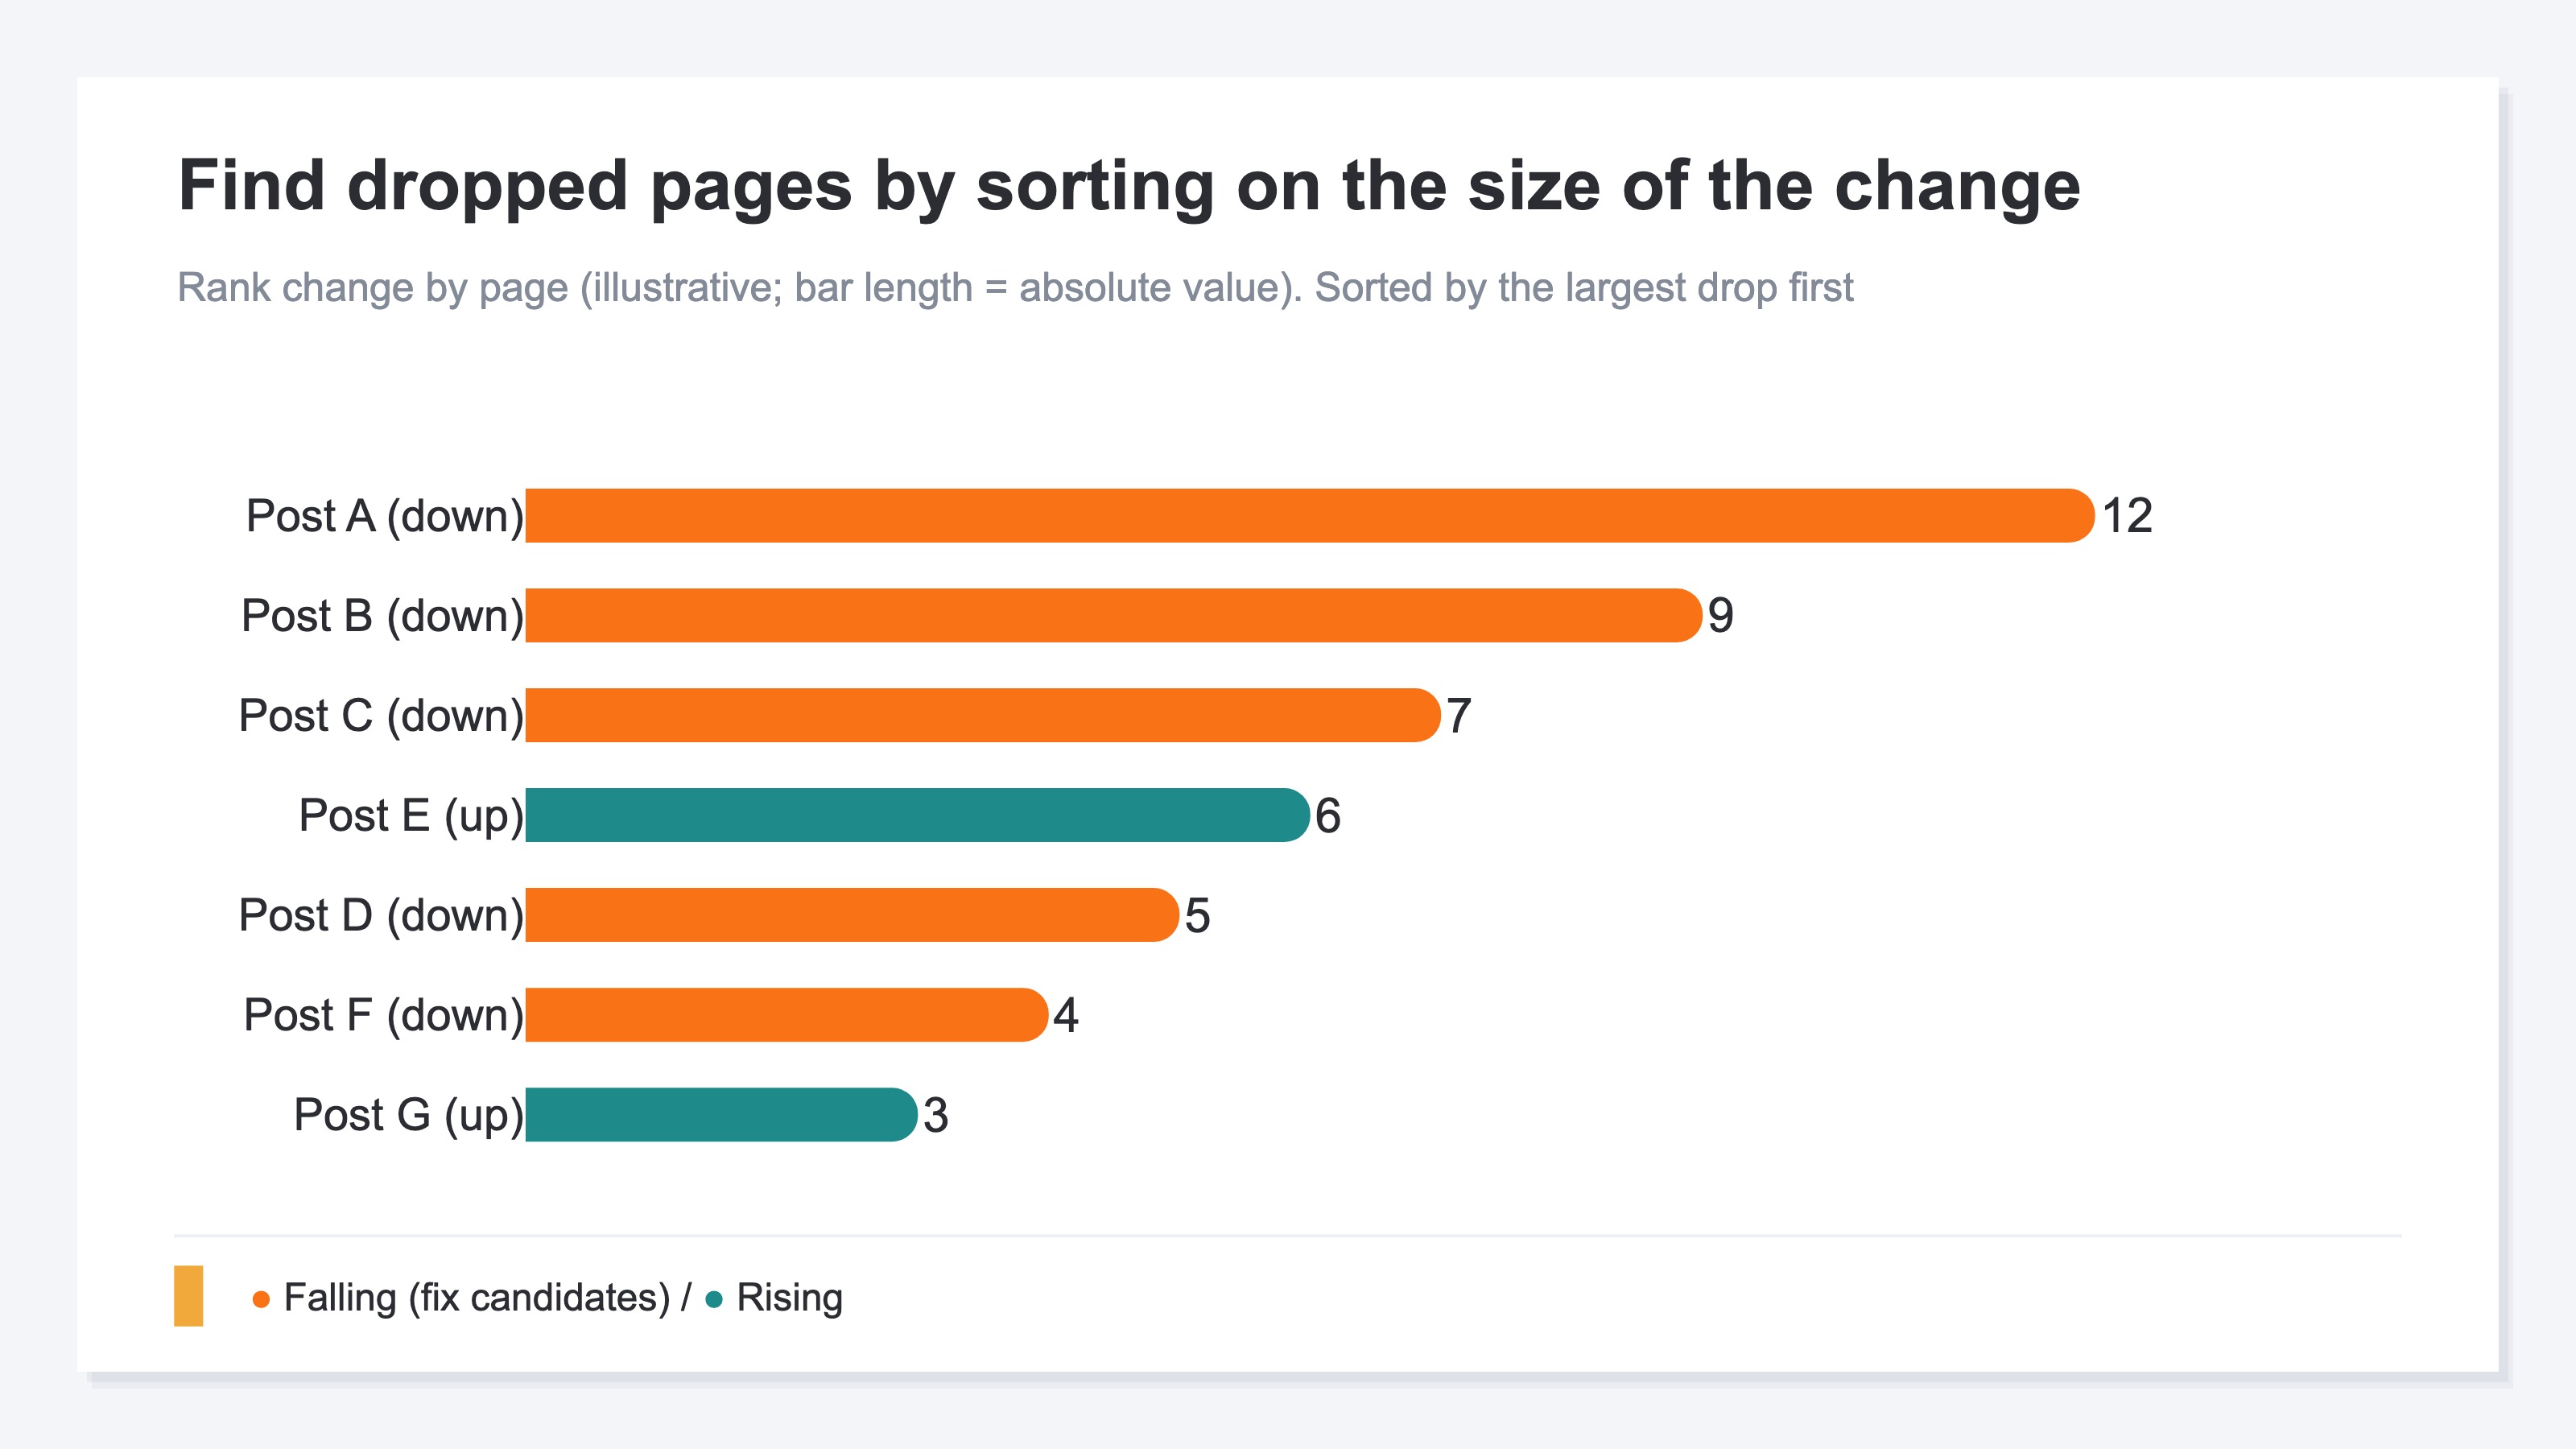
But the GSC screen is built around drilling into one article at a time. It isn't suited to listing and re-sorting the position trends of multiple articles on one screen. So run the tally above by hand every week and you run out of steam before you even get to the point — "which ones to fix." The idea itself is simple, yet it gets heavier the more articles you have and the more weeks you repeat it.
Which dropped article to tackle first you decide from that article's traffic size (impressions and clicks) and its rank band. An article with lots of impressions that's slipping loses a lot of clicks if left alone, so defending it comes first. An article with few impressions but rising on page two has large upside, so you go on the attack — and so on. Once you've found the drop candidates, the order in which to fix titles and snippets is covered in Impressions but no clicks.
RevenueScope's solution
When you try to find articles that lost rankings, you keep hitting the same task in the end. The trend for one article you can trace in GSC, but the part where you lay out dozens of articles in one list every week, sort by the size of the rank change, and decide "which to fix first" by traffic size — that you can't see without re-assembling it every time.
RevenueScope binds that scattered work onto one screen. It gathers per-page impressions, clicks, CTR, and position into a table and shows them sorted by the size of the rank change (display uses demo data).
| Article | Impressions | Clicks | Position | Rank change (WoW) | Status |
|---|---|---|---|---|---|
| Inventory management tips | 8,400 | 96 | 6.2 | ▼3.4 (down) | Slipping · defend |
| Free-shipping setup | 5,100 | 58 | 12.8 | ▲2.1 (up) | Almost there (page 2) |
| How to write a return policy | 1,150 | 13 | 9.4 | ▼0.4 (flat) | Watch |
The telling read in this table is that "Inventory management tips," which has the most impressions, has dropped about 3.4 in position from the prior week. It was already earning clicks, so leaving it alone means losing a lot of traffic — this becomes the top priority to defend. Meanwhile "Free-shipping setup" sits at 12.8 — page two — yet it's rising, an "almost there" that a small push lands on page one. It has less than half the impressions, but the upside is large. Watch only the count, or only the rank, and that priority never settles.
Open the row of an article you're curious about and you get that one article's daily and weekly position, clicks, and impressions trend, plus position_delta (the rank difference from the prior period; a negative value means the ranking rose). Grasp "which article dropped" from the list, then open the row to confirm "since when and by how much it dropped." Because you can move between the list and the trend on one screen, even patrolling dozens of articles leaves time for the judgment.
Let's be clear about one thing. What RevenueScope outputs per page is impressions, clicks, CTR, and position — along with their trends. It does not output per-page revenue or CVR (revenue is read at the channel or search-keyword level). So you can't rank dropped articles by "how much revenue this article directly earned." Which to fix you decide from traffic size — impressions and clicks — and the rank band. When you want to add a hint of estimated revenue at the search-keyword level, the keyword-side features fill that in. Also, the position trend uses only Google Search data and lags by two to three days, and country or device filters don't apply to the position trend. It assembles the material, but the final call on which articles to fix is yours.
FAQ#
Q1. My rank dropped on just one day. Should I fix it right away?
Not yet. Position moves up and down every day, so a one-day dip might just be wobble. Look at the trend over several days to a week, and check whether the slope pulling away from the average toward the bottom keeps going. If the line's direction stays pointed down, it's a real decline. Judge by the line, not by a single point.
Q2. Between "slipping" and "almost there," which should I tackle first?
Decide by the size of the traffic you'd lose. An article with lots of impressions that's slipping from a high rank loses a lot of clicks if left alone, so defending it comes first. An article with few impressions but rising on page two will land on page one and grow if you push it, so that's where to attack. For both, weigh the two together — traffic size (impressions and clicks) and rank band — and choose.
Q3. Is GSC enough on its own?
If all you want is to view one article's position trend at a time, GSC can trace it. What gets heavy is the repetition of laying out dozens of articles in one list every week, sorting by the size of the rank change, and picking off drop candidates. When you have a tool that shows this together on one screen, you can spend your time on the judgment of "which to fix" rather than on the tallying.
Summary#
Hunt for content that lost rankings with a single day's snapshot of "rates" and you mistake the daily wobble for a real decline. Rankings wobble every day, and the more gradually an article sinks, the more it blends in and escapes a single-point number. So view position as a trend over time, not as a point.
Tell the real decline apart from one article's position trend, sort the slipping (high rank × falling) from the almost-there (page two × rising) by rank band and trend direction, and start with the articles that have the most impressions and clicks — that's how you find the articles that need fixing. The hard part isn't the idea but repeating it across dozens of articles every week and laying it out in one list. Start by picking one article whose traffic worries you, and trace not a single day's number but several weeks of trend. Once the line's direction is visible, the dropped articles you were hunting on instinct turn up in an order you can stand behind.
See which ads actually drive revenue, at a glance
Free up to 5,000 sessions/month, AI analyst included. No credit card required. Up and running in 5 minutes.
References#
- [1] Google Search Console Help "Search performance report (position and average position)" (2024)
- [2] Google Search Central "How average position is calculated (weighted by impressions)" (source name only; URL unverified)
- [3] Ahrefs "Striking Distance Keywords" explainer (source name only; URL unverified)