"I opened Google Search Console and the per-query clicks don't add up to the overall number. Is the reporting broken?" If you tried to verify your organic traffic and ran into this discrepancy, you are far from alone.
Bottom line: this is not a bug, it is by design. Queries with very few searches are removed from the table as "anonymized queries," so summing the rows will never reach the overall total.
And the bigger gap sits outside what Google Search Console counts. I measured my own site (revenuescope.jp) over the most recent 30 days. The real sessions arriving from Google search came to about 15 times the sum of the per-query clicks in Google Search Console. Judge by the per-query clicks alone and you read your site's true reach at one-fifteenth of what it is.
Table of contents
Key takeaways#
- The per-query total falling short of the overall total is by design — low-volume queries are dropped from the table, so summing the rows will not reach the overall chart total
- The cause is "anonymized queries" — queries searched by only a few dozen people, or queries containing personal information, are hidden, but their clicks are still included in the overall total
- Not knowing the gap leads to bad decisions — cut low-volume queries because "0 clicks means no results" and you kill growing buds with your own hands
- Judged on per-query clicks alone, your site looks about one-fifteenth its real size — over the most recent 30 days on our own site, real sessions from Google search ran about 15 times the sum of the per-query clicks, and anonymization accounts for most of that gap
- Clicks are visible; revenue is not — neither Google Search Console nor GA4 records "how much each keyword sold"
1. Clicks don't add up — what is actually happening#
Bottom line: the per-query table total and the overall chart total are not meant to match.
The Google Search Console performance report has two totals: the overall total shown in the chart, and the sum of each row in the per-query table.
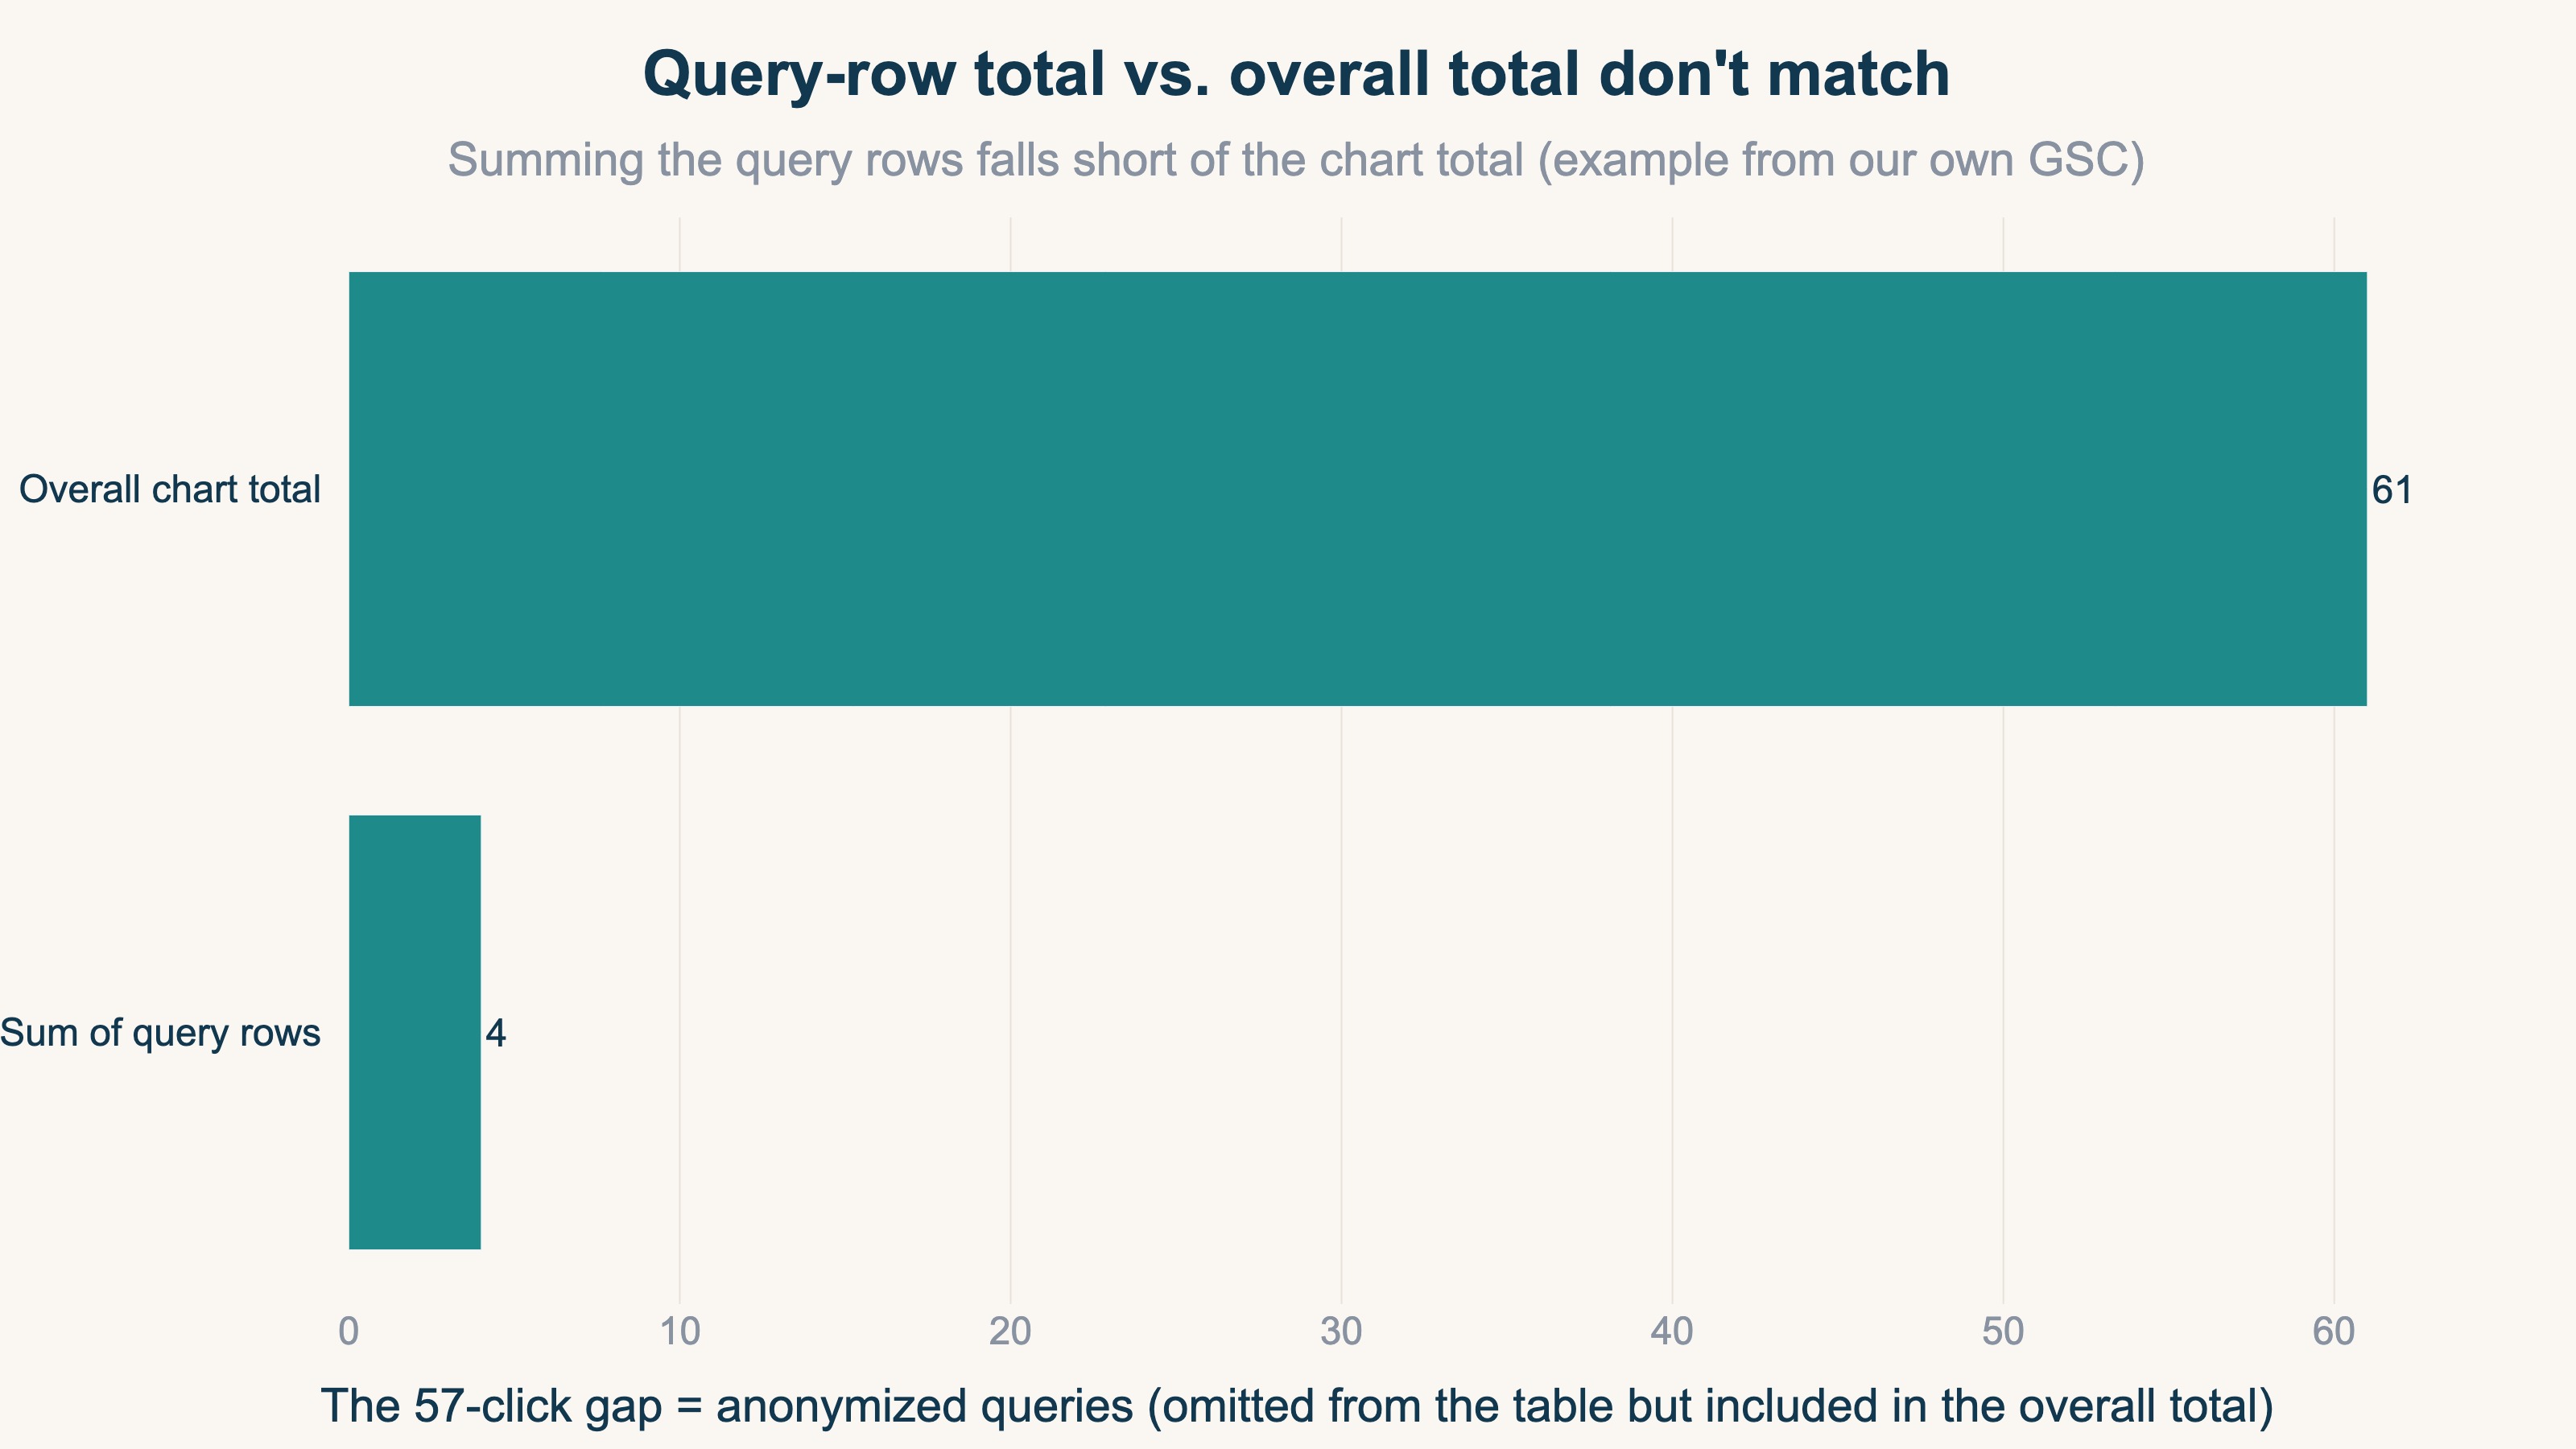
When I checked the real data for my own site, the per-query rows did not even sum to a tenth of the overall total. This is the behavior Google explains in its official blog, which describes a case where "the rows sum to 450 while the chart total is 550" [1].
The difference arises not because the aggregation method differs, but because some clicks never appear in the table.
2. The main cause: anonymized queries#
Bottom line: queries with very few searches are removed from the table as anonymized queries.
Google does not show queries that only a tiny number of people searched. These are called anonymized queries. The threshold is "queries not searched by more than a few dozen people over a 2-3 month period," and queries containing personal or sensitive content are also covered [1]. It is a privacy safeguard to keep the searcher from being identified.
The key point: the clicks that don't appear are still counted in the overall total. They drop out of the per-query table but are added into the chart total. That is why no amount of summing the query rows ever reaches the overall total.
| What you're looking at | Treatment of anonymized queries |
|---|---|
| Overall chart click total | Included (so the number is larger) |
| Each row of the per-query table | Excluded (so it falls short) |
| When filtered by query | Excluded (filtering always lowers it) |
Google's design philosophy is simple: protect the content of searches (who searched what), but show the overall counts accurately. So the total is the real number, and only the breakdown is partly hidden. The lower your traffic, the harder it is for each query to reach a few dozen people, so the share that gets anonymized grows.
3. Cutting pages at 0 clicks is the loss — three rules for reading with the gap in mind#
Bottom line: if you don't know the data is incomplete, you kill growing buds with your own hands.
The real loss happens when you make decisions without knowing about the gap. The common misjudgment goes like this:
- You open the per-query table and a page appears to have 0 clicks
- You conclude "this page is producing no results from search"
- You stop improving it or adding articles, and abandon the related keywords
But 0 clicks in the table may simply mean they are hidden by anonymization. In reality the page may be steadily clicked through from a small number of searches — a bud about to grow that you just stopped by hand. This trap is especially easy to fall into for new sites and for pages targeting niche, low-volume keywords. The share that gets anonymized is large, so on the table they look like "zero results."
Anonymized queries are by design, so you cannot remove them. Instead, follow three reading rules that assume the gap.
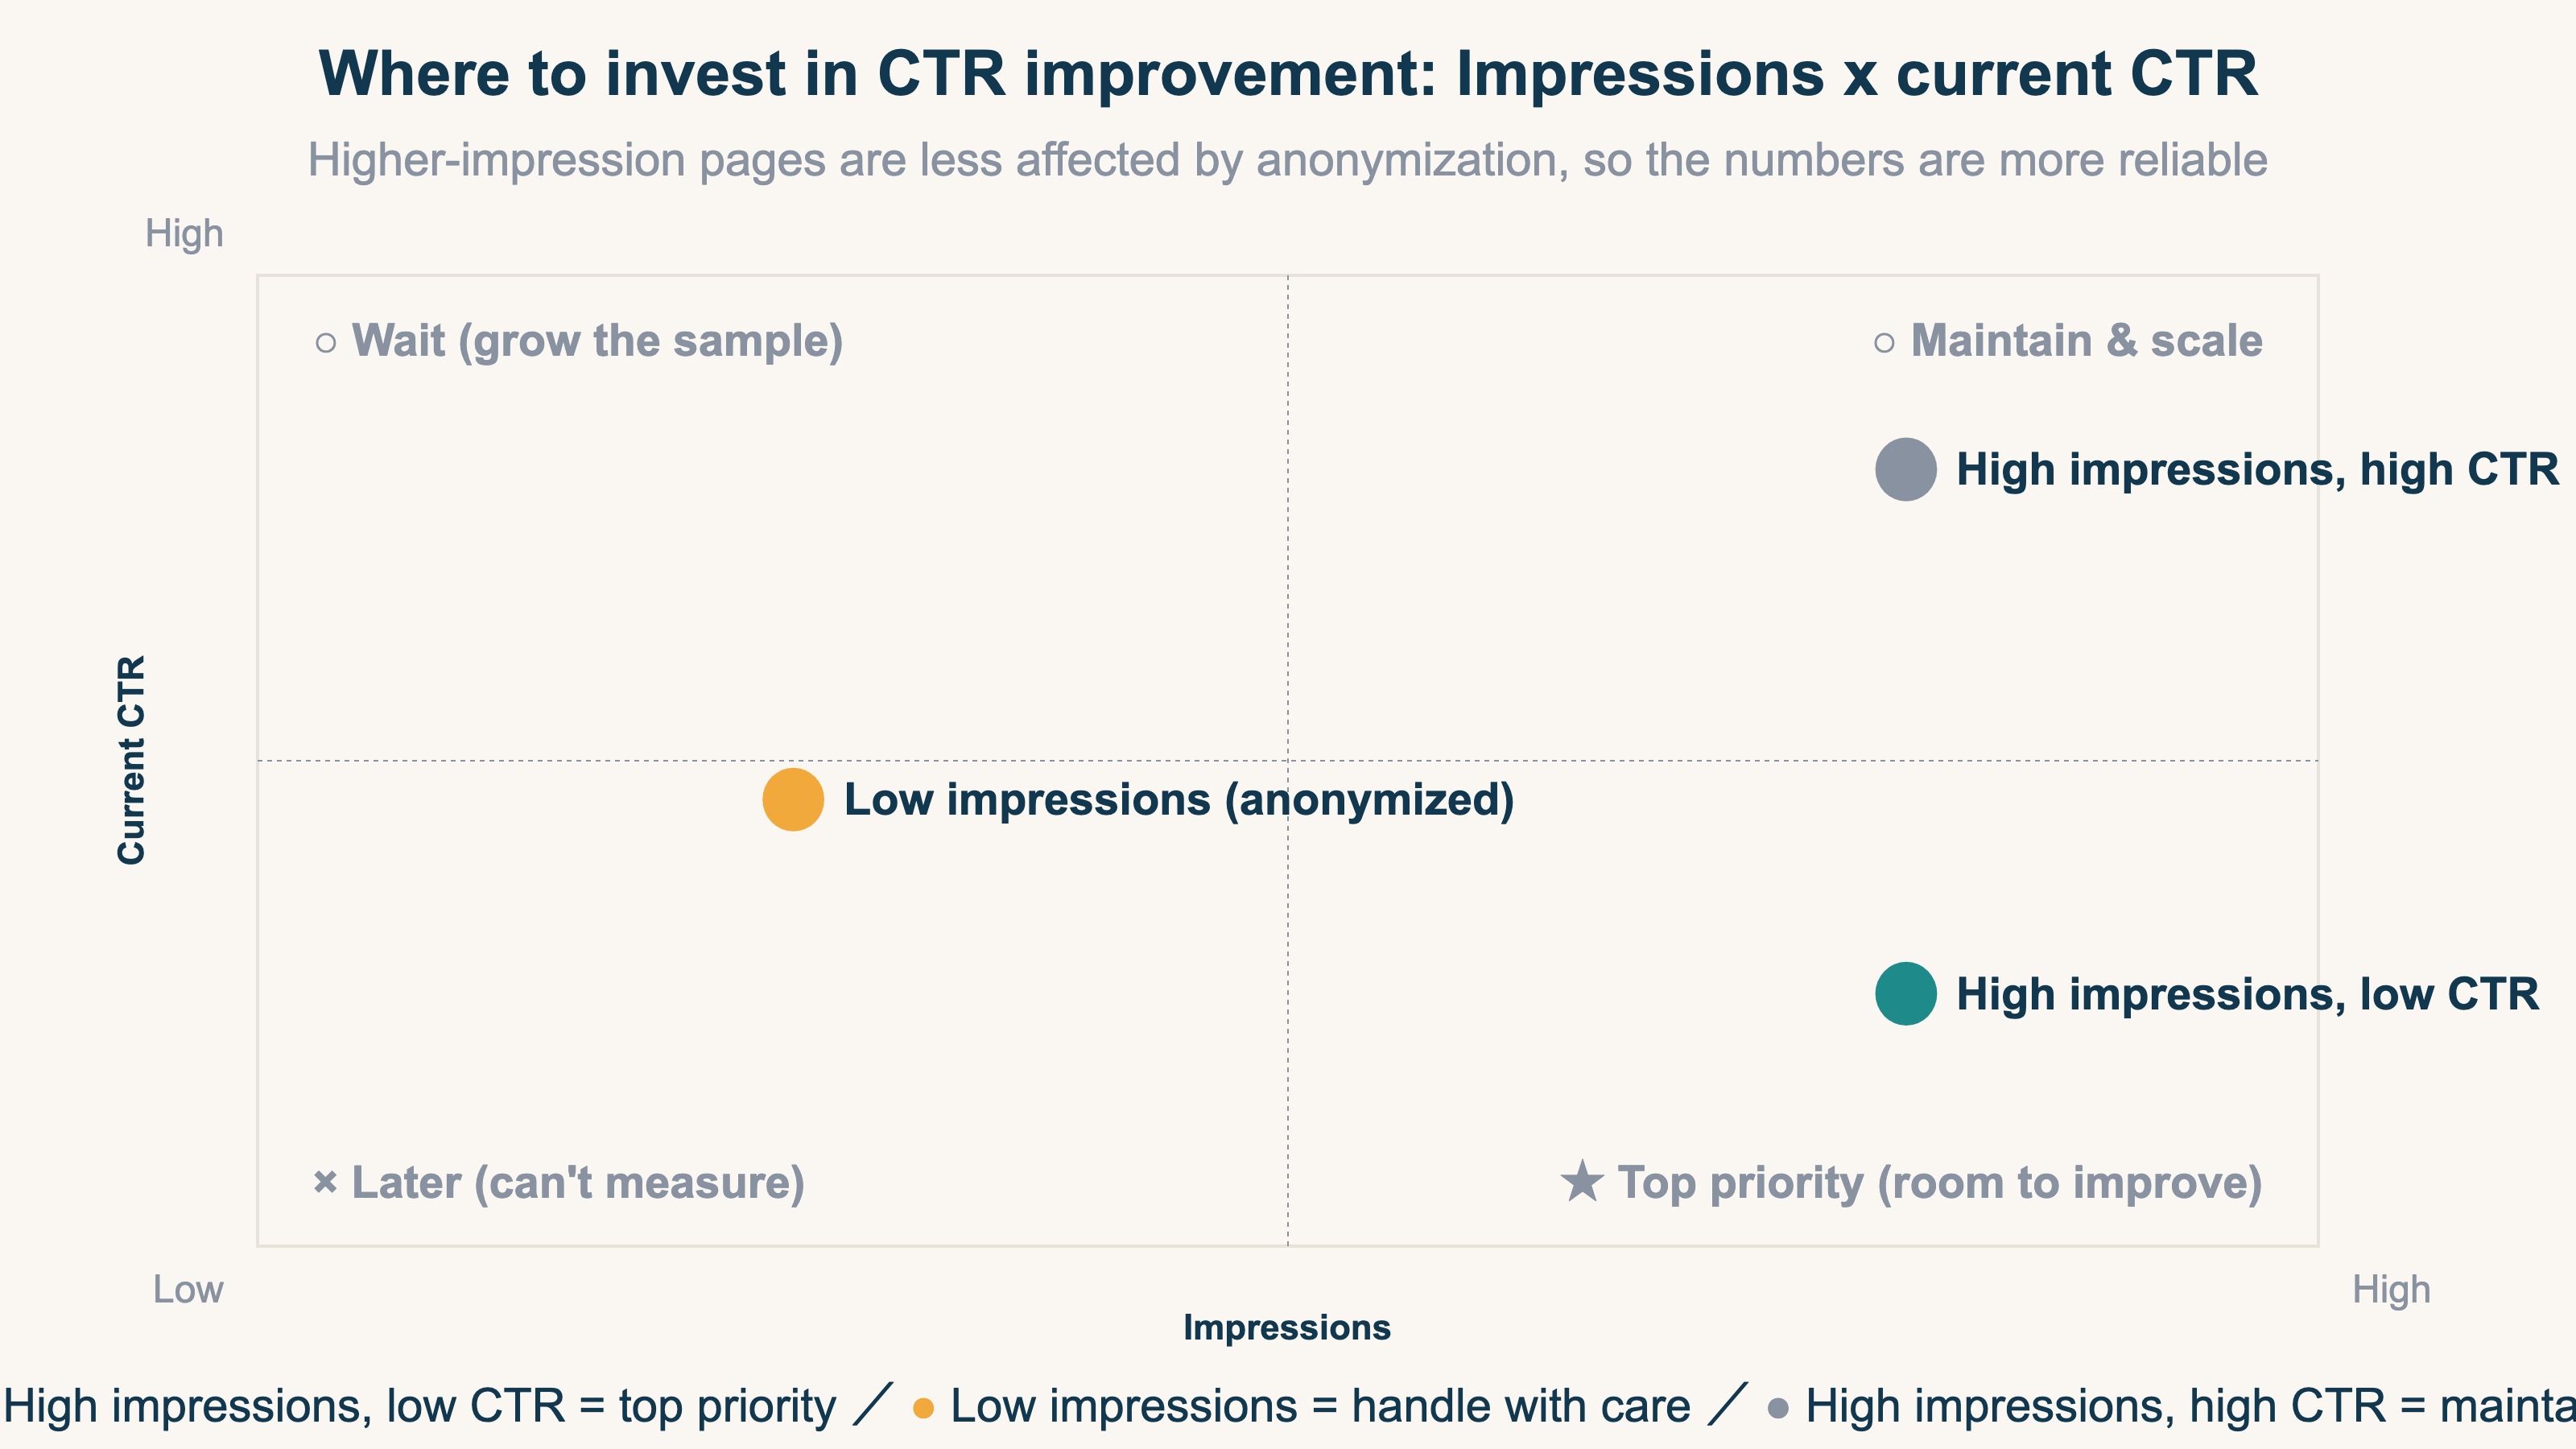
- Focus CTR improvement on high-impression pages — high-impression pages have more searchers, so the impact of anonymization is small and you can trust the table figures. The improvement payoff is also larger, making them the first thing to work on.
- Treat "low impressions, 0 clicks" as a spec, not an anomaly — it may simply be absent from the table while actually being clicked. Don't cut it over the 0; watch it for a while.
- Read by page, not by query — page-level totals are less affected by anonymization and give you a clearer overall picture. Use the per-query view as a supplement.
As the matrix shows, pages with high impressions and a low click rate are the top priority for improvement. Conversely, treat low-impression pages carefully, assuming their numbers are incomplete.
But these three only guard against misreading clicks. A "looks-excellent" page with high impressions and a high click rate that in fact generates zero revenue never shows up in Google Search Console.
4. Google Search Console data is only part of the whole#
Bottom line: the data Google Search Console shows is always only part of the whole.
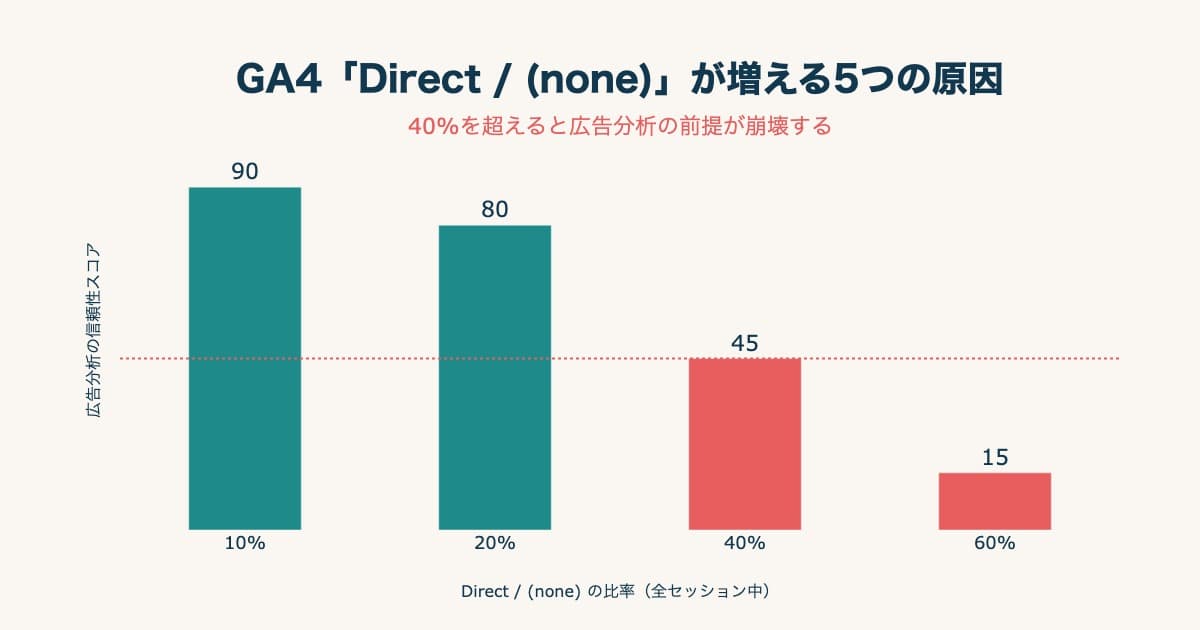
The anonymized-query issue is not unique to Google Search Console. The way GA4 lumps traffic sources into "Direct" or "(none)," and the last-click bias that credits only the last ad clicked, share the same root. Tools turn only the part they can see into numbers and show it to you.
- For how sources go missing and fall into Direct, see 5 Causes of Rising GA4 "Direct/(none)" Traffic and How to Fix Them
- For the last-click bias that distorts ad evaluation, see The Last-Click Trap That Skews Ad Budget Decisions
To see how wide the gap actually runs, I measured my own site. The subject is revenuescope.jp over the most recent 30 days (July 11 to August 10, 2026). I compared the sum of per-query clicks in Google Search Console against the Google search sessions recorded by our own site tag, after bot exclusion. Real sessions came to about 15 times the per-query click total. Only a small share of keywords showed any clicks in the table at all; the visits happening outside that list never show up.
| The lens you're using | Covers | What it counts | Judged on this alone |
|---|---|---|---|
| Google Search Console clicks | Google search only | Clicks on the search results | Anonymization and engine coverage make your site look smaller |
| Sessions from your own site tag | Every search engine | Visits that reached the site (bots excluded) | You can't tell which keyword brought them |
This roughly 15x figure compares Google search sessions only, and most of the gap comes from anonymization. When you set the two lenses side by side, two more differences stack on top.
- The search engines covered differ — Google Search Console handles Google search alone. On our own site, Bing and Yahoo! JAPAN accounted for about 7% of all search sessions. That share never enters Google Search Console in the first place.
- Whether bots are excluded — on our site, the bots removed from Google search traffic amounted to about 10% of the sessions that remained. For Direct the removed bots actually outnumbered what remained, at about 2.3 times. Read a total that never excluded bots and you swing the other way, overstating your reach.
On top of that, clicks and sessions count different units to begin with. Google Search Console and your own site measurement are separate systems, and by design they will not match. So don't rule "this page isn't working" from either one alone. Read clicks for which keyword brought people in, and sessions for how many actually arrived. Hold both lenses and you can read where you stand even with the exclusions in place.
With that in place, you should not judge by traffic counts alone but ultimately judge by revenue. Impressions and clicks are only entry-level numbers. If you read through to "how much revenue each session generated" per channel in one line, you can make investment decisions without being thrown off by missing data. The thinking is laid out in What Is RPS? The Metric, Formula, and How to Get It in GA4.
RevenueScope solution
Bottom line: Google Search Console tells you whether a click happened. But "how much revenue that click generated" never comes out of the standard screen, no matter how you read it. That's where RevenueScope begins.
RevenueScope ingests Google Search Console's keyword data (clicks, impressions, position) and, on bot-excluded clean numbers, lines up what comes next — revenue — by keyword. Rooted in real revenue from search, it shows which keywords are worth investing in.
Both lenses live in the same dashboard. The clicks sourced from Google Search Console sit in the search-keyword view, and the sessions and revenue your own site tag recorded for the search channel sit in the traffic view. You neither understate your reach because the clicks look thin, nor overstate it on a bot-inflated total.
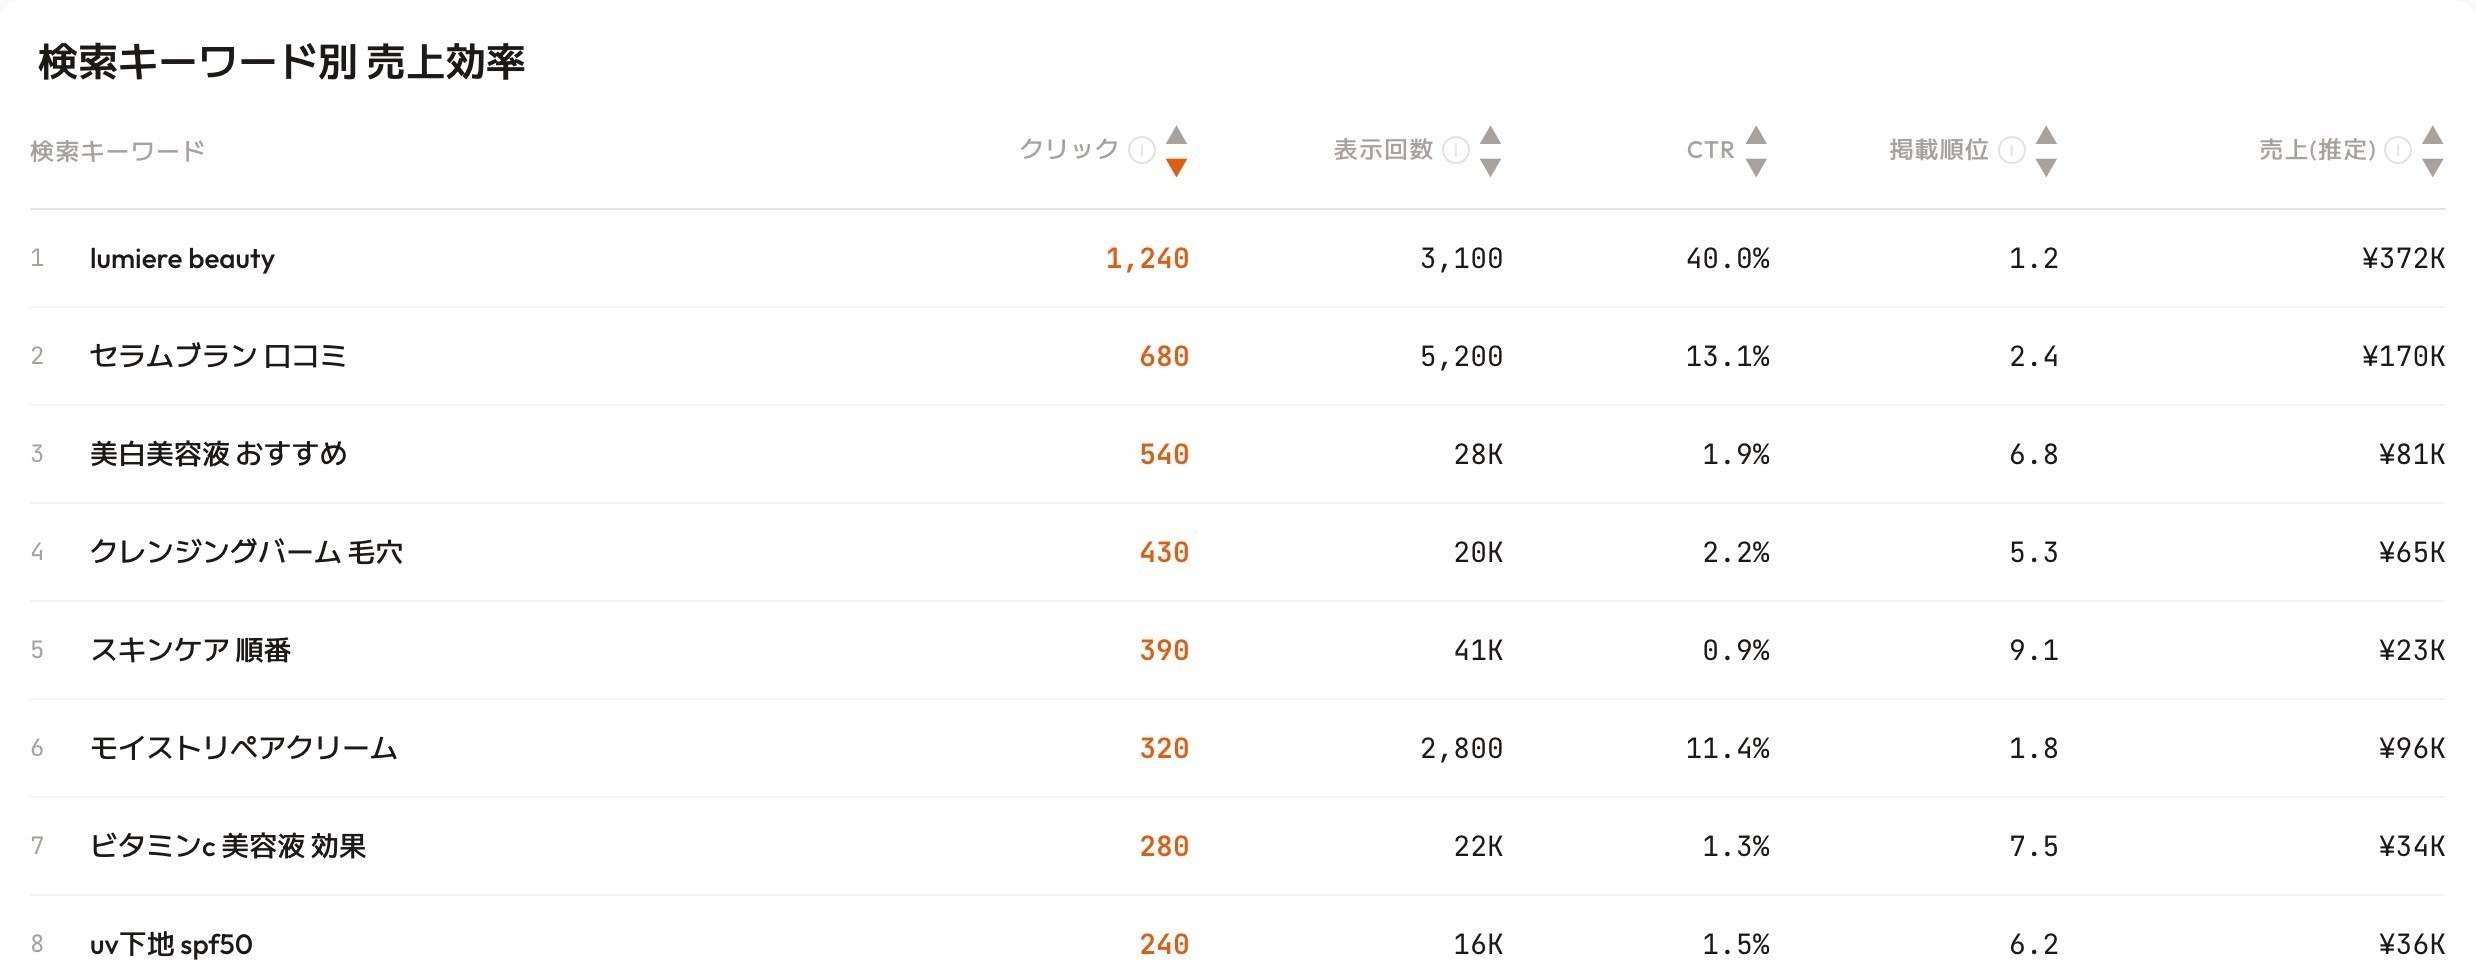
RevenueScope's by-keyword view (demo data shown). It puts the revenue each keyword produced next to its GSC clicks and position.
Take the screen above. "lumiere beauty" has 1,240 clicks, 40% CTR, average position 1.2, and an estimated ¥372K in revenue. Meanwhile "美白美容液 おすすめ" has 28K impressions but only 540 clicks, 1.9% CTR, position 6.8, and ¥81K. You can tell at a glance which keywords get shown a lot but don't sell, and which bring few visits but sell well. Instead of chasing click counts up and down, you decide "which keywords would grow revenue if I lifted their position." You can make that call without chasing down the rows anonymization removed from the table.
FAQ#
Q. Is the click mismatch a setting error or a bug?
No, it is by design. Low-volume queries are anonymized and removed from the table, so summing the query rows will not reach the overall total. There is no setting to fix.
Q. Is there a way to show anonymized queries?
No. It is a privacy safeguard and cannot be turned off on the user side. Focus on high-impression pages and queries, and decide based on the data within the visible range.
Q. Why don't Google Search Console clicks match the sessions my own site measures?
Because they are counted by separate systems. Google Search Console covers only clicks from Google search, and anonymized queries are dropped from the table. Your own site measurement includes Bing and Yahoo! JAPAN and excludes bots. On our own site, real sessions ran about 15 times the per-query click total. Don't try to reconcile them — use them as two lenses.
Q. Per query or per page — which should I look at?
For the overall picture, look mainly by page, because page-level data is less affected by anonymization. Use the per-query view as a supplement to learn "what words people came with," and avoid using it to compare totals.
Summary#
In Google Search Console, summing the per-query clicks never reaches the overall total — not a bug, but a spec. The cause is "anonymized queries," which hide low-volume queries for privacy. They are removed from the table, but their clicks are included in the overall total. The real loss is cutting growing pages because "0 clicks means no results" without knowing the gap. Read mainly by high-impression pages and understand 0 clicks as a spec. One more thing: don't measure your site's reach on Google Search Console clicks alone. On our own site, real sessions from Google search ran about 15 times the per-query click total, mostly because of anonymization; the engines covered and bot exclusion add further differences when you compare the two lenses. But all that tells you is "which pages and keywords got clicks." How much each keyword actually sold is recorded in neither Google Search Console nor GA4. Past the 0-click trap waits a second one: pouring improvement cost into keywords that get clicks but don't sell.
See which ads actually drive revenue, at a glance
Free up to 5,000 sessions/month, AI analyst included. No credit card required. Up and running in 5 minutes.
References#
- [1] Google Search Central Blog "A deep dive into Search Console performance data filtering and limits" (2022)
- [2] Google Search Console Help "About Search Console data" (2026)
- [3] Google Search Console Help "Performance report (Search results): Overview and basic setup" (2026)
- [4] Google Search Central "Using Search Console and Google Analytics Data for SEO" (2026)