Are email lists still worth it for ecommerce? Experienced operators tend to land on the same answer: email should drive a minimum of 20% of your revenue, and more than that if you sell products people buy repeatedly. It's not unusual for a store to find that abandoned-cart recovery and repeat-purchase campaigns alone account for roughly a fifth of revenue through email. So here's the question — your store's "email revenue": which number are you counting? The email platform's dashboard, GA4, and your cart's actual orders will show you three different figures for the same month. This article explains why they disagree, how to assign each ruler its proper job, and — once the count is aligned — how to decide which channel deserves the next budget.
Table of contents
TL;DR#
-
The email tool's attributed revenue and GA4's Email channel revenue count different things — they will never match
Neither is lying. They answer different questions
-
By default, email tools credit any purchase within 5 days of an open or click
Someone who merely opened your email, then bought via search three days later, counts as email revenue
-
Compare campaigns inside the email tool, compare channels in GA4, confirm money with cart orders
-
Aligning the count is only the prerequisite. Comparing against the "email = 20%" benchmark, or deciding where the next budget goes, both require lining up per-channel revenue efficiency — UTM-normalized, bot-excluded — on one screen (covered in §5)
1. The same email revenue differs by screen#
Bottom line: the three screens define "email revenue" differently, so disagreement is normal.
Picture a store doing 5M yen a month. The email platform (Klaviyo, Mailchimp, etc.) reports "email attributed revenue: 450K yen." GA4's Email channel shows 180K. A 2.5x gap. Is something broken?
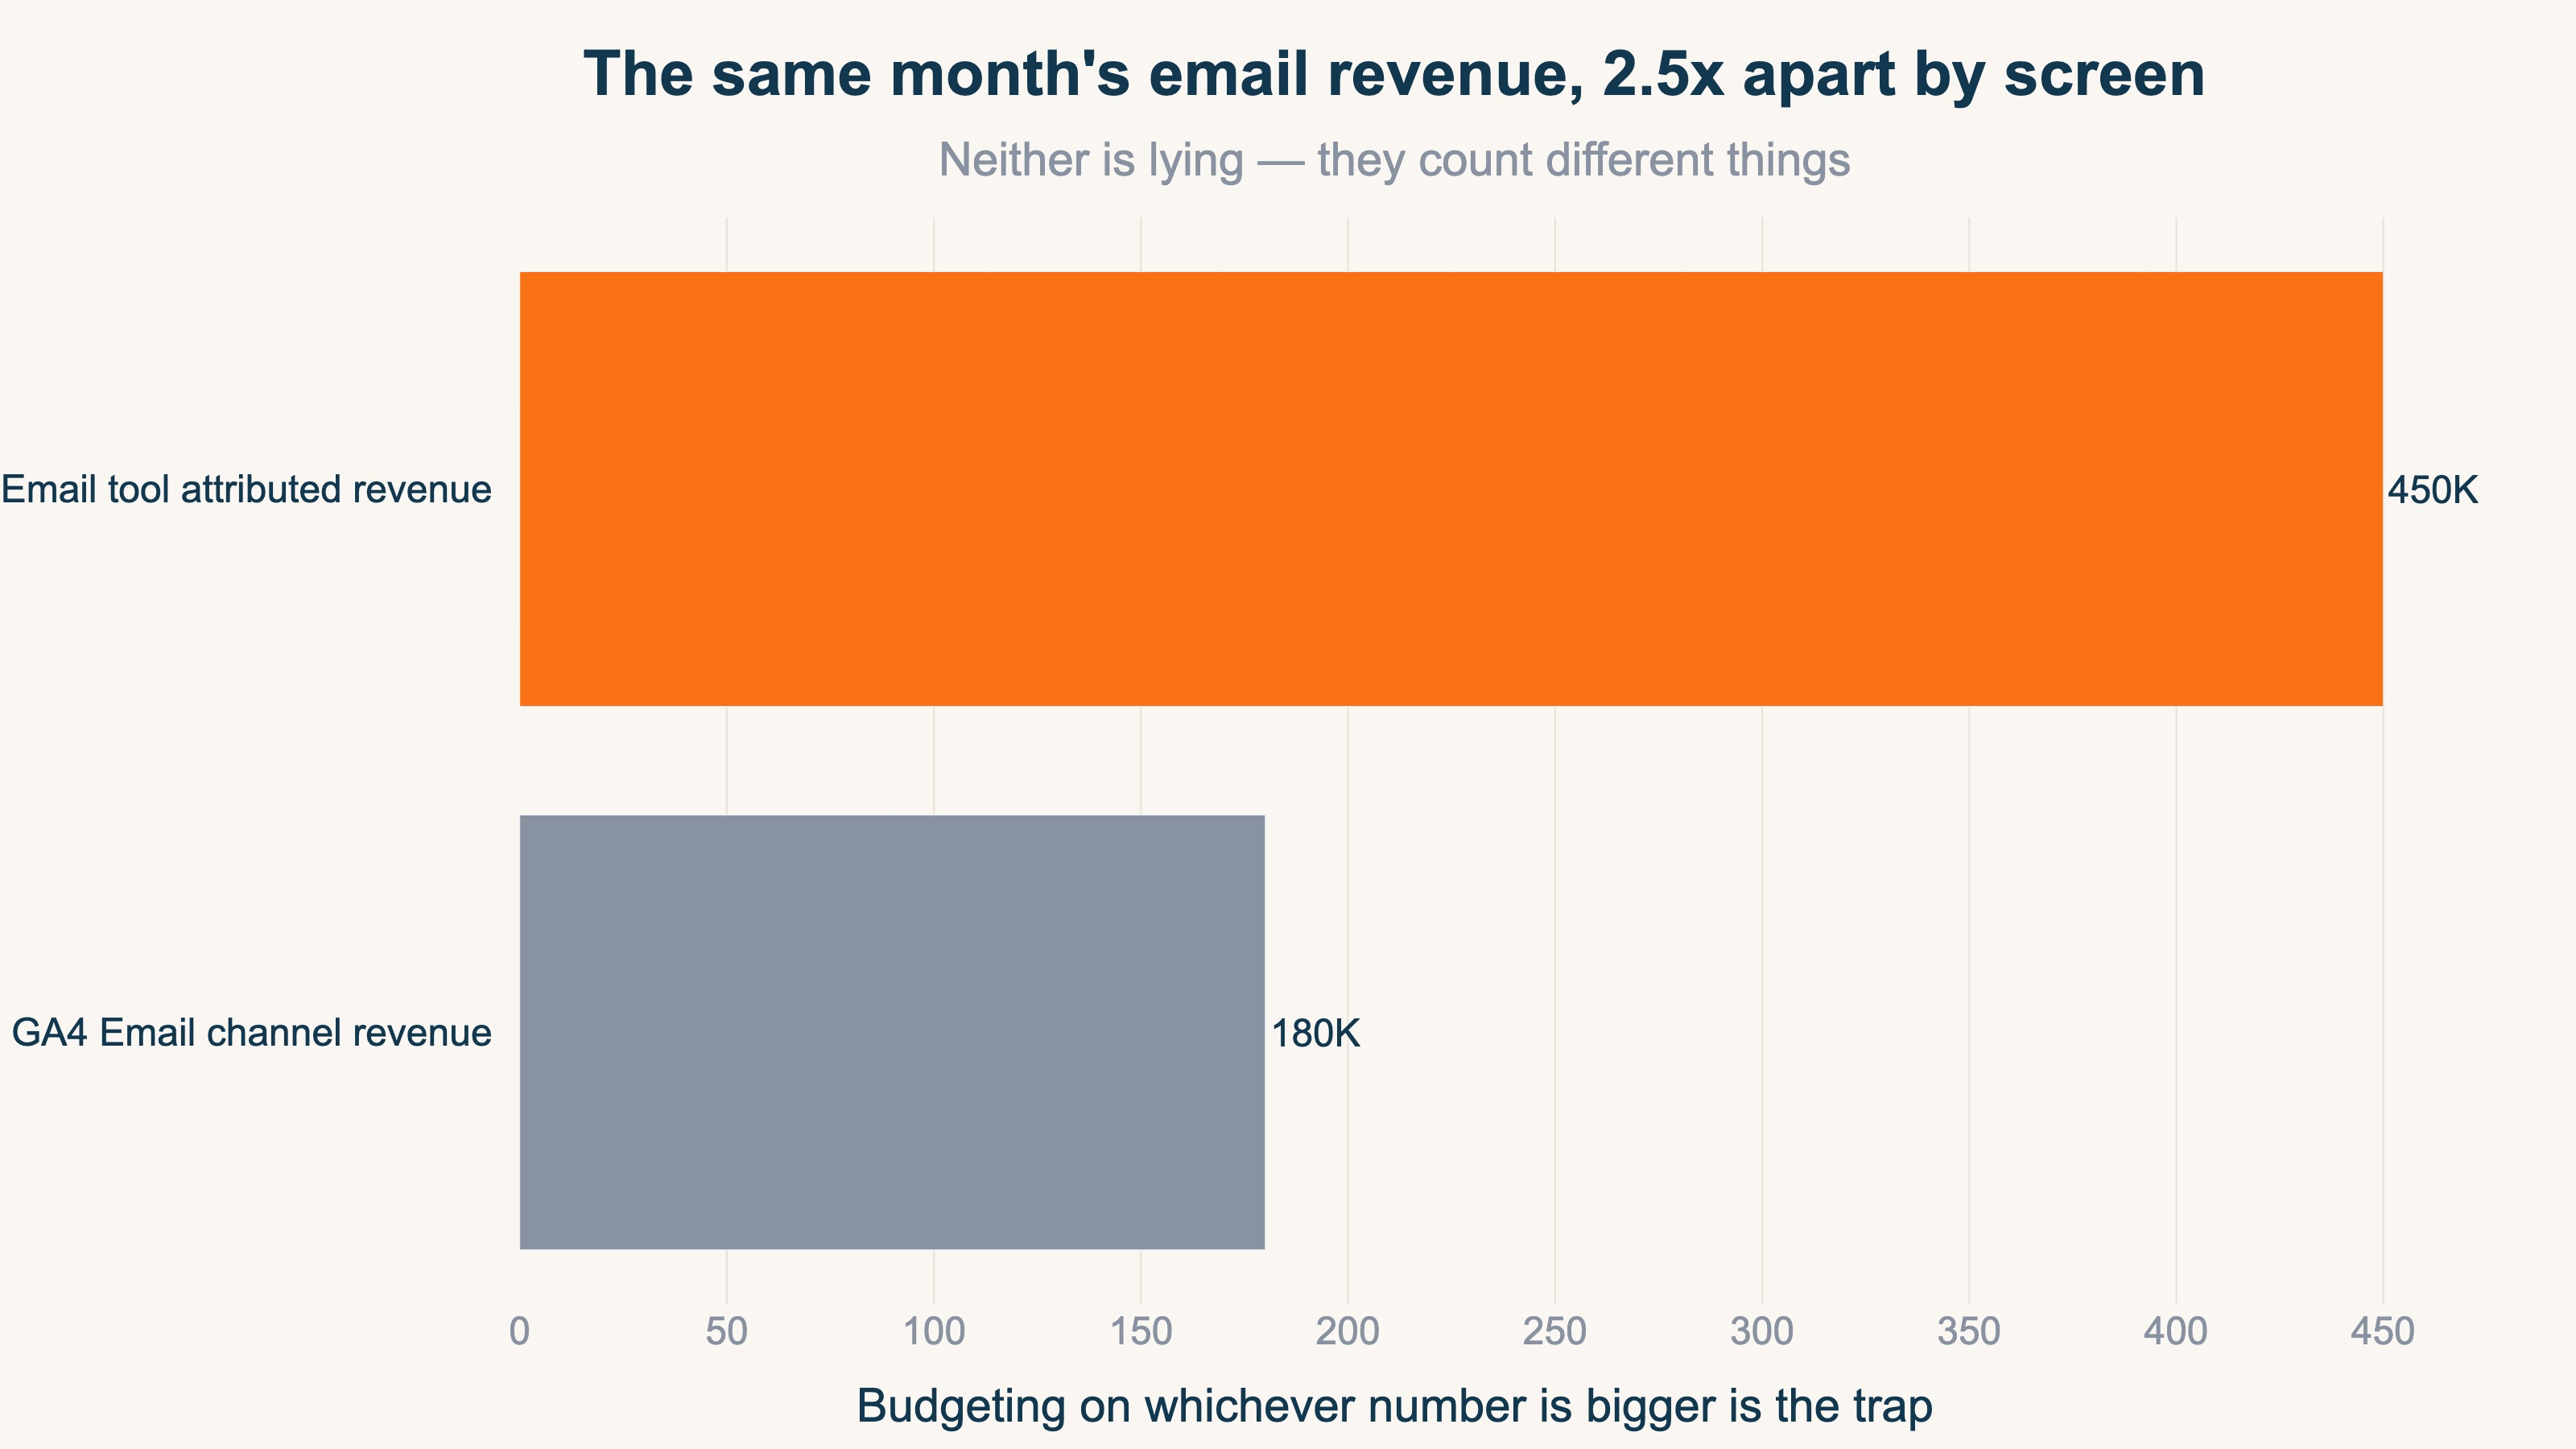
Nothing is broken. They count different things.
- The tool's attributed revenue: purchases made within a set window after someone opened or clicked an email, credited to email
- GA4's Email channel revenue: purchase revenue from sessions that arrived by clicking an email link [3], with credit generally going to the last channel touched
- Cart orders: the actual money, verifiable through coupon codes and order data
"Attributed revenue," "click-session revenue," and "actual money" answer three different questions, so the gaps are by design. The danger is budgeting on whichever number is biggest without knowing the difference. Email platforms are often praised for paying for themselves many times over — but if the proof of "paying for itself" is the tool's own attributed-revenue display, that's close to a student grading their own exam.
2. Why the email tool's "attributed revenue" runs big#
Bottom line: by default, any purchase within 5 days of an open or click is credited entirely to email.
According to Klaviyo's official help docs, the default attribution window is 5 days for both email clicks and email opens [1]. Which means purchases like this count as email revenue:
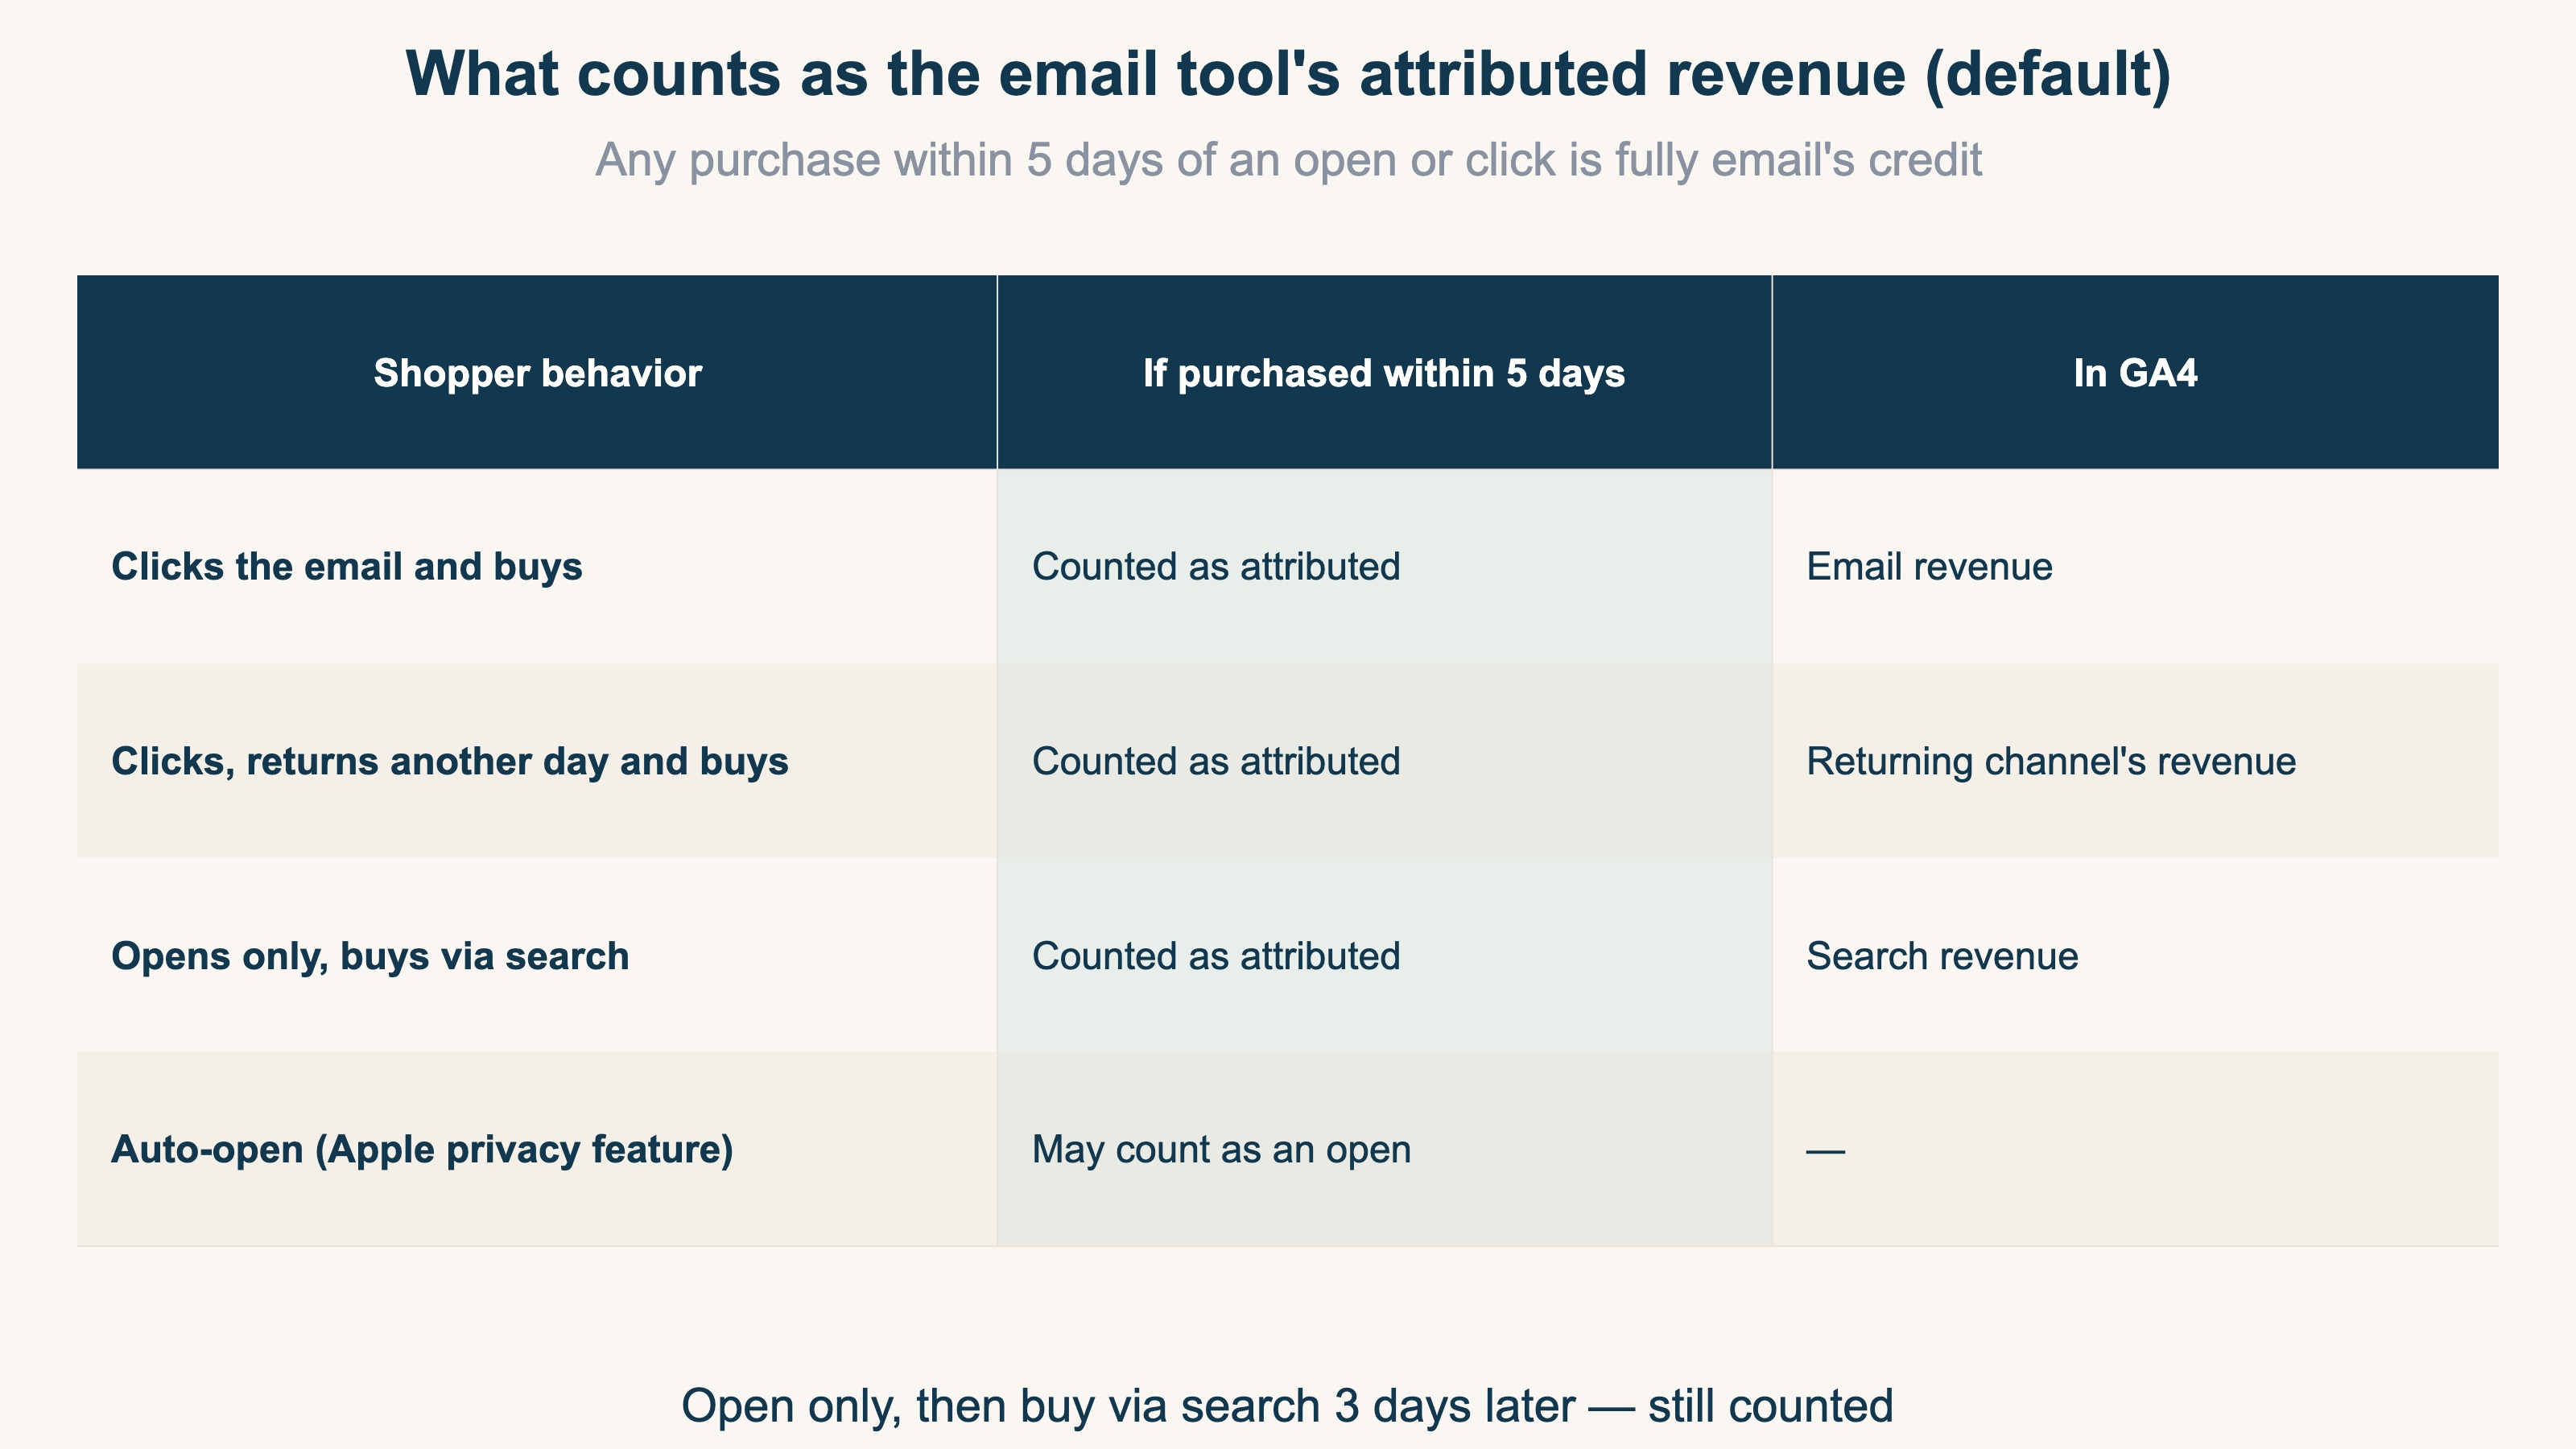
Say a customer merely opens your newsletter on Tuesday (no click), then arrives via Google search on Friday and spends 10,000 yen. That's within 5 days of the open, so the email tool counts the full 10,000 yen as email revenue. GA4, meanwhile, credits Organic Search — the last channel touched. The same 10,000 yen lands in different channels on different screens. That's the entire source of the gap.
On top of that, Apple's Mail Privacy Protection can auto-mark emails as opened for privacy reasons, so people who never read your email may still count as openers [1] — inflating open-based attribution further.
To be clear, none of this is foul play by the email tools. The windows are documented in official help pages and adjustable in settings [2]. It's a design philosophy that generously captures email's role as a purchase trigger. Just remember one thing: use that number to compare channels and email gets a built-in head start.
3. How to measure properly: three rulers, three jobs#
Bottom line: don't hunt for one true number — assign a ruler per question.
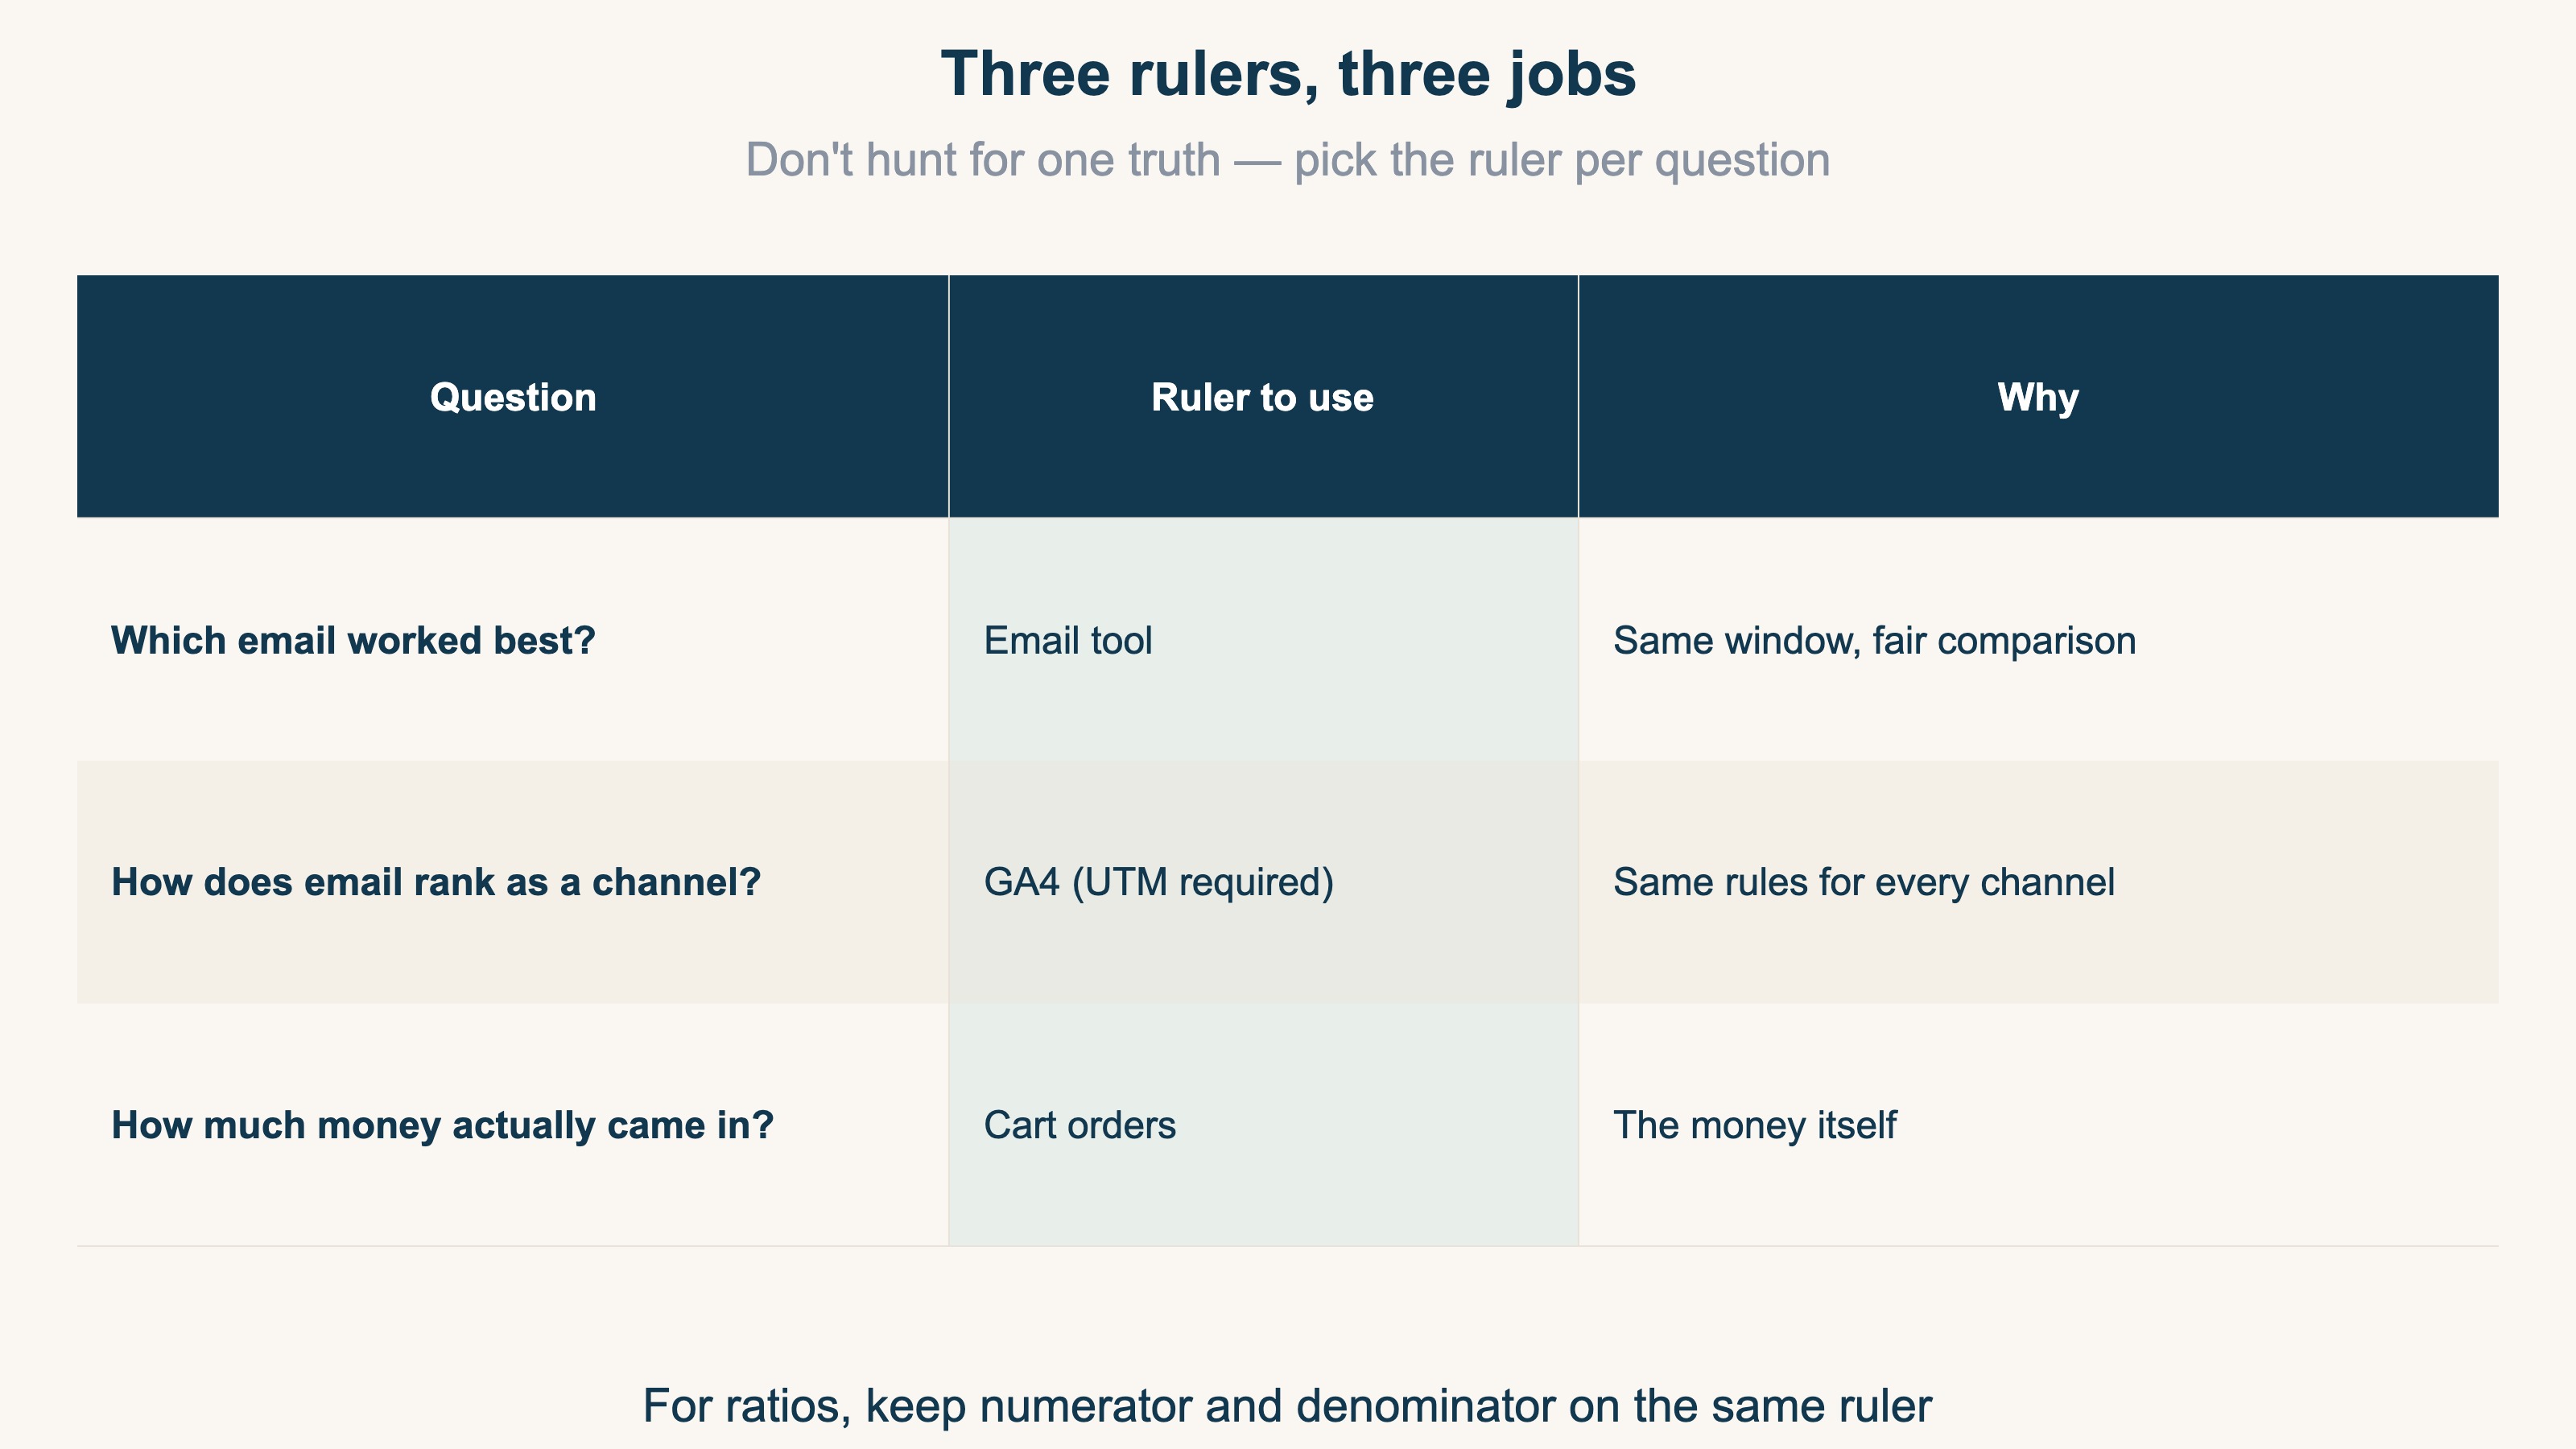
Question 1 — "Which email worked best?" → compare inside the tool. Abandoned-cart flow vs new-arrival campaign: same window against same window, the quirks cancel out, and attributed revenue serves fine for comparing campaigns.
Question 2 — "How does email rank as a channel?" → compare in GA4. Ranking email against search, social, and ads requires one rulebook for all channels — that's GA4's side. Proper UTMs on your email links are the prerequisite. How GA4 classifies email is covered in Which GA4 Channel Do Email and SMS Land In?, and the last-click bias to watch for in Moving Budget on Last-Click Alone Costs You.
Question 3 — "How much money actually came in?" → confirm with cart orders. Email-exclusive coupon usage and order data are the final check on real money. GA4 and your cart won't match perfectly either — see Why GA4 Revenue Doesn't Match Shopify.
This division of labor matches where the long-running attribution debate lands: every model has its drawbacks and there's no perfect answer, so the realistic stance is to use attribution directionally, with a grain of salt, once you understand each ruler's quirks.
4. Compare against the "20% of revenue" benchmark#
Bottom line: fix your ruler — GA4 or cart orders — before computing the ratio against 20%.
When comparing your store against the "email should drive 20% of revenue" benchmark, using the tool's attributed revenue as the numerator inflates your ratio by the width of the attribution window. Keep numerator and denominator on the same ruler — GA4 against GA4, orders against orders.
- Well below 20% → upside in list building, abandoned-cart flows, and repeat campaigns. There are cases where a 1,400-subscriber list, built by hand over four years, outperformed everything else — ads, Instagram, SEO. A list is an asset you own, not rented from an algorithm
- Around or above 20% → email is a core channel; shift focus to campaign-level improvement (Question 1)
One caution: new stores that declare "zero email sales in month one = failure" are judging too soon. With a small list, the data says nothing yet. Treat the first month or two as a data-gathering period — who clicks, who responds.
5. Even with the count aligned, GA4 has no per-channel revenue-efficiency comparison#
Bottom line: even after you fix on one ruler, GA4's standard reports never produce "RPS, AOV, and purchase rate by channel — UTM-normalized and bot-excluded — on a single screen." Comparing revenue efficiency across channels takes separate work.
Aligning the count, as in chapters 3 and 4, gets you as far as "what % of revenue is email." But what you really want next is "how much does email sell per visit compared to search or ads," and "which channel should get the next budget." GA4's standard reports can't answer that alone.
GA4 gives you sessions and conversions per source/medium, but lining up per-session revenue across channels — after normalizing UTM variants and excluding bot traffic — requires hand-building an exploration report. None of these questions come out of the standard reports, even with a perfectly aligned count:
- Which has higher per-session revenue: email or Organic Search?
- How many times higher is email's purchase rate than paid ads?
- Where to add budget now — email list growth, or another channel?
These are the questions you most want answered when deciding which channel gets the next budget. The state where you can line up bot-excluded per-session revenue across channels — on one aligned count — has to be built outside the standard reports.
RevenueScope solution — comparing real revenue by channel on one screen
Bottom line: RevenueScope aggregates every channel by the same rules and, on bot-excluded real revenue, lines up RPS (revenue per session), AOV, and purchase rate for email, search, social, and ads on a single screen.
Instead of hand-building the chapter-3 Question 2 (channel comparison) in GA4 each time while second-guessing UTM classification, RevenueScope gives you that state from the start. It's a channel-comparison count unaffected by any email tool's attribution window, by UTM spelling variants, or by bot traffic.
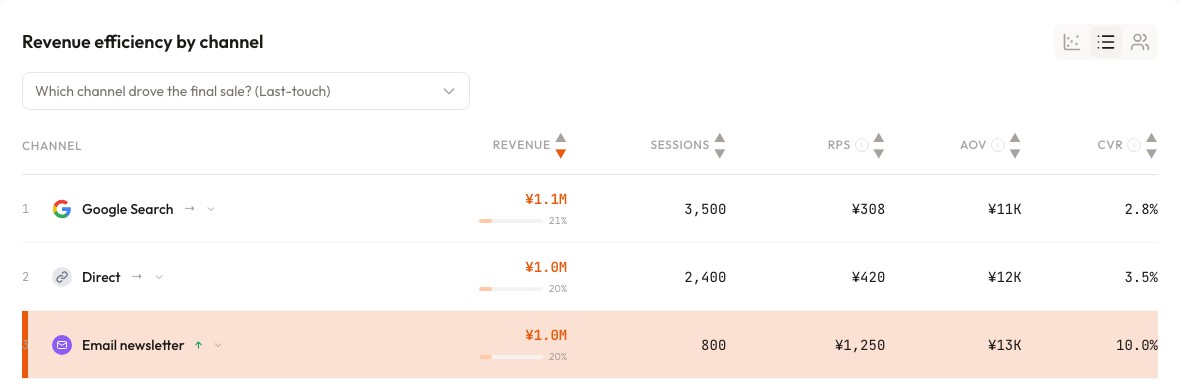
In the screen above (demo data — a different store from chapter 1's example), Email brings only 800 sessions yet 1.0M yen in revenue at an RPS of 1,250 yen. The store does roughly 5M yen a month, so email's revenue share is about 20% — right at the benchmark. It also has the highest RPS of any channel: the visits most likely to turn into purchases. So the next move — invest in list-growth entry points (signup forms, incentives) to widen this high-efficiency channel's base — is a call you can make on revenue.
FAQ#
Q1. Should I shorten my email tool's attribution window?
If you want the tool's numbers closer to channel reality, narrowing to click-only and 1-3 days helps [2]. But with the chapter-3 division of labor — channels compared in GA4 — the default window is fine for its actual job: comparing campaigns.
Q2. My newsletter doesn't show up under "Email" in GA4.
Without UTMs on your email links, those visits hide inside Direct. Setting utm_medium=email is the most reliable way to get classified [3]. See How to Use UTM Parameters Correctly.
Q3. What should "email revenue" include — abandoned-cart and back-in-stock flows too?
Depends on the question. To judge the whole email program, include automated flows; to judge your newsletter's editorial pull, count one-off campaigns only. What matters is counting the same scope every time and watching the trend.
Summary#
- The tool's attributed revenue, GA4's Email revenue, and cart orders are three differently-counted numbers. Disagreement is normal
- The default rule credits email with any purchase within 5 days of an open or click — a built-in head start in any channel comparison
- Campaigns: compare in the tool. Channels: compare in GA4. Money: confirm with orders
- Aligning the count is the prerequisite; only after lining up bot-excluded per-channel RPS can you decide, on revenue, which channel gets the next budget
See which ads actually drive revenue, at a glance
Free up to 5,000 sessions/month, AI analyst included. No credit card required. Up and running in 5 minutes.