
Build a store on EC-CUBE and you assemble the server and the design with your own hands. That high freedom has a flip side: GA4 (Google Analytics), the access-analytics layer, is also something you wire up yourself. Unlike Shopify or BASE, where "install an app and measurement begins," you have to lay in the tags and the record of purchases on your own.
This article walks through the three places most people get stuck when adding GA4 ecommerce tracking to EC-CUBE — why each one trips you up, and which direction to fix it. On top of that, it sketches the exit: setup is the foundation, not the goal, and what you really want to know is "which channel sold efficiently." If you'd like to see how easy each cart is to measure side by side, Comparing measurement methods across ecommerce carts is a good companion read.
Table of contents
Key takeaways#
- EC-CUBE is self-hosted, so its high freedom means you build GA4 ecommerce tracking yourself. The tag, the record of purchases, and the product data are the three common places to get stuck
- A stumble is fixable once you know "where it jams." For exact click-by-click steps, going straight to the EC-CUBE or GA4 official docs is the shortcut
- Setup is the foundation, not the goal. GA4 is a checkup that shows "what happened"; the next question — "where to invest" — is seen through revenue per visit (RPS) by channel
- What matters isn't visit count but whether you can decide your next move by revenue efficiency. Setup is the starting line for exactly that
1. Why EC-CUBE's GA4 setup differs from other carts#
Bottom line: because EC-CUBE is self-hosted and you can build anything yourself, you also prepare GA4 measurement yourself. That's why the "tag," the "record of purchases," and the "product data" are the three easy places to get stuck.
EC-CUBE is the type of online store you install and run on your own server. You can freely touch the templates (Twig) and the plugins, so you can build the look and the features exactly as you want. The flip side of that freedom is that GA4 measurement isn't "automatic once you install an app." Where the tag goes, and how purchases get recorded, are decisions you make and wire in yourself.
ASP-type carts (the rental kind) like Shopify, BASE, and STORES come with a measurement entry point ready-made. That makes them easy, but fine-grained tuning is harder. EC-CUBE is the opposite: more effort, but higher freedom. The ease of measurement on each platform is also touched on in How to read channel-by-channel revenue in BASE.
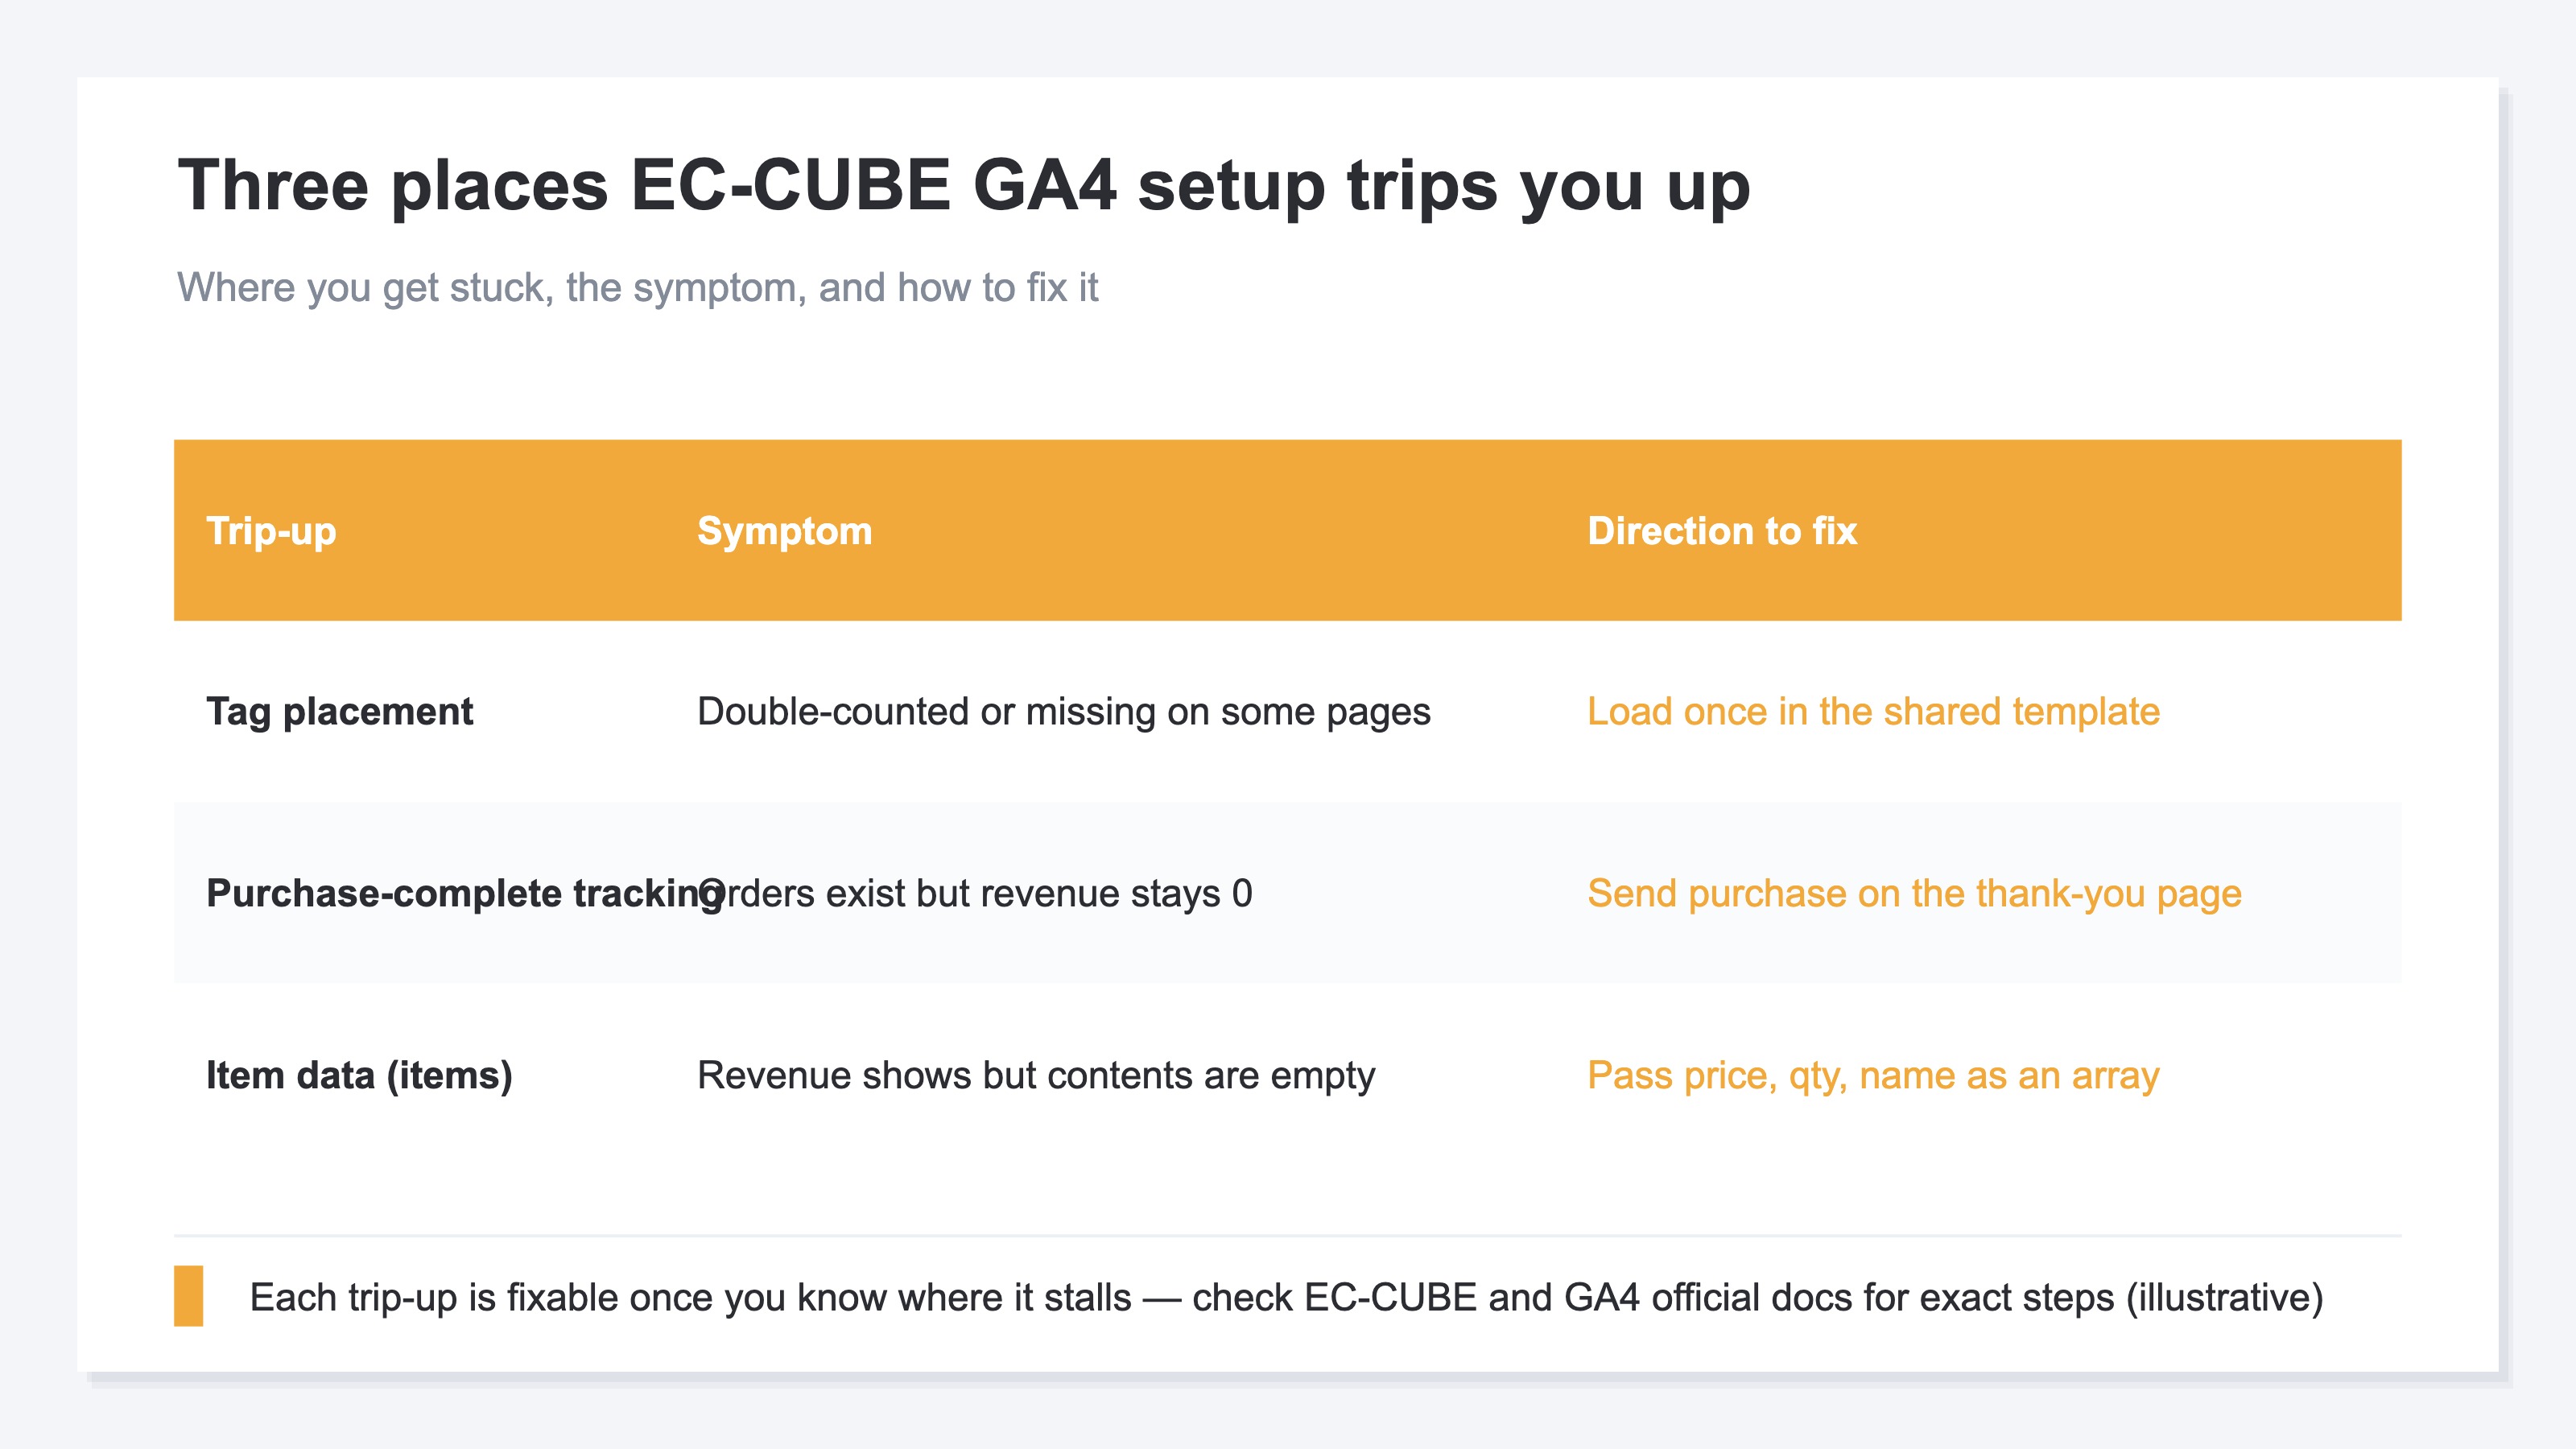
The table below lays out the three places most people get stuck when adding GA4 ecommerce tracking to EC-CUBE, with the symptom each one shows and the direction to fix it. For all three, once you understand "why it jams there," the direction to fix becomes visible.
2. Stumble 1: where to place the tag#
Bottom line: the GA4 tag is meant to load exactly once on every page. Put it in the wrong place and you double-count, or some pages drop out.
The first stumble is where you write the tag. The basic rule is to place the GA4 tag so it fires exactly once no matter which page of the site you open. EC-CUBE has a common template that forms the base of the page, so the right move is to put it in that one spot. Copy it and paste it across many screens, and you can end up counting the same visit twice.
If you use a tag manager (GTM), the idea is to load information onto a hand-off box called the data layer and pass it from there to the tag[1]. It looks complicated, but all it's doing is "telling the tag, in a fixed format, what happened on this screen."
We won't chase the full copy-paste steps here. What matters is grasping the direction: placement is "once, shared across all pages," and if you see double-counting or drop-outs, suspect the placement. The template structure changes with the version and the installed plugins, so confirm the exact write location against your own environment.
3. Stumble 2: sending the purchase signal on the order-complete screen#
Bottom line: to see revenue in GA4, you send a "purchased" signal (the purchase event) on the order-complete screen. Miss this, and you get orders but revenue stays at zero.
The next stumble is the signal that records a purchase. Even when visit counts are visible, revenue won't appear unless you separately tell GA4 about the event of "a purchase happened." That signal is the purchase event, and its place is the order-complete screen (the thank-you page). Here you tell GA4 about the event of a purchase[2].
What jams easily is whether the thank-you page sends this signal correctly, exactly once. If a customer reloads the complete screen, you can count the same order twice. Conversely, if a payment service sends them to a separate screen, the signal may not fire when they come back, and revenue drops out. When there are orders but revenue is zero, the fix direction is to first suspect whether this signal is arriving.
The idea is shared across carts, so if you want to check the flow of purchase measurement, the GA4 ecommerce setup checklist is usable too. Here again, rather than handing over the full steps, the first job is to grasp "where it jams and how the symptom shows up."
4. Stumble 3: building the product data (items)#
Bottom line: when you send purchase, you also pass "what sold, how many, and at what price" as the product data (items). Leave this empty, and revenue appears but its contents are unknown.
The third stumble is the product-contents data. The purchase signal carries a list of the products bought as an array (an ordered box) called "items." You line up amount, quantity, product name, and so on in this format and pass them[3]. Leave it empty, and the total revenue appears but "what sold" stays unknown.
Because EC-CUBE is freely buildable, you build this items array yourself too. It's the work of pulling the order contents out of the template and rearranging them into the fixed format. What jams easily is when the way you pull out product names or amounts is out of step with your own customizations. When the display shows but the numbers look off, the fix direction is to suspect the contents of items. For the exact way to write it and how to use plugins, rather than guessing your own way[4], going straight to the official EC-CUBE documentation is the sure path.
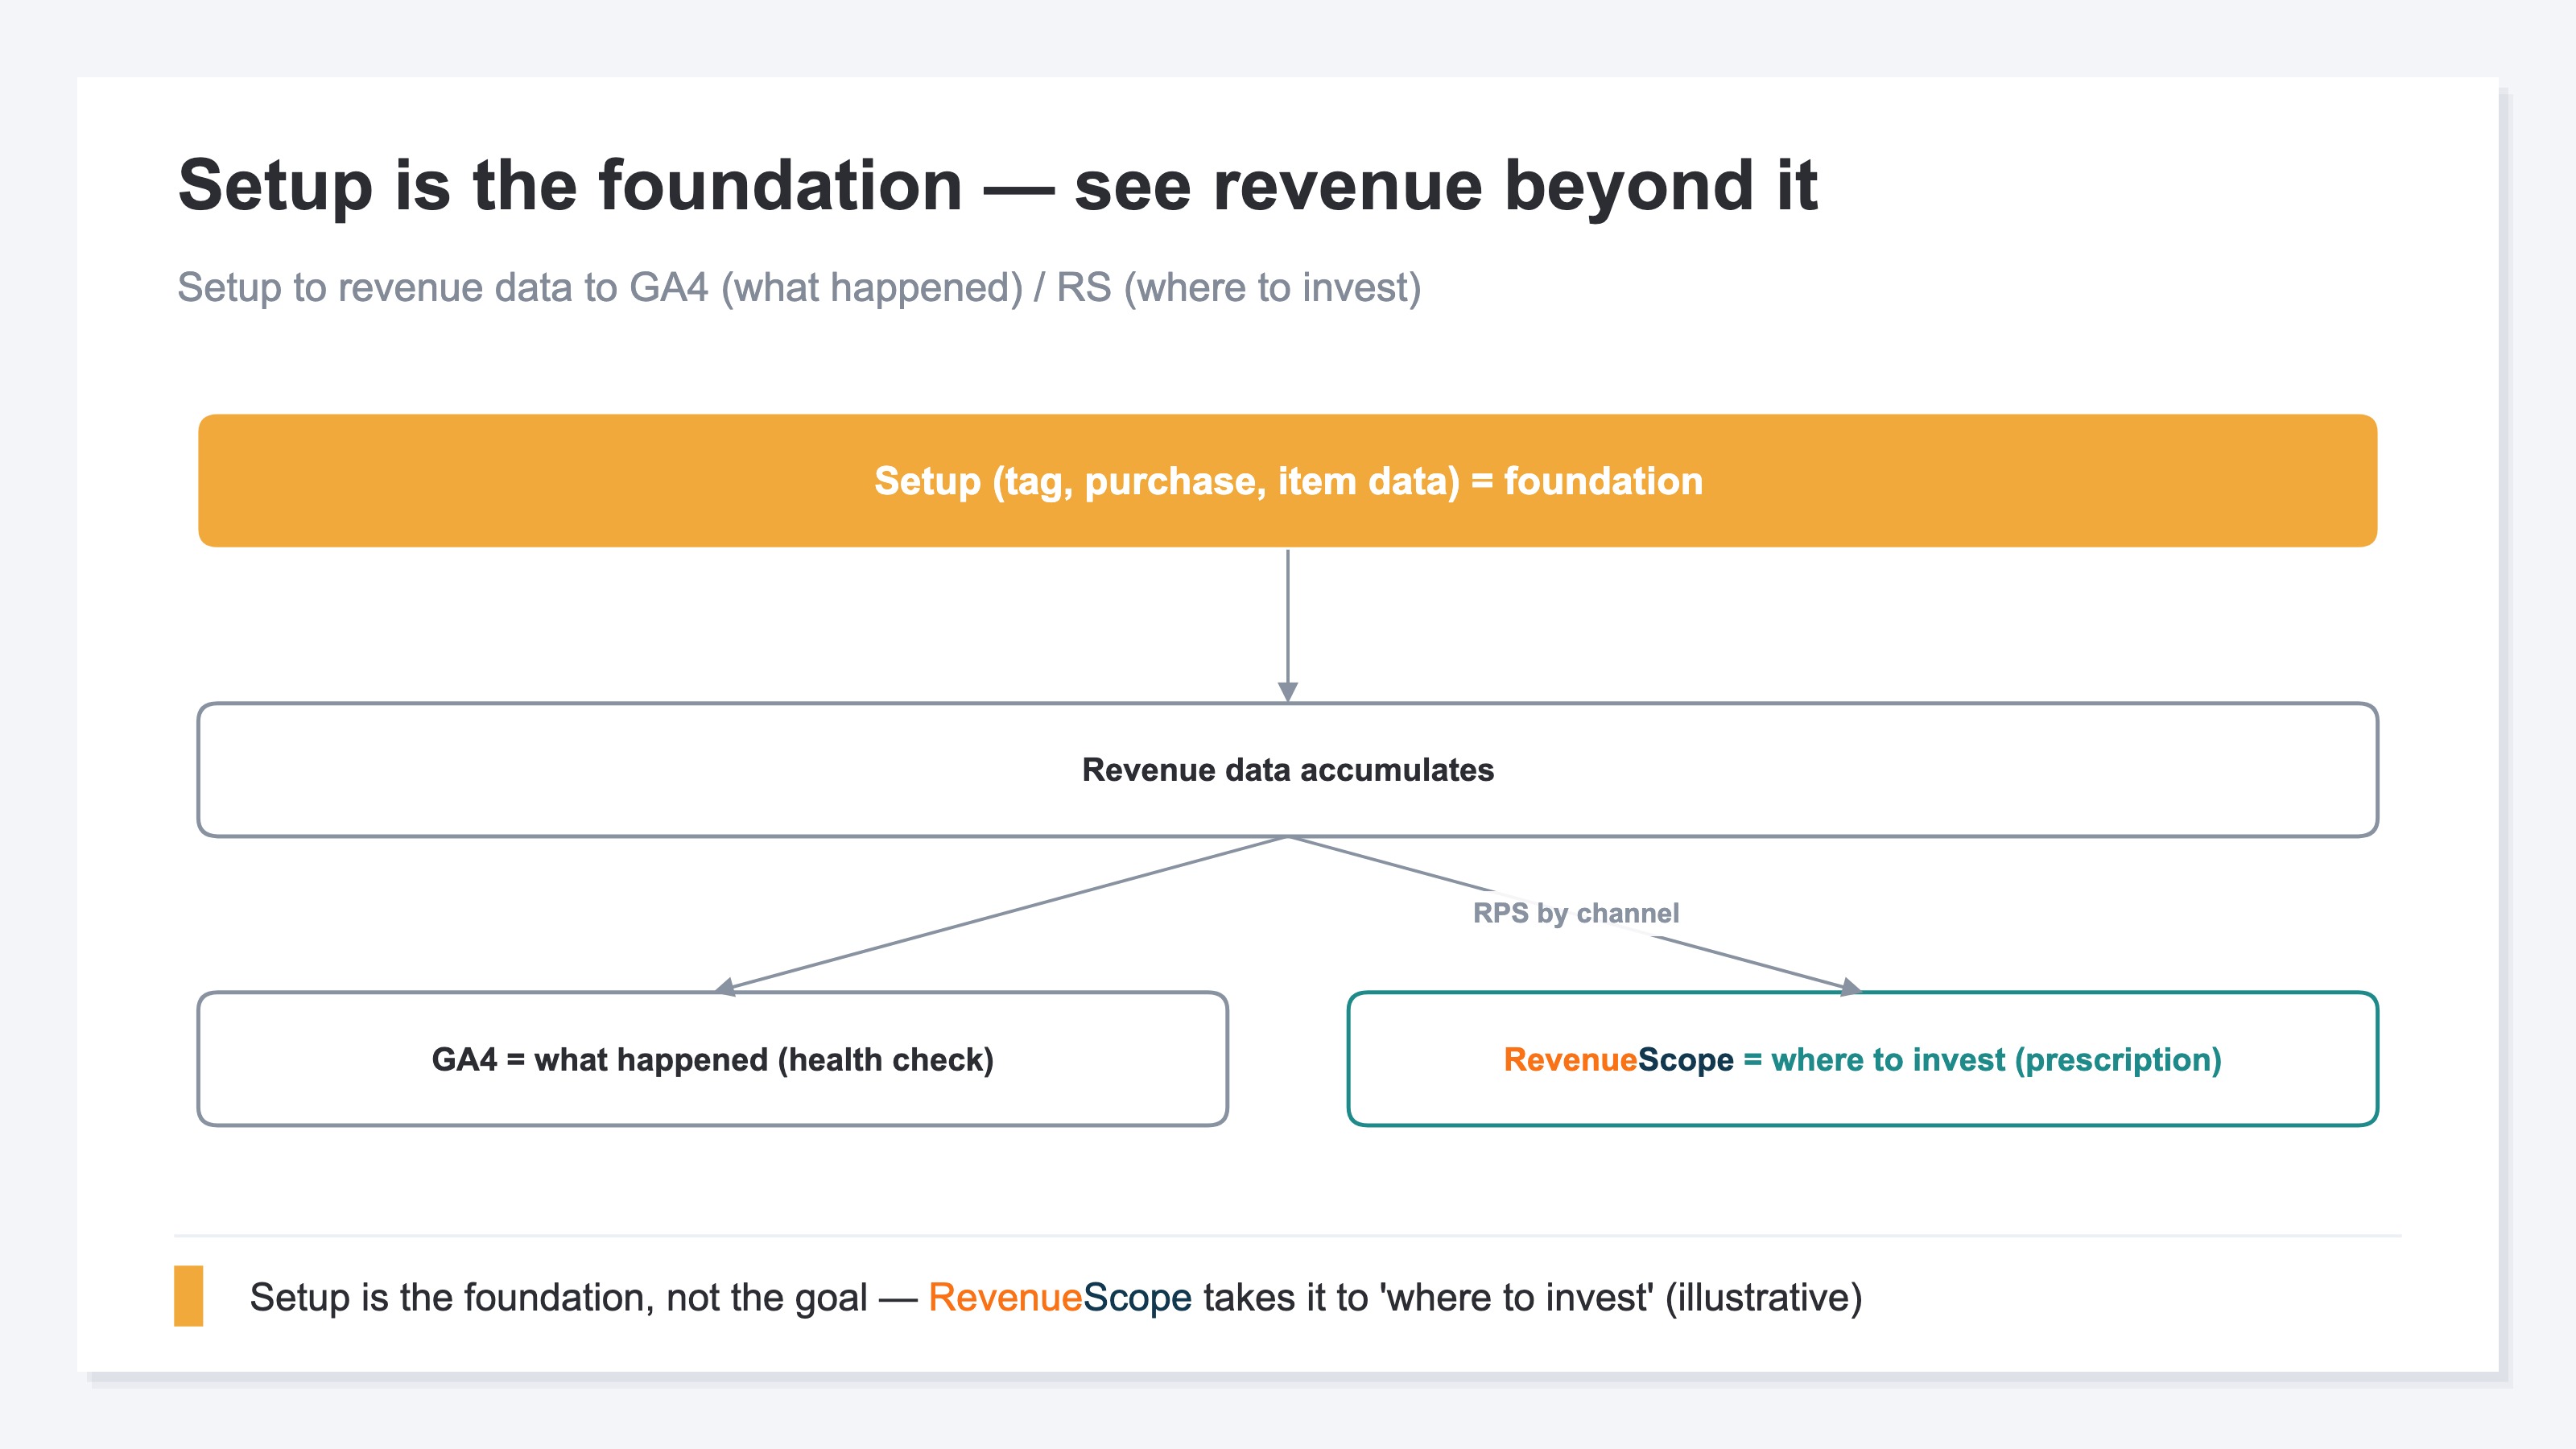
What becomes clear by this point is that setup is the foundation, not the goal. Only when the tag, the record of purchases, and the product data are all in place do you stand at the entrance where "revenue data accumulates." As the figure below shows, GA4 reflects the accumulated data as "what happened (a checkup)," and the next step — "where to invest (the prescription)" — shows up on yet another stage.
RevenueScope solution
Even after you work hard on the setup and revenue starts flowing into GA4, walls remain. One: per-channel "revenue efficiency" doesn't become the protagonist of standard reports. You can see totals for traffic and revenue, but there's no standard screen that lines up "how much sold per visit" across channels. The other: the source of revenue splits across Direct and (not set), and bots (automated, program-driven access) dirty the numbers.
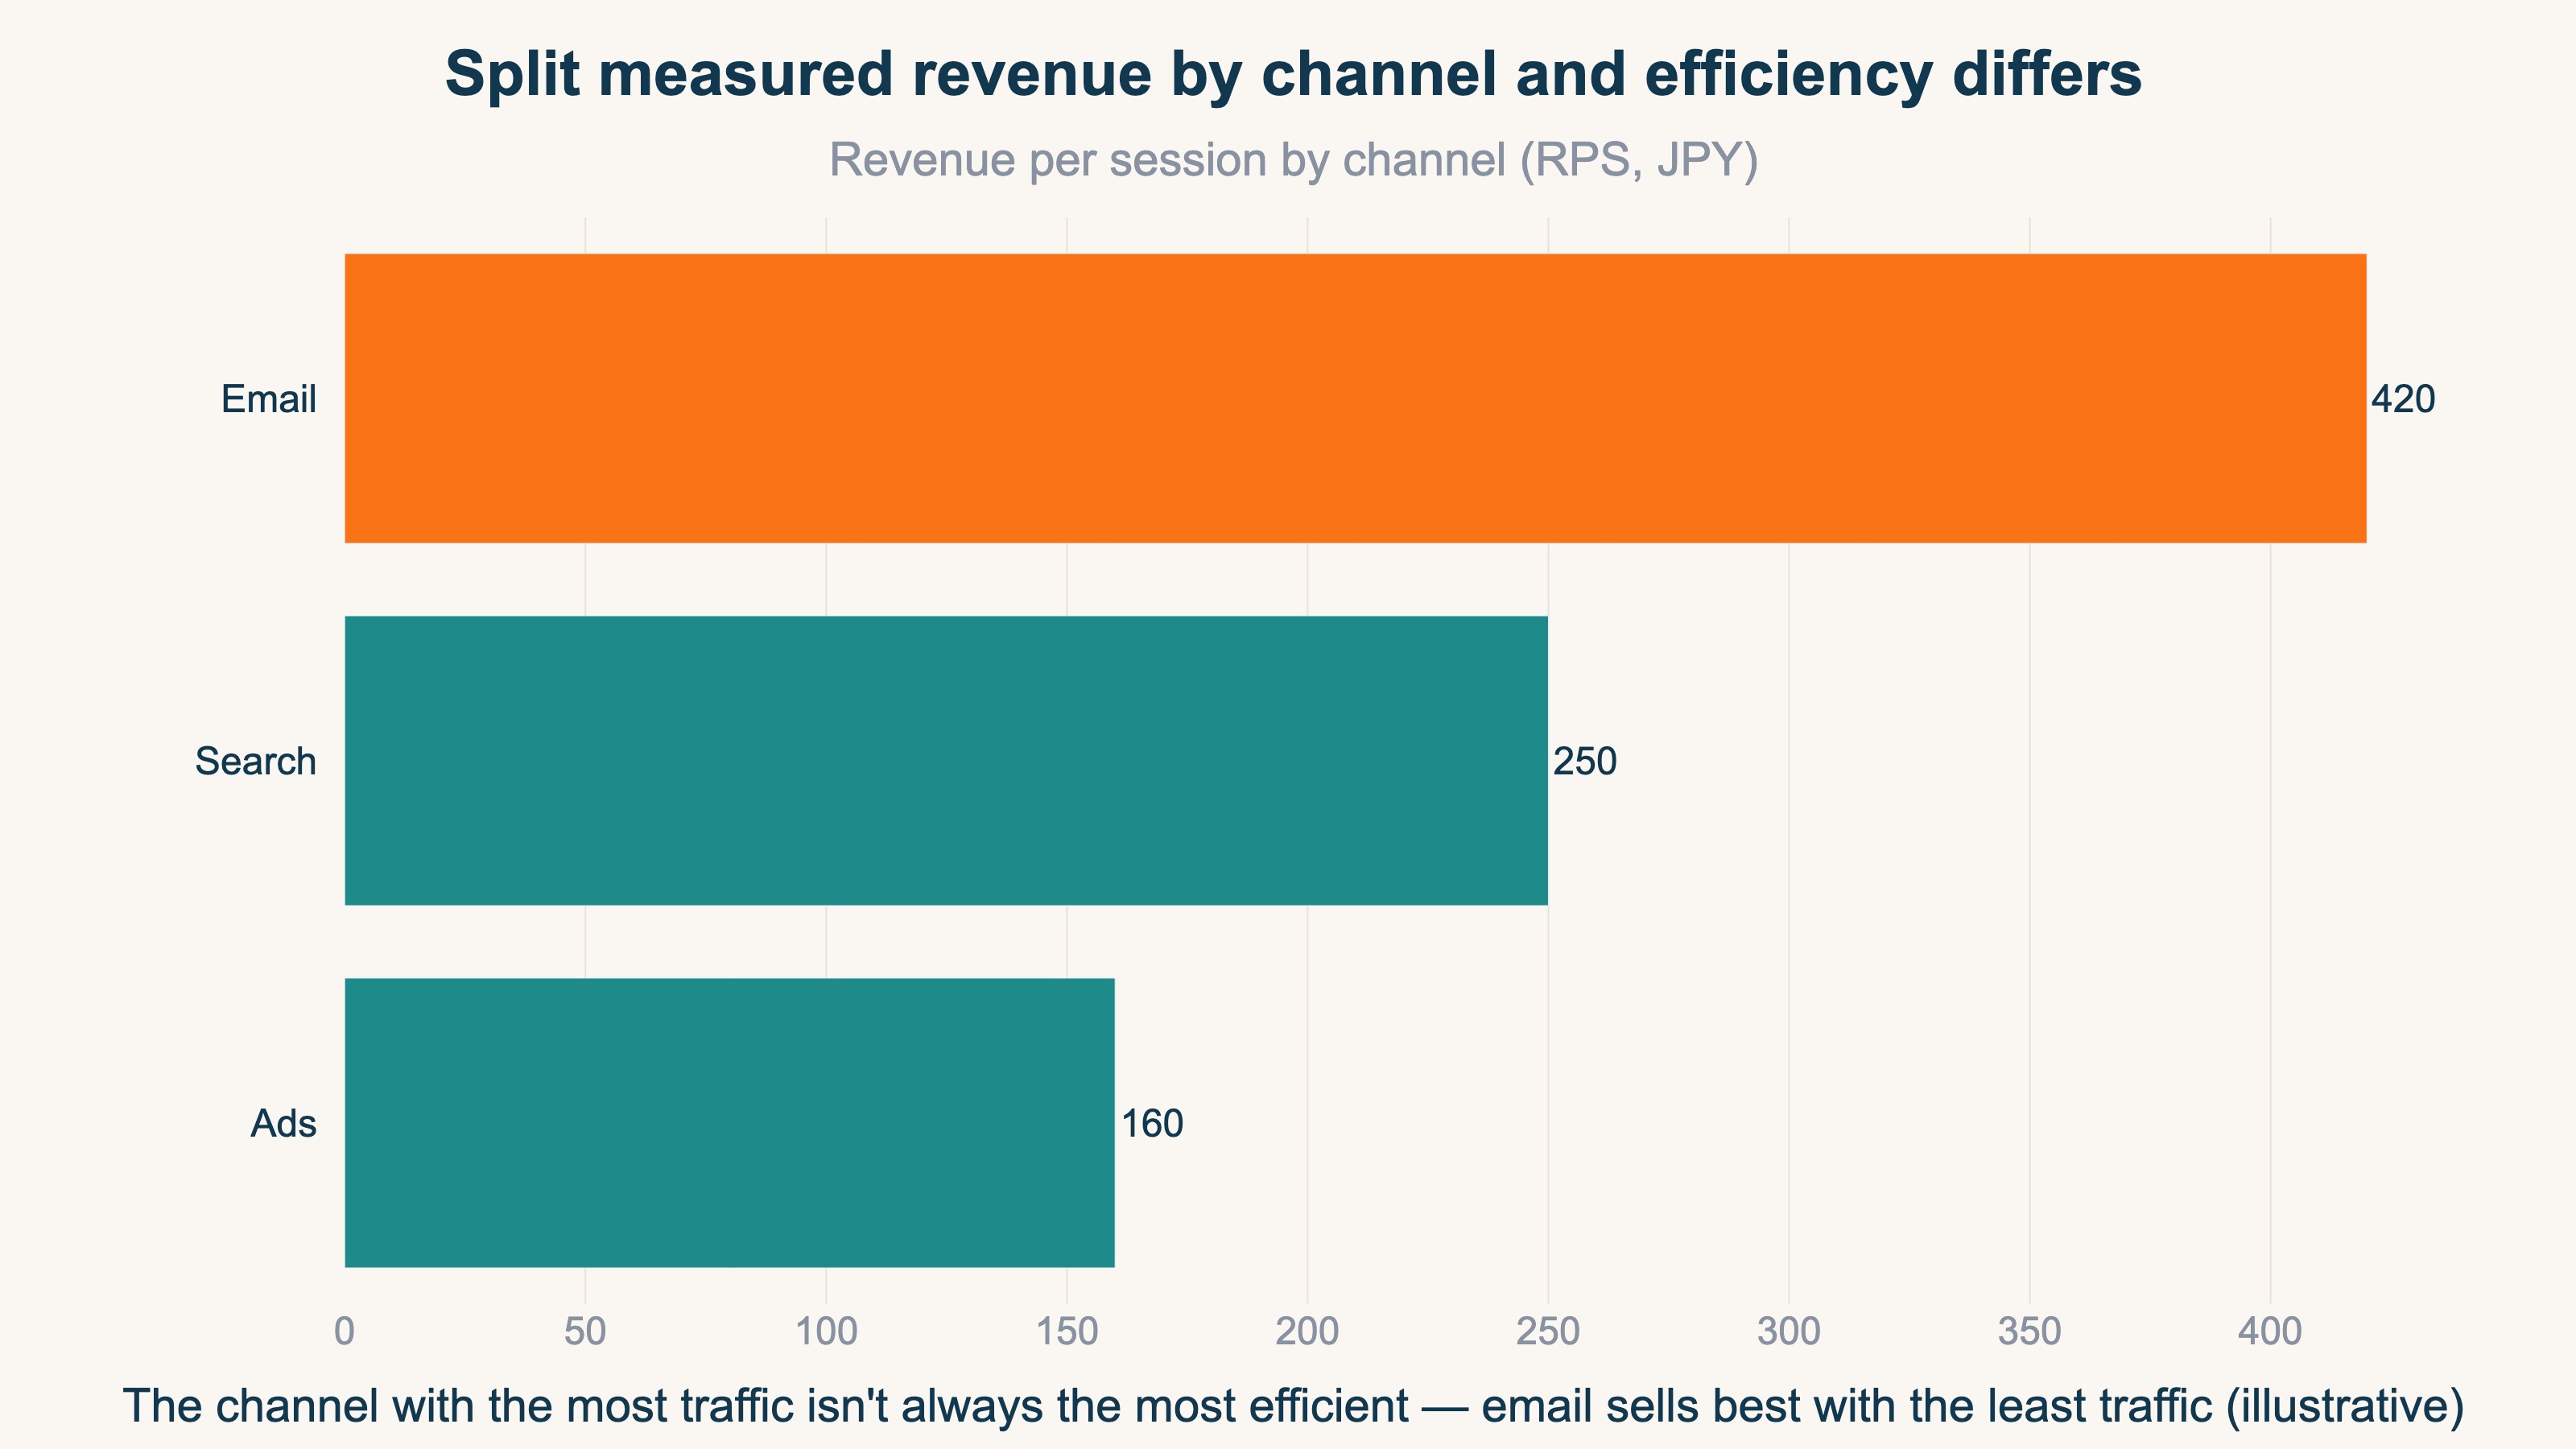
RevenueScope splits the revenue you measured in GA4 (and similar) by channel, so you can compare it as "how much one visit sold (RPS)" (the display is demo data). With bots removed, you can line up visit count, RPS, and revenue on a single screen. You can confirm, on the same screen, how much the people from each source sold.
| Channel | Visits | Revenue per visit (RPS) | Revenue |
|---|---|---|---|
| Email newsletter | 5,000 | ¥420 | ¥2,100,000 |
| Search | 24,000 | ¥250 | ¥6,000,000 |
| Ads | 18,000 | ¥160 | ¥2,880,000 |
| Unknown source | — | — | ¥1,300,000 |
There are two things to read in this table. One is that the most visits come from search, yet by revenue per visit the newsletter sells most efficiently. Rank by the number of visits and you overlook the efficient channel. The RPS idea is laid out in detail in The basics of RPS (revenue per visit). The other is that it shows the "unknown source" row without fudging it. Because revenue whose origin can't be identified is kept rather than erased, you can see the reality that the source is split. On top of that, you can switch from the view that credits only the last-clicked channel to one that also allocates to the first spark or the steps along the way, and compare the same revenue from a different angle. This way of building a single screen is also a useful reference in How to design a dashboard that shows revenue.
Let me make one thing clear. RevenueScope is not a replacement for GA4. It rides along on the tag and the record of purchases (dataLayer) you wired through EC-CUBE to receive data, so the same foundation is still required. It doesn't fix the setup for you, and installing it doesn't make measurement start on its own. What it outputs goes up to per-channel visit count, revenue per visit, revenue, and purchase rate — it doesn't calculate gross margin, profit after returns, or inventory. The one who decides which channel to finally act on is you.
FAQ#
Q. Does EC-CUBE support GA4 ecommerce tracking?
A. It works if you wire it in yourself. Because EC-CUBE is self-hosted, it isn't the "install an app and measurement begins" form like Shopify or BASE; you prepare the tag, the record of purchases, and the product data on your own. The high freedom takes more effort, but it's also the strength of being able to build exactly as you want.
Q. If I just get the setup right, will I know which channel is selling?
A. It widens up to source-by-source traffic and revenue totals. But there's no standard screen that lines up "revenue per visit" by channel to compare, and the source splits across Direct and (not set). Bots can dirty the numbers too. The visible range widens, but deciding the next move by revenue efficiency takes one more bit of work.
Q. If I add RevenueScope, do I no longer need GA4?
A. No — it's a complement, not a replacement. It rides along on the tag and the record of purchases (dataLayer) you wired through EC-CUBE to receive data, so the same foundation that GA4 and others prepare is required. The difference in roles: GA4 is the checkup that shows "what happened," while RS is the prescription that shows "where to invest" through per-channel revenue efficiency.
Summary#
EC-CUBE is self-hosted, so its high freedom means you build GA4 ecommerce tracking yourself. The easy places to get stuck are the tag placement, the order-complete signal (purchase), and the product data (items). For all three, once you understand "where it jams and how the symptom shows up," the direction to fix becomes visible. For exact click-by-click steps, going straight to the EC-CUBE or GA4 official docs beats guessing your own way.
And the thing not to forget: setup is the foundation, not the goal. GA4 is a checkup that reflects "what happened," while the real question is whether you can decide "where to move your hands next" by revenue. Judge by traffic volume alone and you may stop a channel that was creating demand, and end up shaving your own revenue instead. Make it so you can line up the source by revenue efficiency (per-channel RPS), and you can choose the next move with your own numbers, not a hunch.
See which ads actually drive revenue, at a glance
Free up to 5,000 sessions/month, AI analyst included. No credit card required. Up and running in 5 minutes.


