Paste an ad report into ChatGPT and ask it to "analyze this" — it's quick, and for a one-off hypothesis check it genuinely helps. But repeat the same thing every week, across several platforms, and it gradually stops holding up. The pasted numbers are a stale slice from the moment you pasted, each platform counts differently, and they never connect to revenue. This article, for people new to running ads, focuses on how far "paste it in and let AI analyze" actually works, and where it breaks. The short version: for a one-off, pasting is enough. The more you repeat a decision, the better it is to let plain ChatGPT read your own numbers directly — faster, and more accurate.
Table of contents
Key takeaways#
- Pasting an ad report into ChatGPT to analyze it is useful for a one-off hypothesis check. It is not worthless.
- But pasting has four limits: you re-paste every time, each platform counts differently, the numbers go stale the moment you paste, and they don't connect to revenue.
- Because ads span several platforms, these limits show up especially strongly. The more you repeat a decision, the more letting AI read your own numbers directly wins on speed and accuracy.
1. How far does pasting really take you#
The short version: paste-in analysis is genuinely useful for a one-off hypothesis check. Let's give it that credit first.
ChatGPT has a data-analysis feature that reads a table or CSV you paste and totals it up or charts it [1]. Paste an ad report, ask "which campaigns are working?", and a plausible angle comes back quickly. For taking one look or forming a hunch, that's plenty useful.
The trouble starts after that. You want AI to answer for your situation, not in general — but when the information you can paste is limited, the reply drifts toward average, generic advice. The way to hold that "drift to generalities" in check with your own numbers is covered in Turning AI's generic advice into your own data.
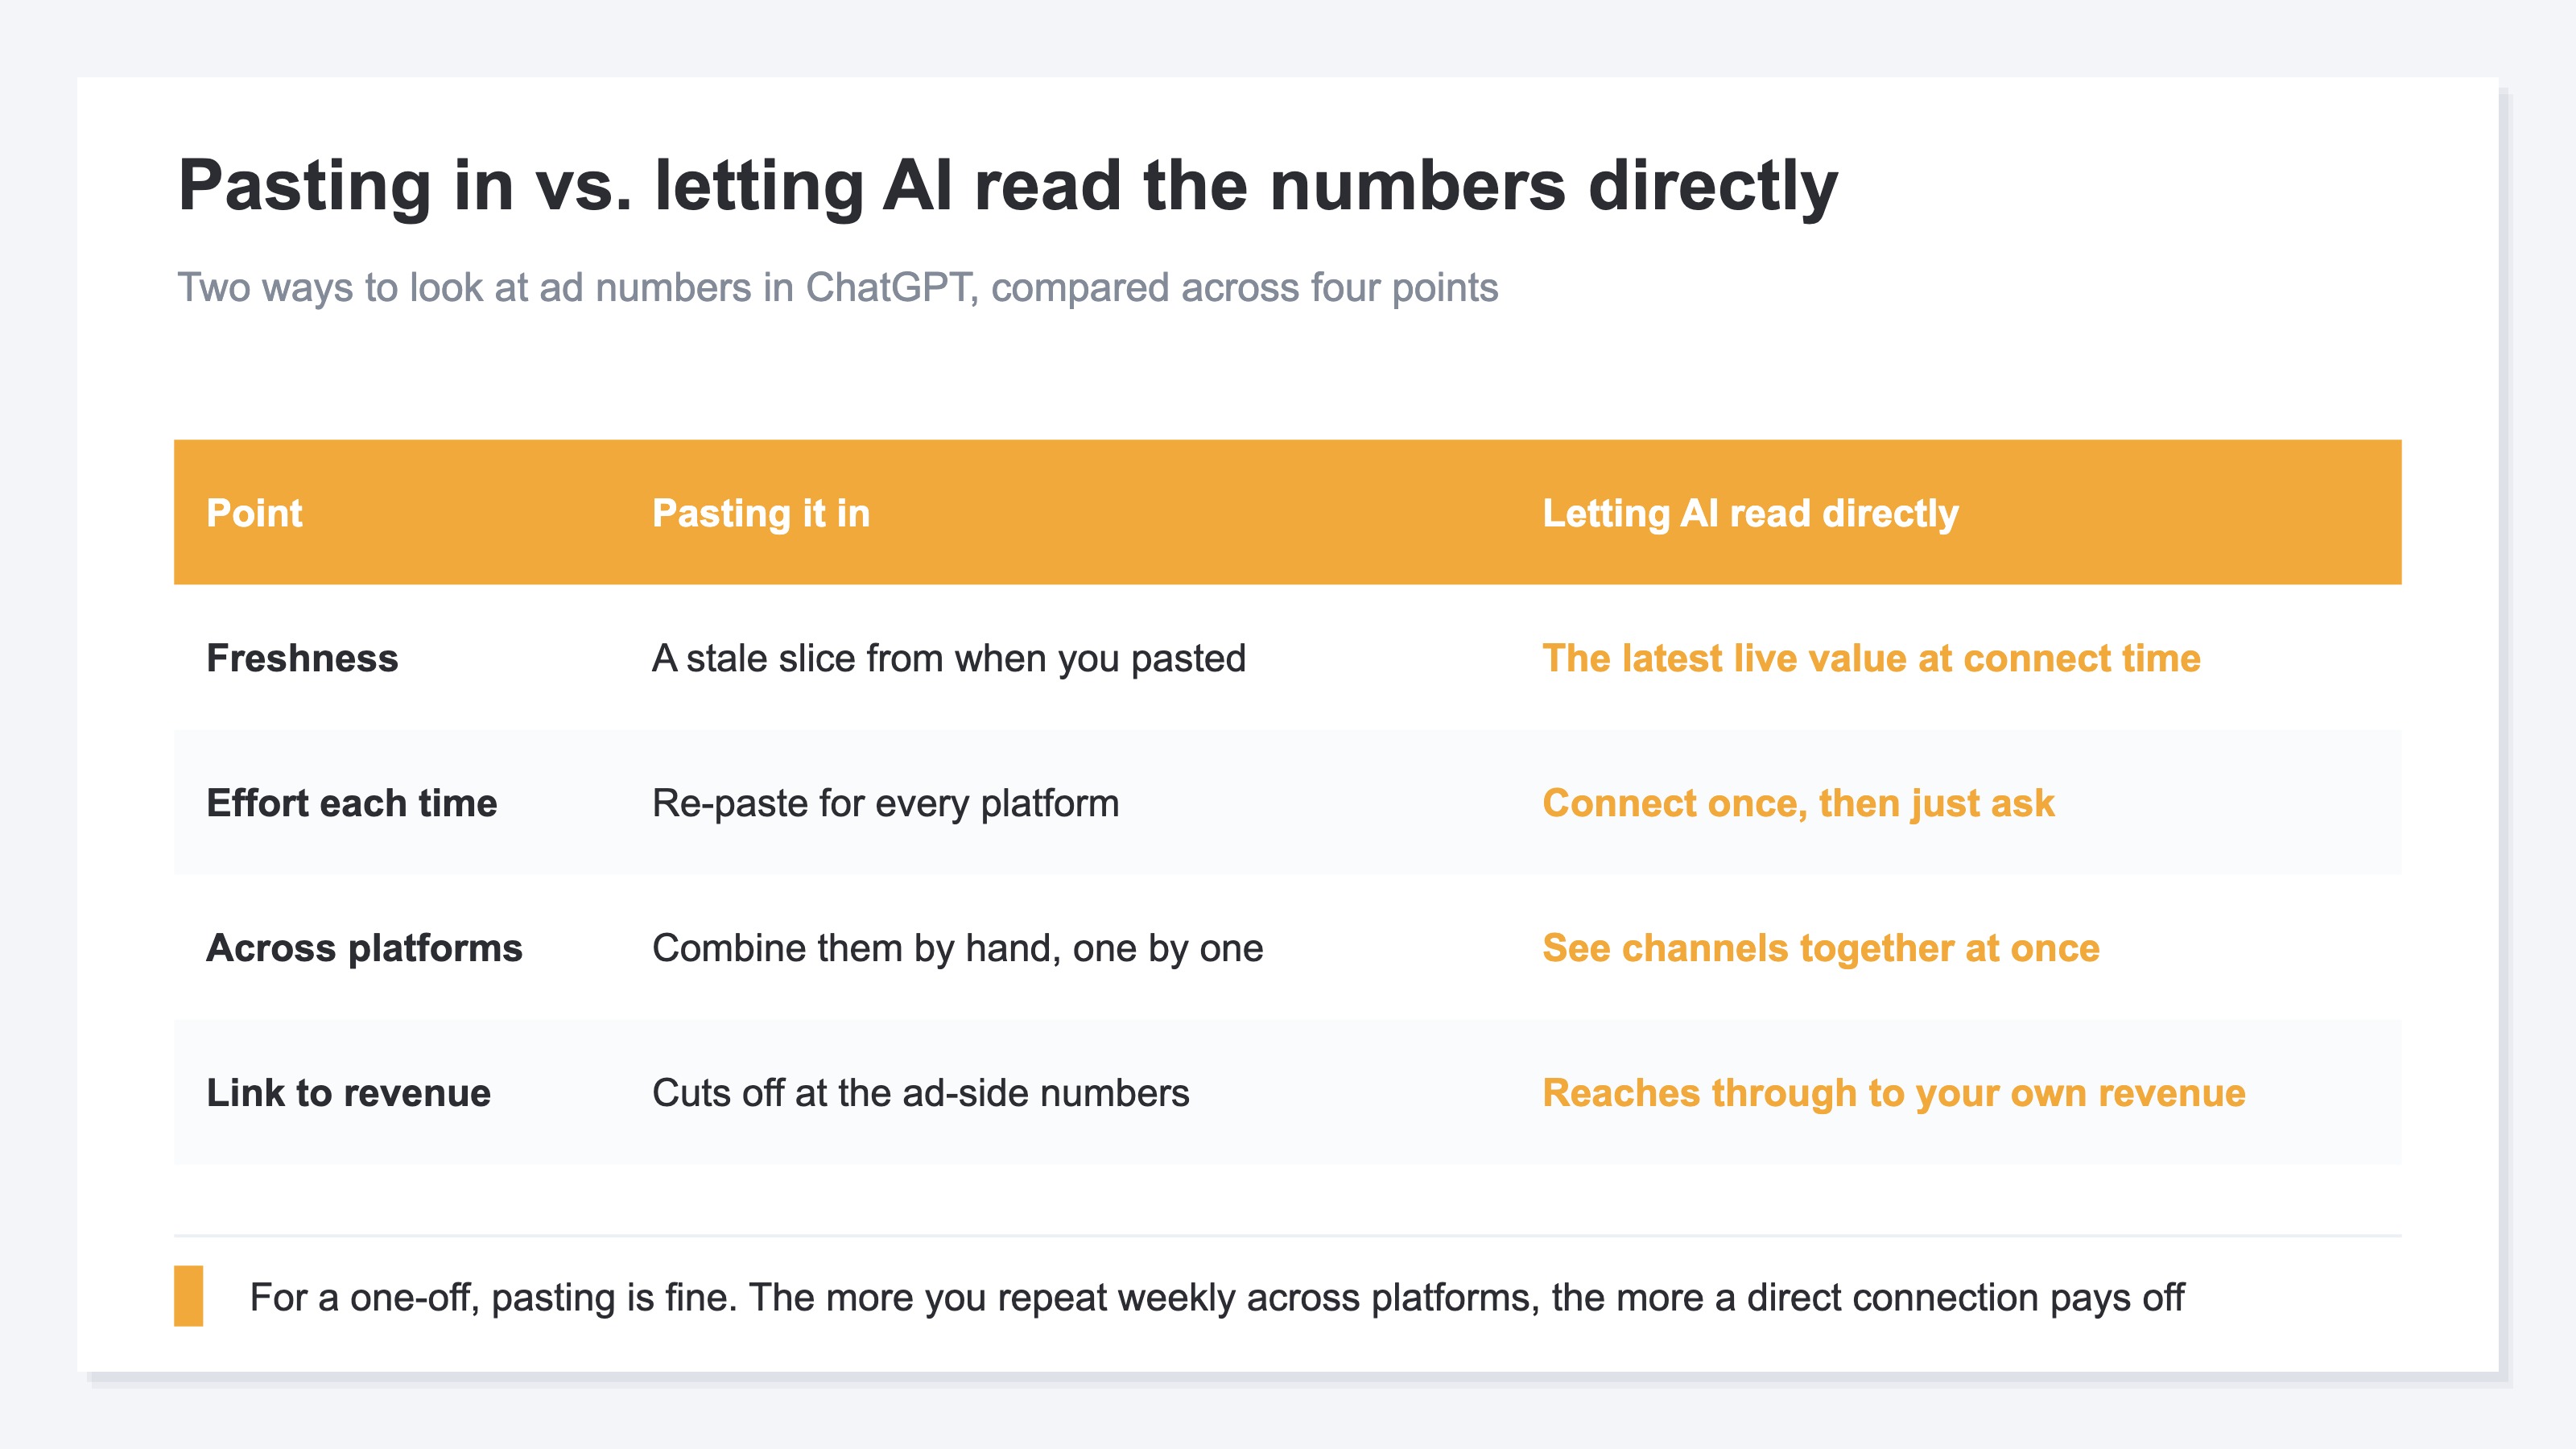
As the table shows, what you get changes depending on whether you paste or connect directly. For a one-off, pasting is enough. But the more you repeat a decision weekly and across platforms, the more the weaknesses of pasting stack up.
2. The four limits of paste-in analysis#
The short version: pasting has four limits — you re-paste every time, each platform counts differently, the numbers go stale the moment you paste, and they don't connect to revenue.
First, the effort of re-pasting. A decision is never made just once. Next week and the week after, you open the latest report and paste it again each time. That chore itself becomes the reason people stop.
Second, platforms count differently. Google Ads and Meta ads don't use the same definition of a result or the same reporting window. Line the pasted numbers up side by side and, in fact, they may not be numbers you're allowed to add together.
Third, the numbers go stale the instant you paste. A pasted table is like a still image cut out at that moment. You end up using yesterday's results for today's decision — and it's hard to notice.
Fourth, they don't connect to revenue. What you paste is the ad-side report, so the story stops at the ad's result value. You never reach the point that matters: how much revenue that ad actually generated for your own store.
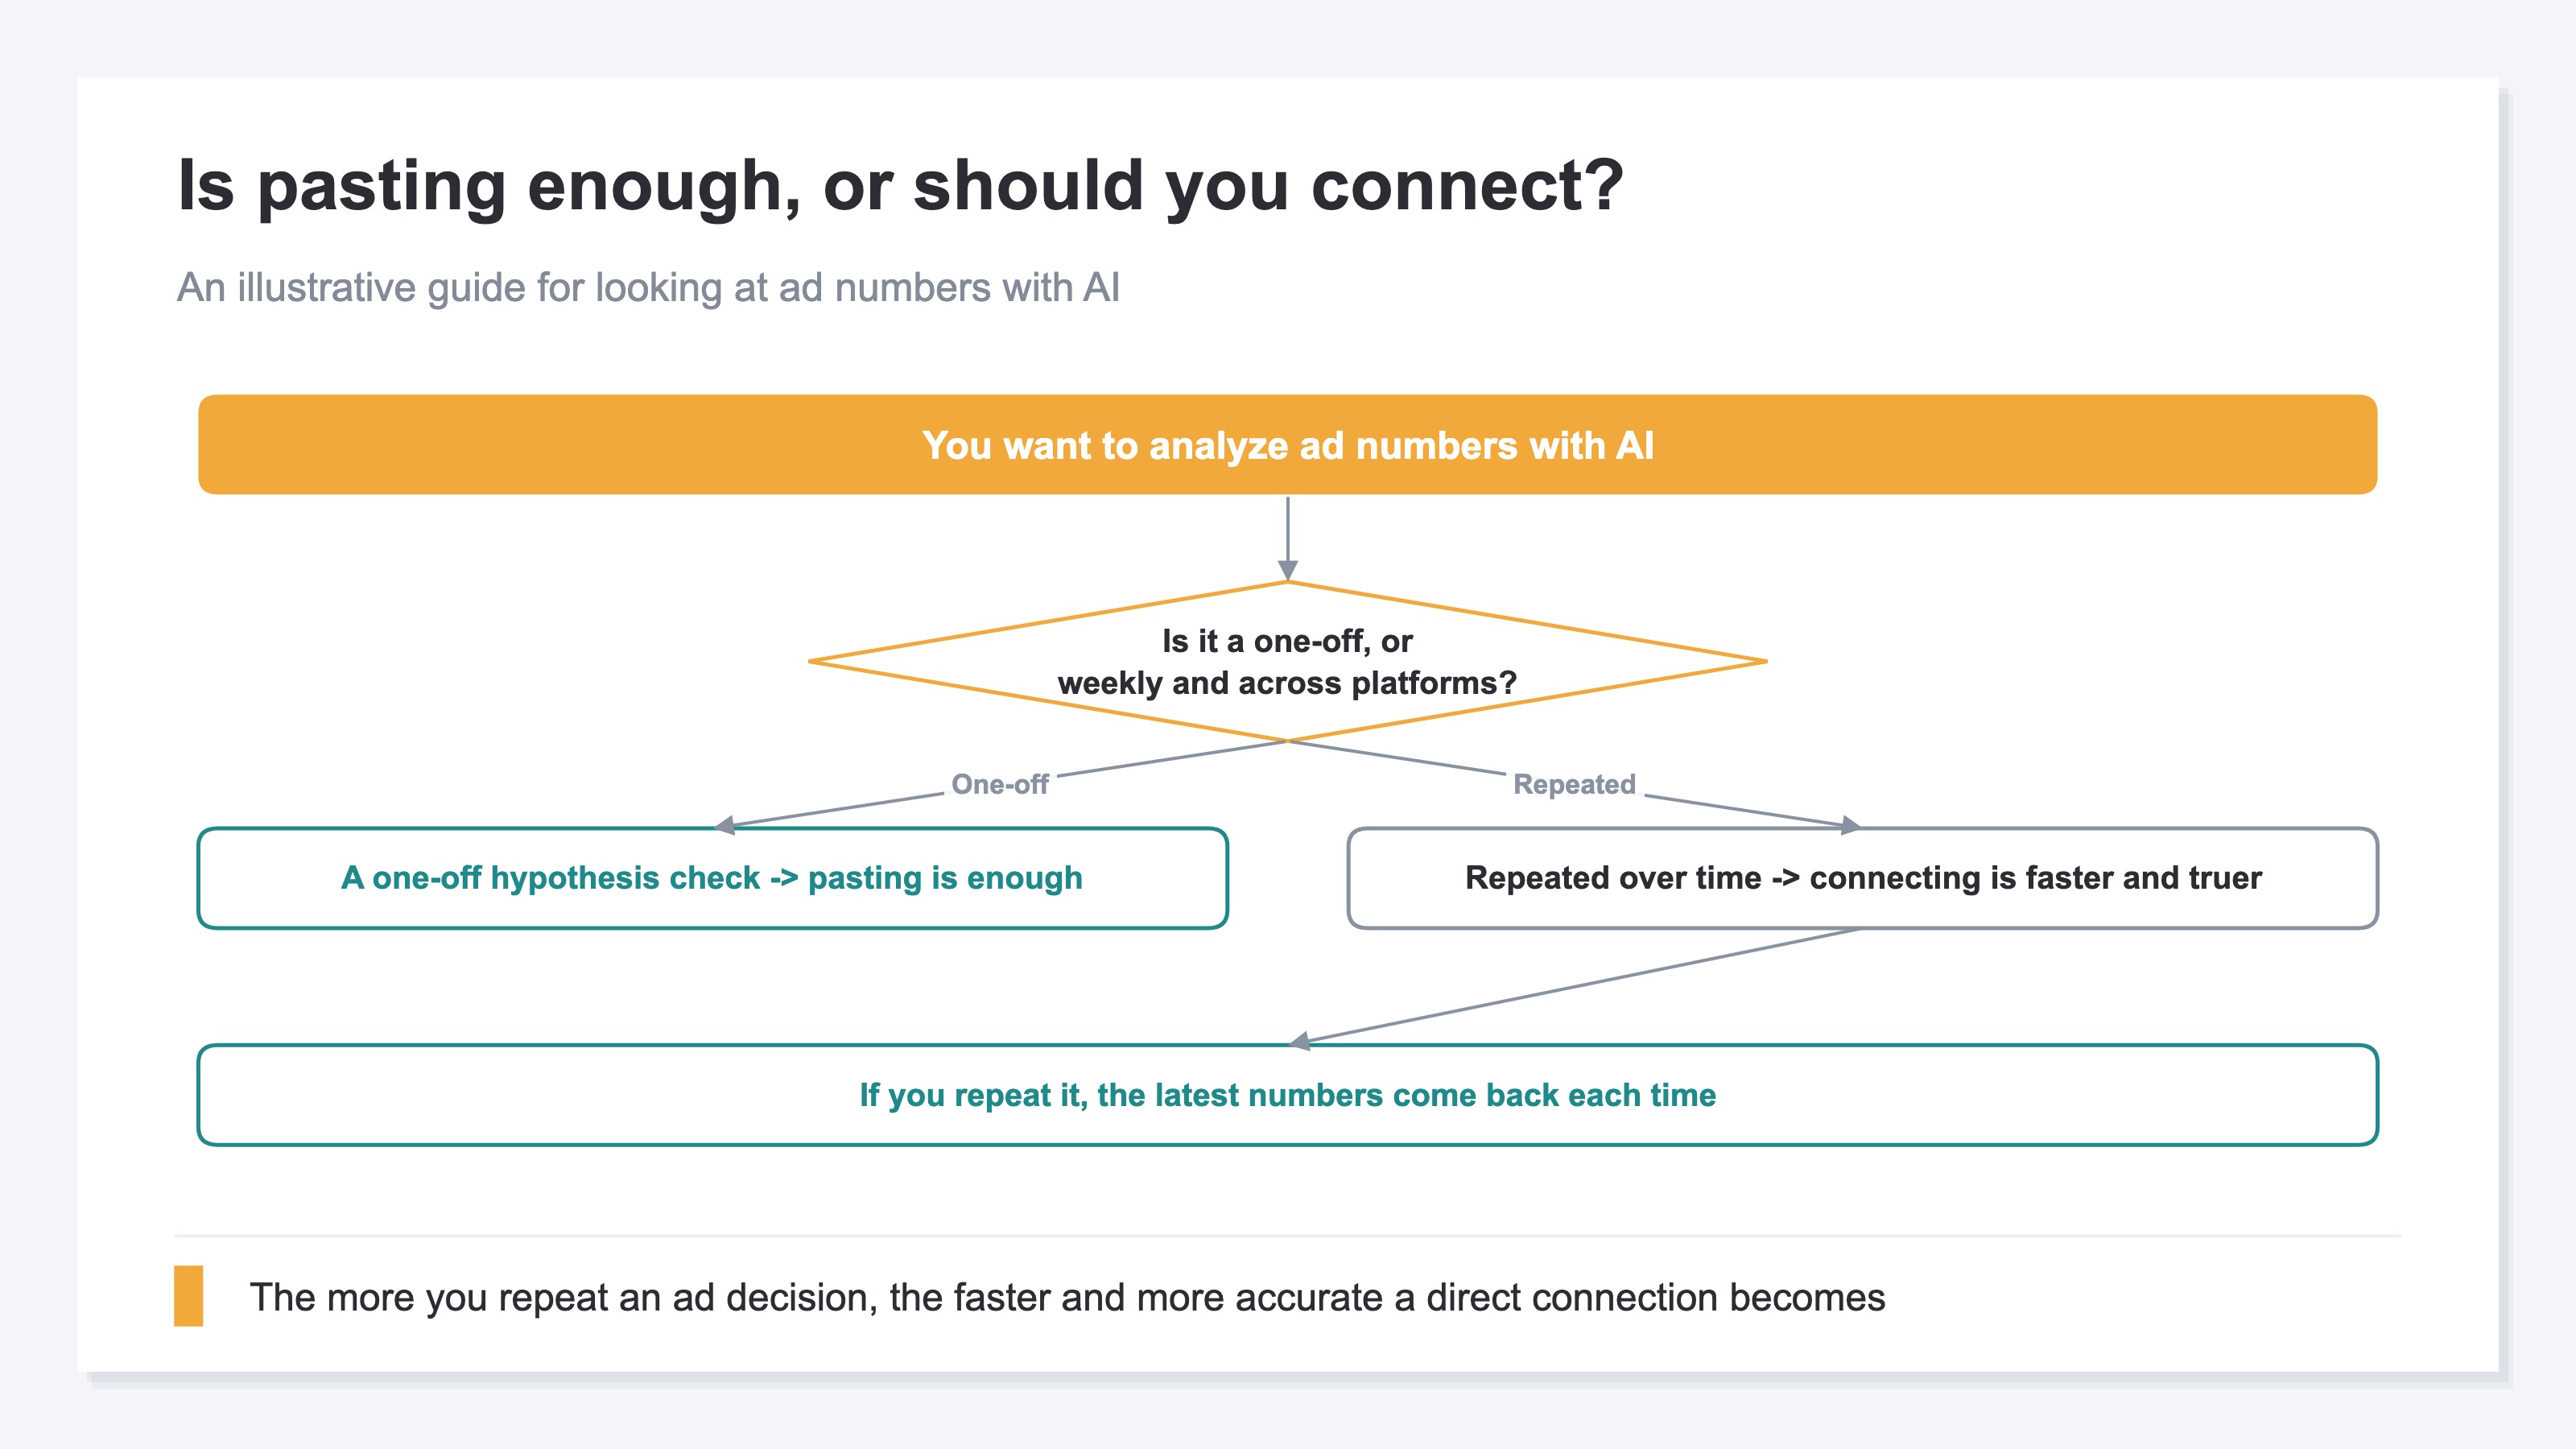
As the diagram shows, the answer changes with how you use it. For a one-off hypothesis check, pasting is enough. But for a decision you repeat weekly across platforms, connecting directly is faster and more accurate. This is a separate question from having AI compile a monthly recap, which is covered in Automating your monthly report with AI.
3. Ads break down especially across platforms#
The short version: because ads span several platforms, the limits of pasting show up especially large.
The result values a platform's report shows — conversion values — are each counted by that platform's own definition. Google Ads has its own way of counting [2], and Meta ads have their own attribution system [3]. When the same purchase gets counted as "my result" by more than one platform, the sum of platform reports tends to run larger than the revenue you actually received at your store.
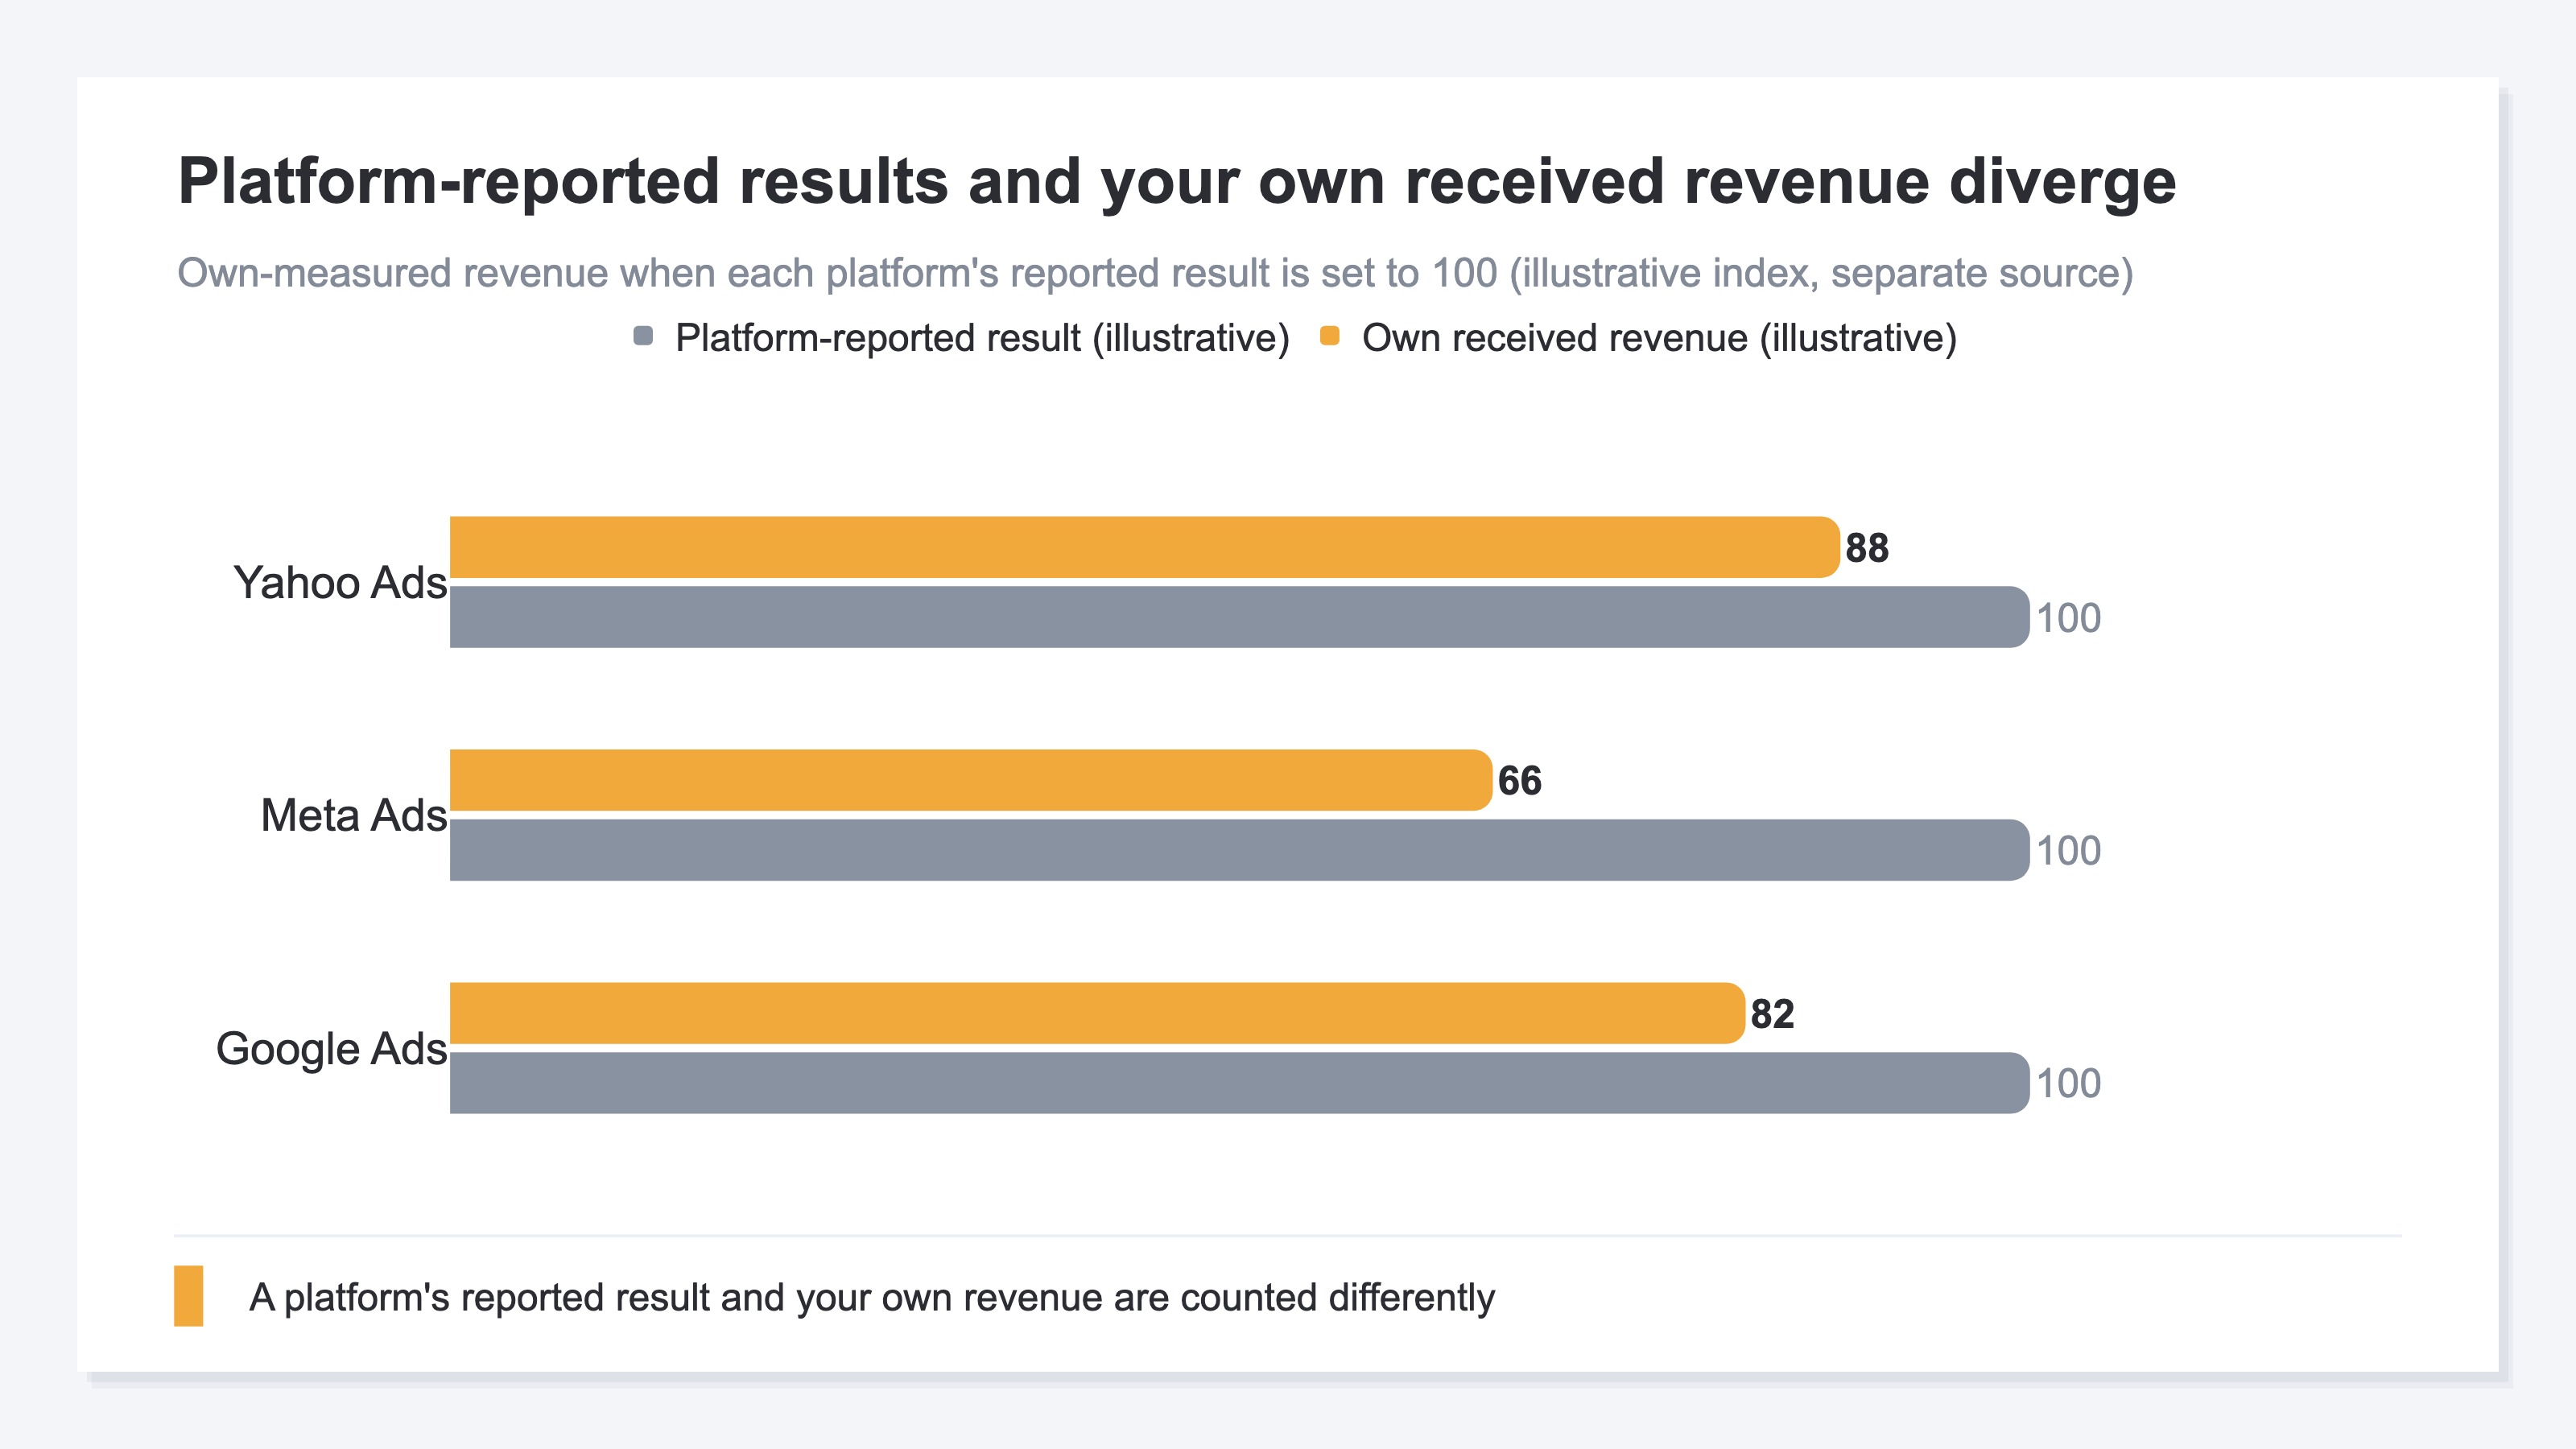
The chart above shows, with each platform's reported result set to 100, how far your received revenue runs below it — an illustration. A platform's reported value and your own revenue are safer treated as different numbers from the start. Checking agency or platform reports against your own revenue is covered in Reconciling agency reports with your own data, and reading efficiency by the whole (MER) rather than per-platform ROAS is in Per-platform ROAS vs. overall MER.
These cross-platform gaps are hard to keep up with by pasting. Pull ad spend in so it can be viewed by channel, and you can compare, at once, how much you spent on each platform and how that flowed through to your own revenue.
RevenueScope's solution
With pasting, every week brings the heavy work of re-gathering the latest numbers, correcting for each platform's counting differences in your head, and only then connecting to revenue. The idea is simple, but the repetition doesn't last.
RevenueScope is a tool with the aggregations an online store needs for revenue decisions already built in. Pull in ad spend, and it places spend, ROAS, and saturation by channel on the same screen as the revenue and RPS (revenue per session, per single visit) you measured yourself. Connect RevenueScope to ChatGPT or Claude, ask "which ad channels are working?", and it comes back like this (display uses demo data).
| Channel | Ad spend | ROAS | Saturation | Own-measured revenue | RPS |
|---|---|---|---|---|---|
| Google Ads | ¥300,000 | 3.8 | Medium | ¥980,000 | ¥420 |
| Meta Ads | ¥200,000 | 2.1 | High (plateauing) | ¥410,000 | ¥260 |
| Yahoo Ads | ¥120,000 | 4.2 | Low (room to grow) | ¥470,000 | ¥380 |
The read that matters is being able to compare ad-side ROAS and your own revenue on the same row. Because the numbers are connected, you don't re-gather them each time — ask, and the latest value at that moment comes back.
Here's the honest part. The ROAS result values in the table are each platform's reported figures, while revenue and RPS are your own separately measured numbers from a different source. They're counted differently, so reconciling them still takes a separate step. For channels where ad spend isn't connected, ROAS and saturation aren't shown (they're left blank). Filtering by country or device doesn't apply to ROAS, which comes from platform data. RevenueScope isn't a tool that auto-writes report prose — reading and putting it into words is the AI's job. It doesn't replace GA4 or ChatGPT either; it sits alongside them as a complement. It doesn't output profit margins or customer lifetime value (LTV). What RevenueScope does is keep the numbers you need for a decision directly readable at any time.
FAQ#
Q1. Should I stop pasting ad reports into ChatGPT?
No need to stop. For a one-off hypothesis check or forming a hunch, it's useful. Where it stops holding up is when you repeat the same decision weekly across several platforms. In that repeated setting, connecting directly beats pasting on speed and accuracy.
Q2. Does this mean I shouldn't trust a platform's reported ROAS?
It doesn't mean it's useless. But a platform's result value is a reported figure counted by that platform's own definition, so it's a different number from the revenue you received. If you'll use it for a decision, checking it against your own revenue is the safe move.
Q3. Can I not see ROAS without connecting ad spend?
Right. For channels where ad spend isn't pulled in, ROAS and saturation aren't shown — forcing a "divide by zero" figure would only mislead. The realistic path is to start with the channels where spend is connected and read the measured efficiency there.
Summary#
Pasting an ad report into ChatGPT to analyze it is useful for a one-off hypothesis check. It is not worthless. But it has four limits — re-pasting every time, each platform counting differently, going stale the moment you paste, and not connecting to revenue — and those show up especially strongly for ads that span several platforms.
The more you repeat a decision, the better it is to let AI read your own numbers directly than to paste. The next move is to keep your own ad and revenue numbers directly readable by plain ChatGPT. Then, at every weekly decision, the answer comes back with the latest numbers of that moment.
See which ads actually drive revenue, at a glance
Free up to 5,000 sessions/month, AI analyst included. No credit card required. Up and running in 5 minutes.