You heard AI could produce the document fast. You tried it on your monthly report, and somehow the monthly effort barely dropped. That happens at a lot of online stores.
The reason is clear. The time sink isn't the part where you polish charts and prose. It's the step before that — gathering numbers scattered across ad dashboards, web analytics, and the store admin, then shaping them every month. Until you can hand that step to the AI, no amount of AI horsepower makes the work lighter.
This guide covers where the time really goes in a monthly report, why the automation doesn't last even when you let AI do it, and how to think about feeding your own latest data to the AI on an ongoing basis.
Table of Contents
TL;DR#
- The real effort in a monthly report is gathering and shaping data, not making charts. Collecting the latest numbers from several dashboards, retyping them, and aligning by channel and prior period takes up most of the work.
- AI can format a report, but it only understands the data you give it. Hand it stale or incomplete numbers and it will confidently produce something that looks right but isn't.
- Re-pasting by hand every month doesn't stay automated. The effort remains, and missed pastes or period mismatches are hard to catch.
- The key to lasting automation is a way to keep feeding your own latest data to the AI. Connect once and you stop re-explaining every month, so the AI builds the report on your correct numbers.
1. Where the time goes in a monthly report#
When people hear "monthly report," they picture building charts and tables. Do it for real, though, and the time goes somewhere else: the step before that.
Ad dashboards, web analytics, the store admin — the numbers you need are split across places, and every month you start by collecting them by hand. Then you paste them in, split them by channel, and align them so you can compare against the prior month or year. Most of the time disappears into this prep work, before you ever touch the formatting.
The figure below places each task in a monthly report by "monthly weight" and "how well it automates."
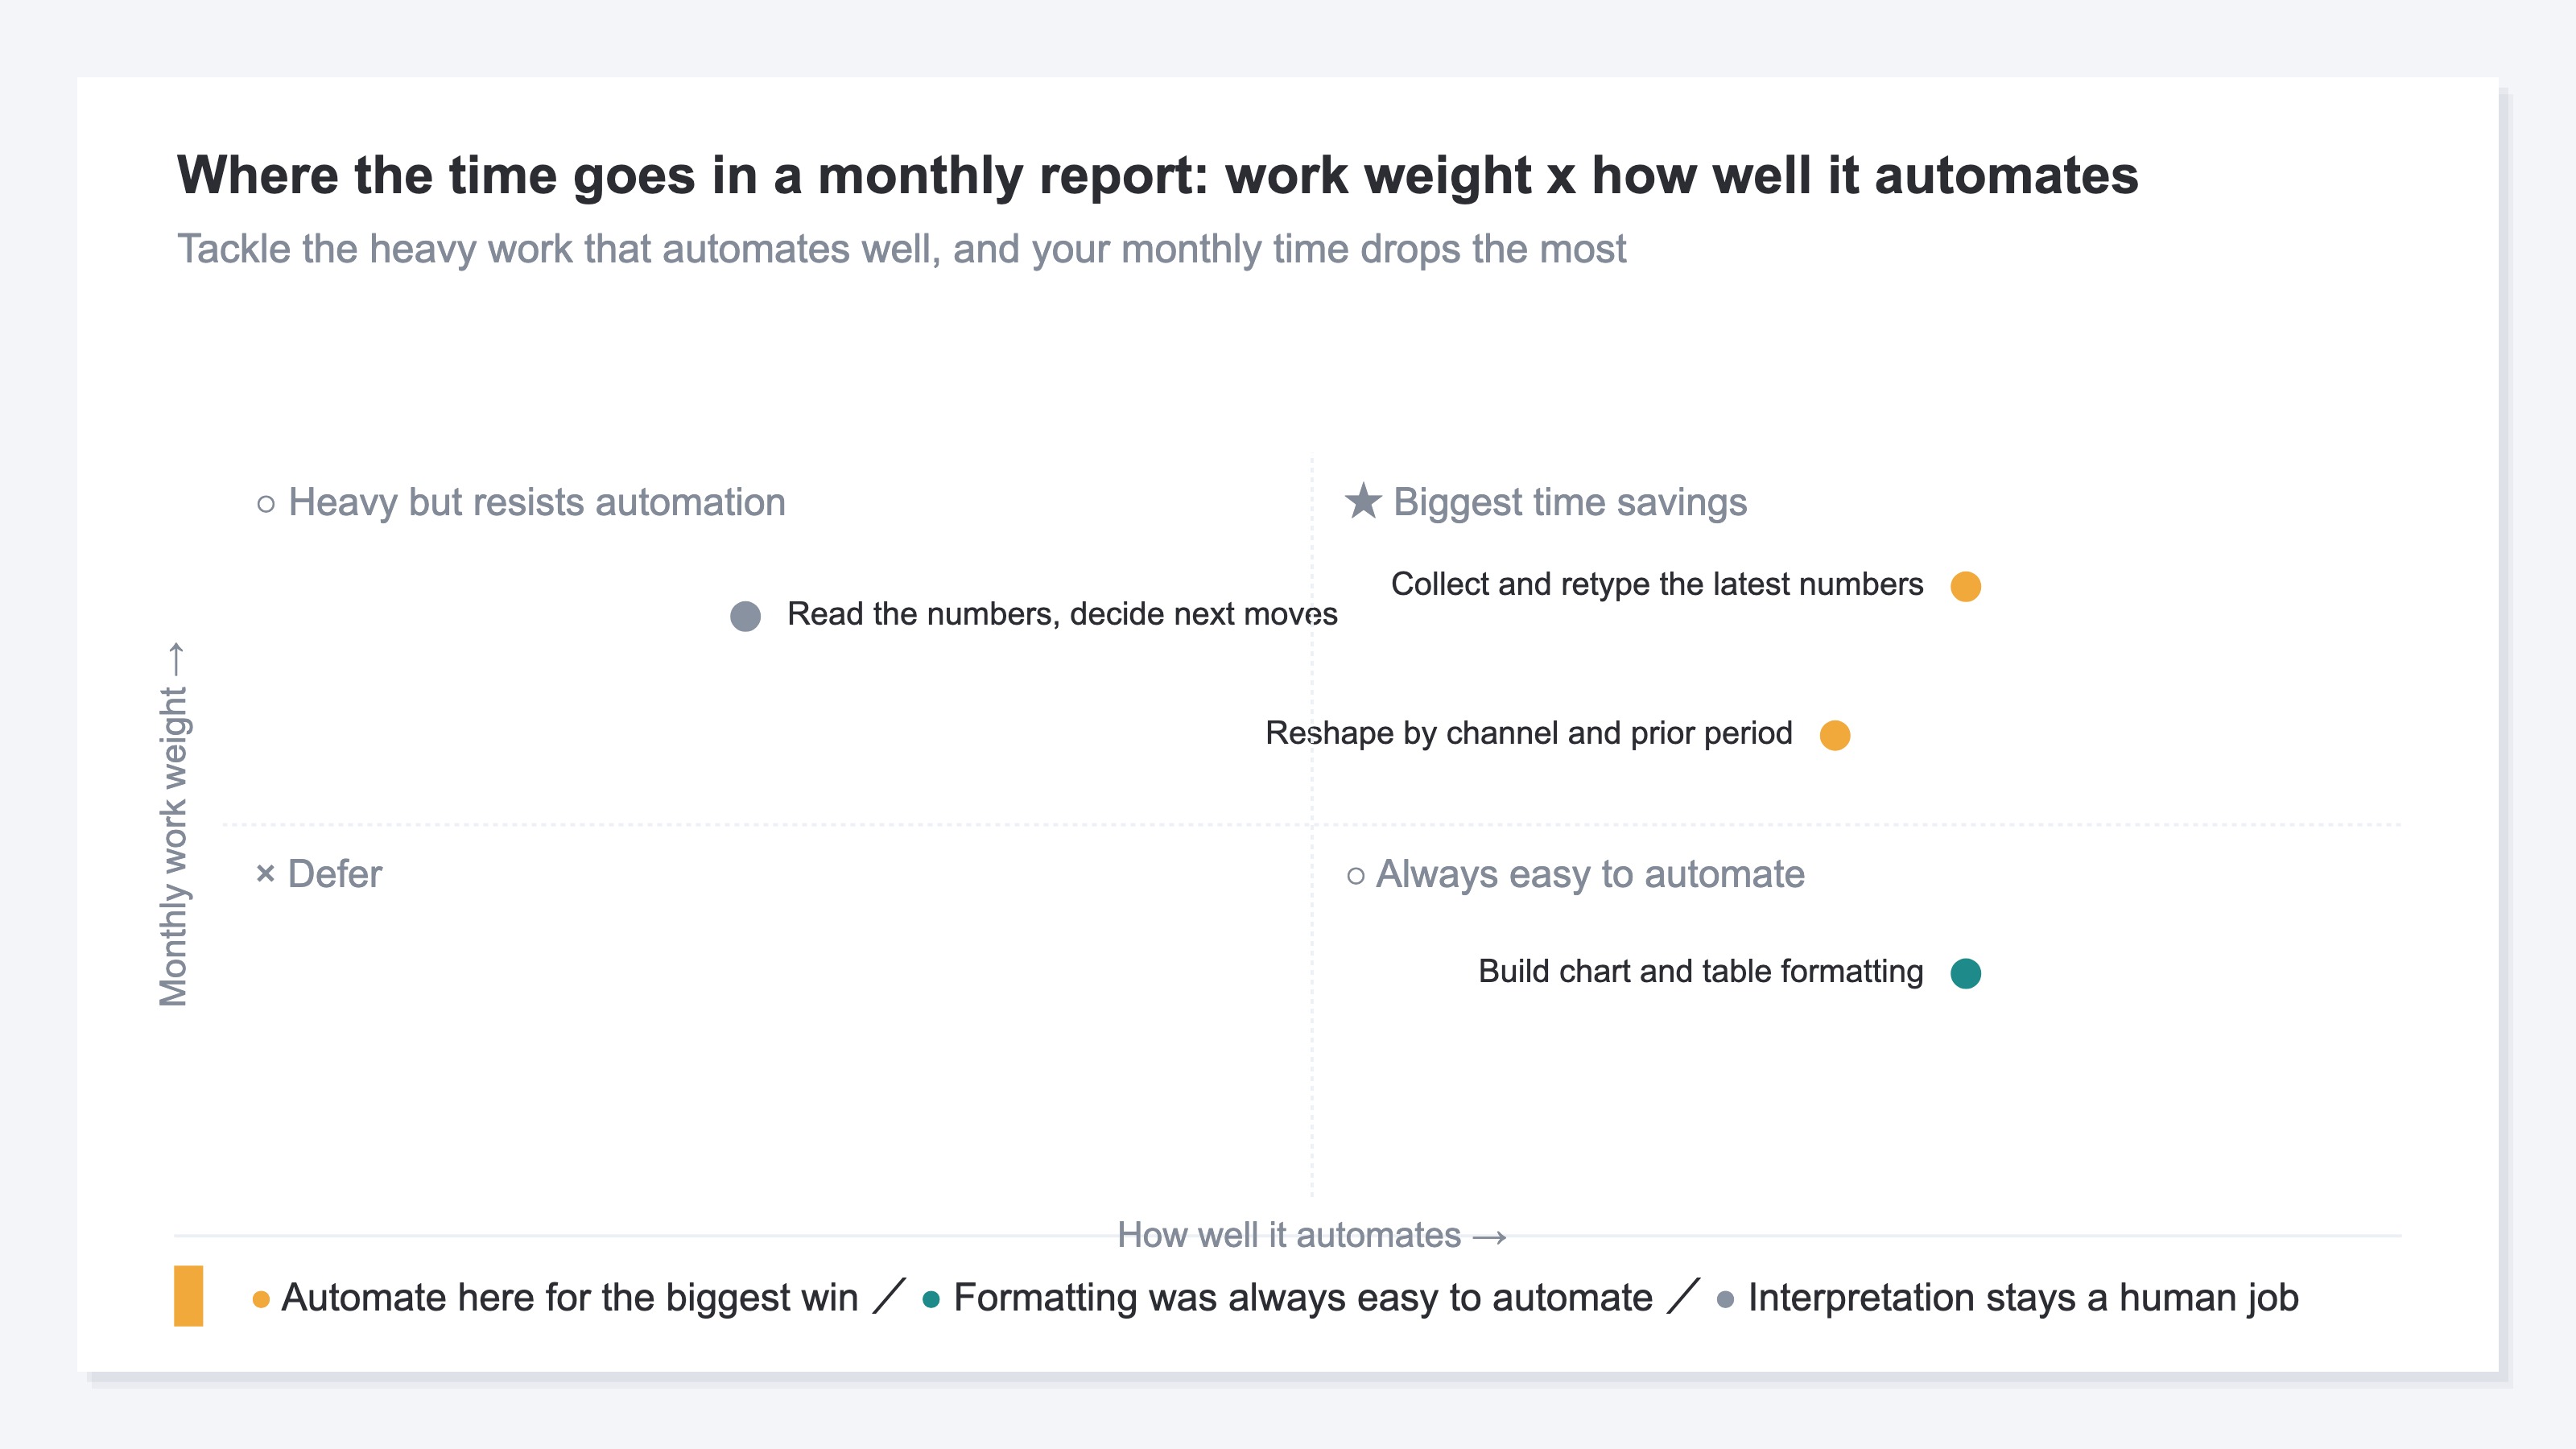
The top right is where collecting and retyping the latest numbers — and reshaping them by channel and prior period — land. Heavy every month, and a good fit for automation once you build the mechanism. Chart and table formatting is something AI was always good at. Reading the numbers to decide your next move is a human job. So what AI truly makes easier isn't the formatting, but the step before it: gathering and shaping the data.
2. AI only understands the data you give it#
Hand report-building to AI and the prose and tables come out looking right. It looks good enough that you want to leave it all to the AI.
But AI can only work with the data you give it. Hand it numbers only up to mid-month and it builds the report on that stale data. Forget to paste one channel during collection and it won't notice the gap — it returns "done" with numbers missing. AI doesn't check whether the material it was given is correct.
So the real question in automating monthly reports with AI isn't "which AI tool to use." It's "how do I keep feeding my own latest data, correctly?" If the way you hand over the material is sloppy, even the most capable AI keeps producing a report that looks right but is wrong, month after month.
3. Re-pasting every month doesn't stay automated#
"Then I'll just copy and paste the latest numbers every month," you might think. For a one-off, that's fine. The catch is that a monthly report repeats every month, and pasting runs into trouble over time.
- The effort doesn't disappear. Even if AI builds the formatting, gathering numbers from several screens and re-pasting them stays the same every month. The heaviest step is still by hand.
- Wrong numbers slip through. A missed paste, a period mismatch, a duplicate of the same order — all easy to happen, hard to spot at a glance. AI uses what it's given as-is, so wrong material produces a wrong report.
- The shaping happens every time. Splitting the gathered numbers by channel and aligning them against the prior period doesn't finish with paste alone. That's where the time goes, every time.
The figure below compares the time for one monthly report done by hand versus with the data connected to the AI.
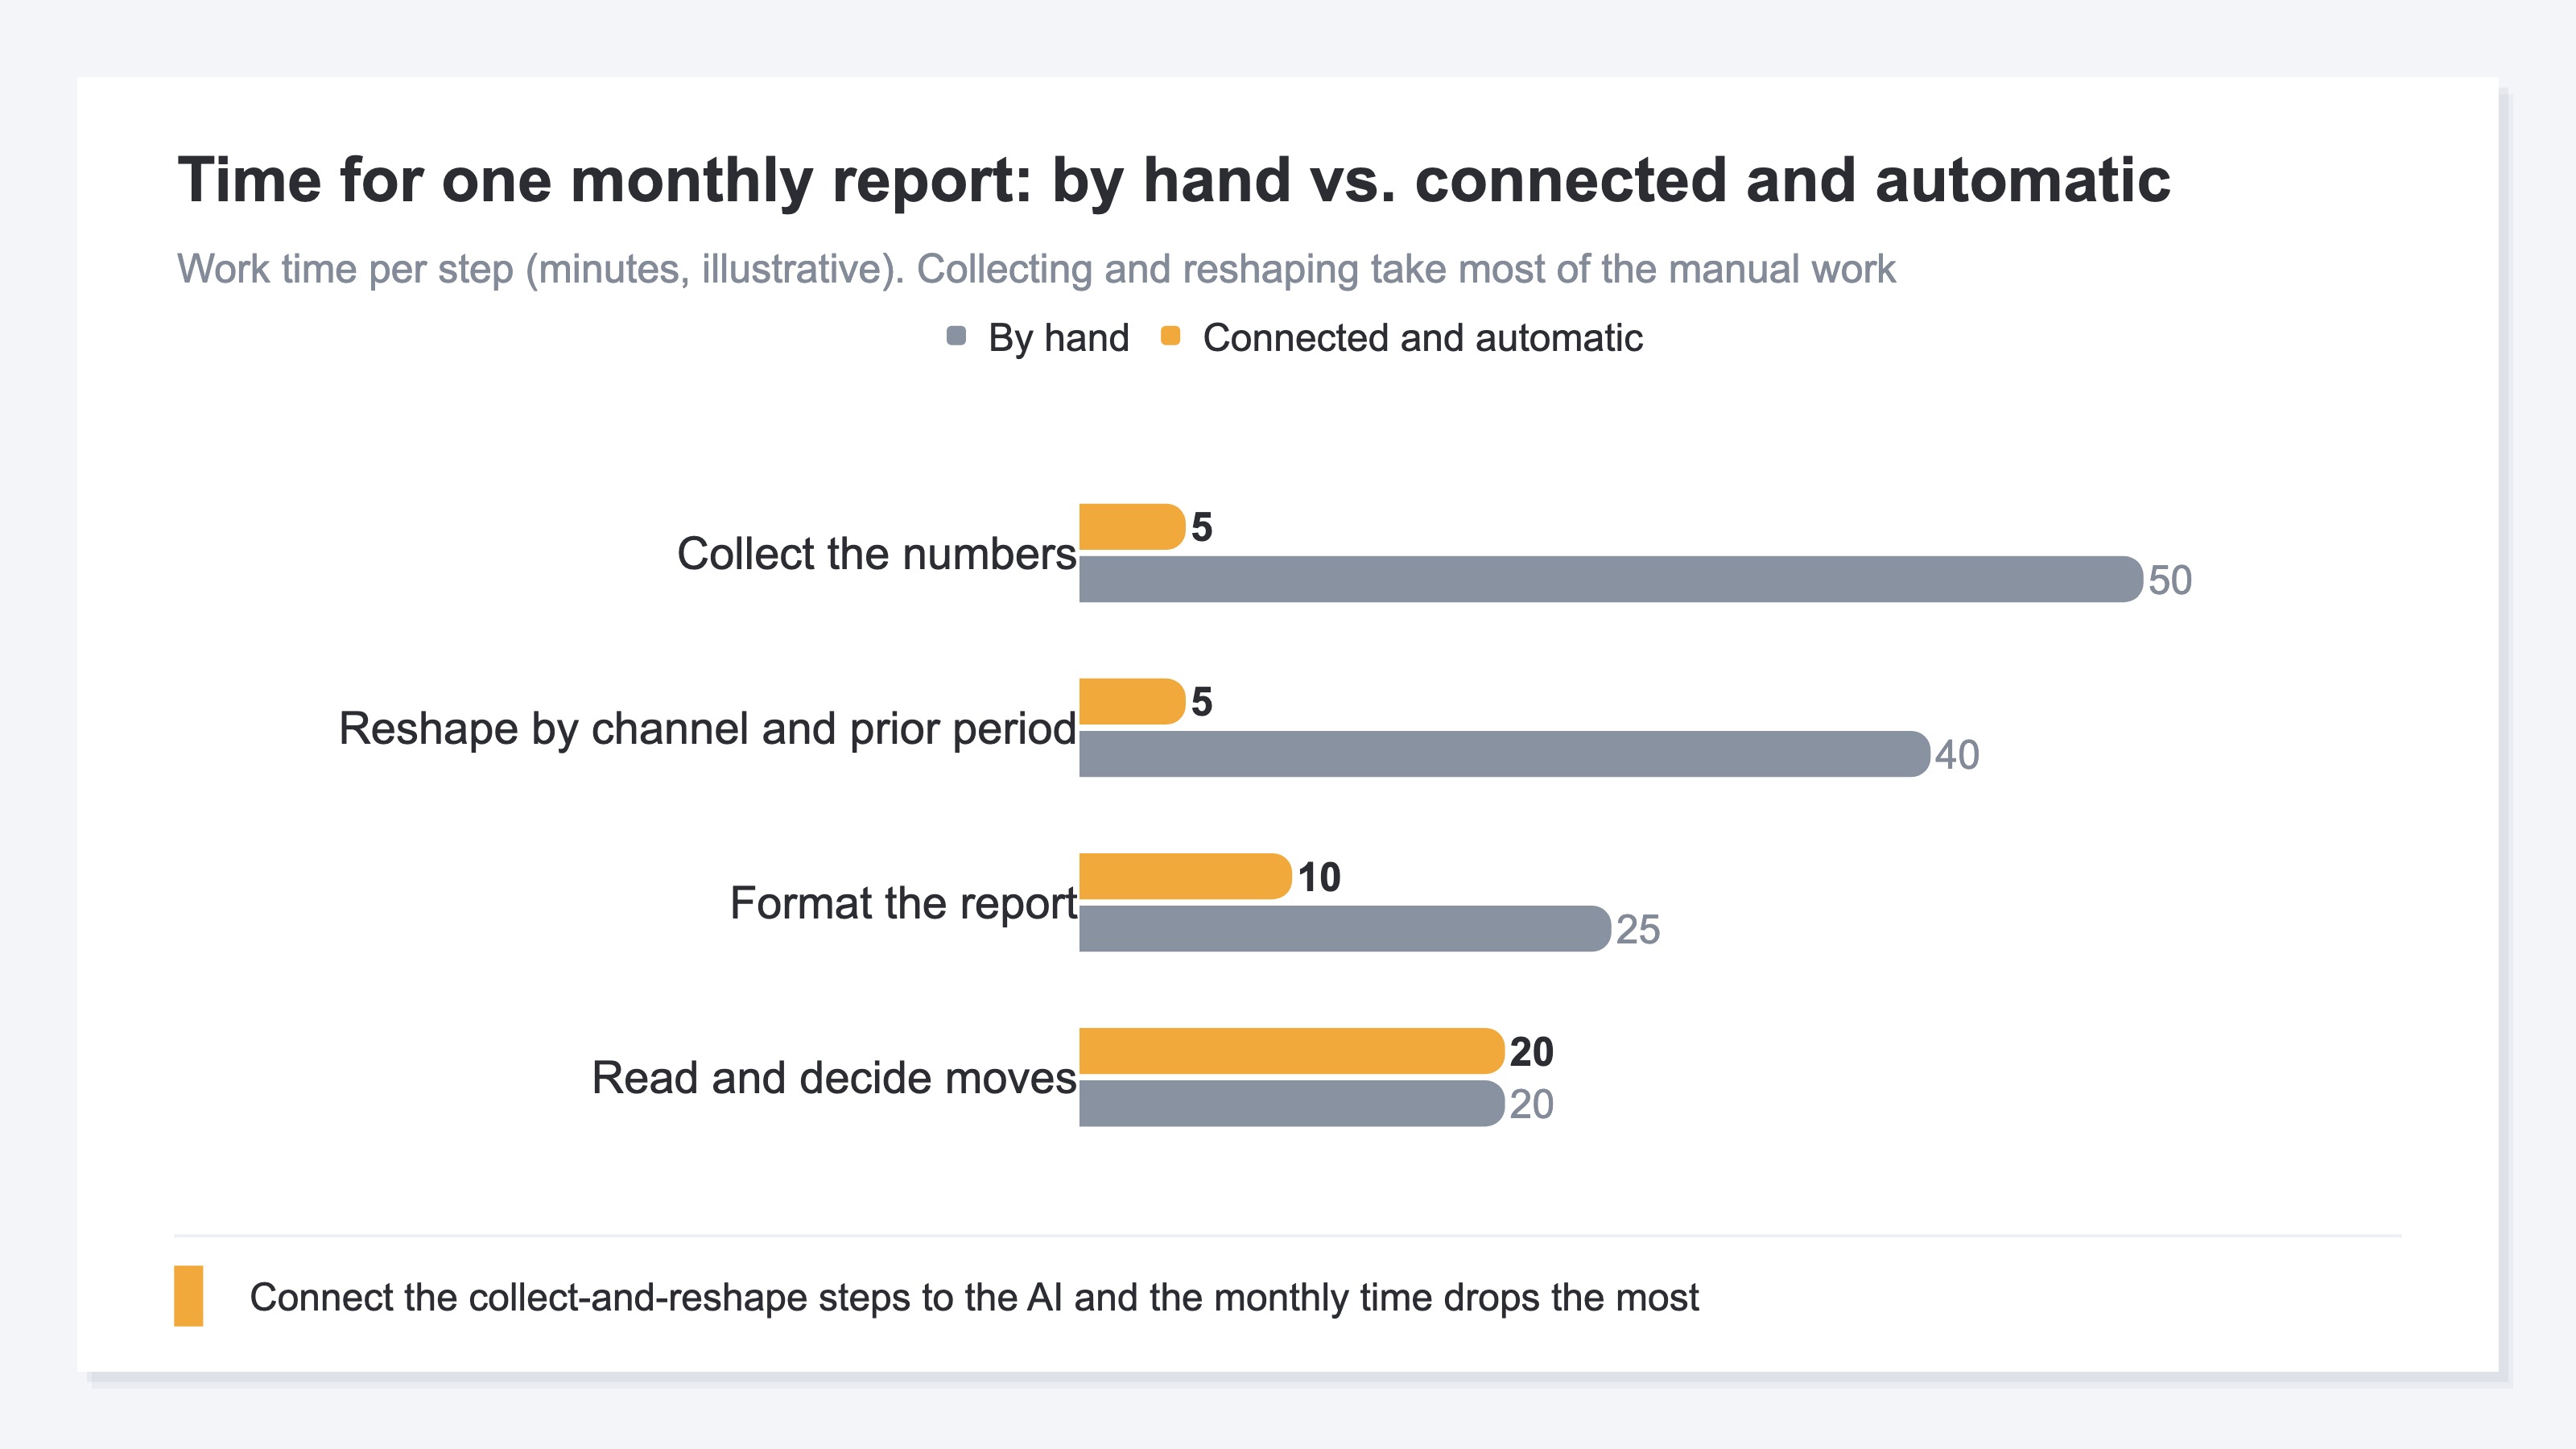
Collecting the data and reshaping it by channel and prior period take a large share of the time by hand. Reading the numbers to decide a move is a human job, so automating it barely changes. The biggest win is connecting the "collect and shape" step to the AI.
4. How to feed your data to the AI#
The key to easing a monthly report isn't the AI tool itself, but "how you keep feeding your own latest data." There are roughly three ways to do it.
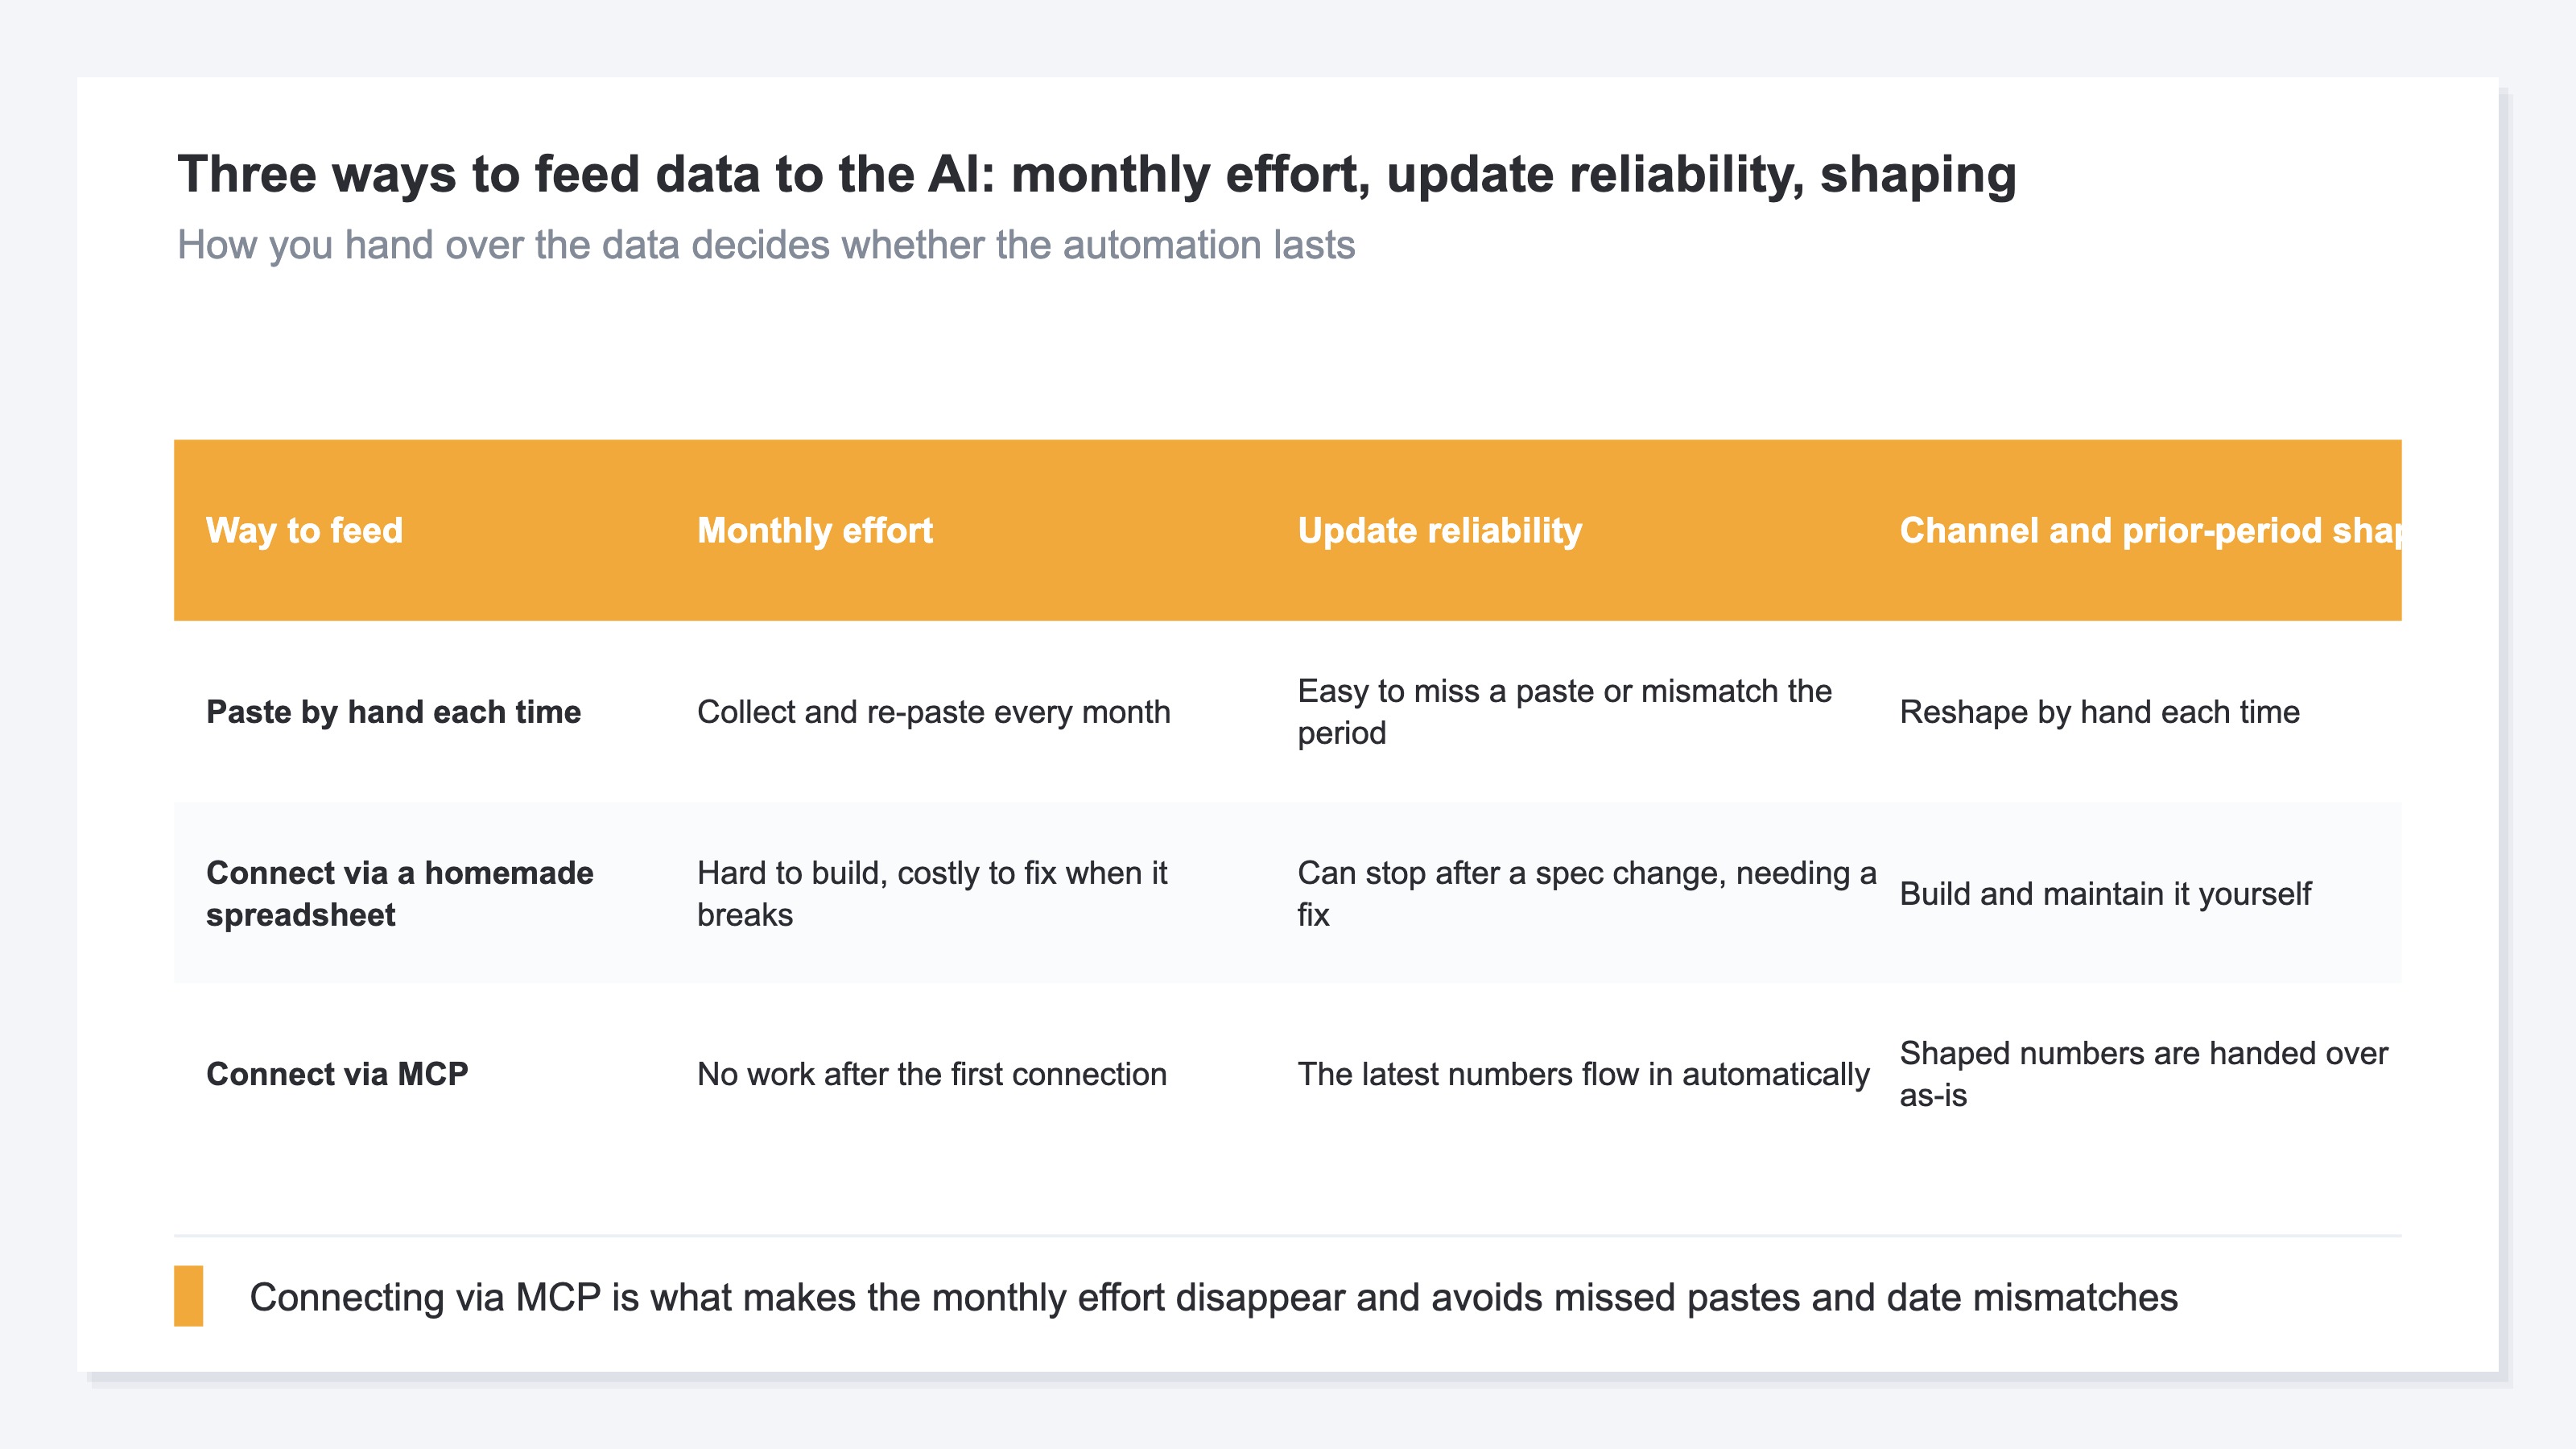
Pasting by hand each time is easy to start, but the monthly effort doesn't go away and missed pastes and period mismatches are common. Connecting via a homemade spreadsheet is easier than paste once built, but it's hard to make, it can break when a screen's spec changes, and you keep fixing it yourself.
The third is connecting your own data directly to the AI. Recently, a common standard for this — MCP — has been spreading. It's a new way to feed your own data to an AI, with no complicated setup. Connect once and the latest numbers flow in automatically, already shaped by channel and prior period. You no longer tell the AI "here are this month's numbers" each time — and whether you can reach that state decides whether the automation lasts.
RevenueScope solution
The monthly effort that won't drop even with AI, and the reports that come out on stale numbers without you noticing, share one cause: the "latest, correct numbers" to hand to the AI can only be prepared by hand each month.
RevenueScope takes on that handing-over part. It gathers real revenue by channel from ad dashboards and web analytics, removes duplicates, aligns the numbers, and passes them to the AI through MCP. Connect it once and the AI can always look up your latest data, so you don't re-explain "here are this month's numbers" every month. What it hands over is five numbers — Revenue, AOV (average order value), RPS (revenue per session), CVR (purchase rate), and Sessions — together with their change versus the prior period.
The data reaches the AI already shaped, like this (demo data):
| Channel | Revenue | RPS (revenue per session) | CVR (purchase rate) | MoM (RPS) |
|---|---|---|---|---|
| Newsletter | ¥276K | ¥345 | 5.8% | +12% |
| Google search | ¥980K | ¥298 | 4.1% | +4% |
| Social ads | ¥1.7M | ¥210 | 2.6% | −9% |
Social ads have the largest revenue, but by RPS (revenue per session) the newsletter is on top and rising from the prior month, while social ads have large revenue yet a falling RPS. The AI takes these already-shaped numbers — "which channel grew efficiently" — and turns them straight into a report. Without anyone collecting and re-aligning by hand, it can write the key point, like "the newsletter worked last month," on the latest numbers.
What RevenueScope does is not build the report's formatting. It creates a state where the "latest, duplicate-free, shaped numbers" the AI needs can be handed over continuously, without re-explaining. That's the foundation for keeping AI-driven monthly report automation going, instead of ending after one time.
FAQ#
Frequently asked questions#
Q. If I let AI do the monthly report, is the effort gone?
A. You can hand off the formatting, but that alone leaves the effort. AI only builds a report from the data it's given, so you still gather and hand over those numbers every month. Paste that by hand each time and the heaviest step stays manual. Only when the latest data is handed over automatically does the effort drop a lot.
Q. Isn't connecting it myself with a spreadsheet enough?
A. Once built, it's easier than paste. But it takes effort to make, and it can break when a dashboard's spec changes. You fix it yourself each time, so keeping it going long-term carries a maintenance burden. Choose the way to feed that fits you, balancing effort against reliability.
Q. Which numbers should I include in the report?
A. Start with five — revenue, average order value, revenue per session, purchase rate, and sessions — plus their change versus the prior period, and the month-to-month shifts get easier to read. Align these by channel and you start to see which channel grew efficiently, too.
Conclusion#
Building a monthly report with AI isn't about handing the formatting to AI; it's about feeding your own latest data so the report keeps getting made. The monthly effort doesn't drop because the AI is weak — it's because you collect and retype the numbers by hand every time. AI only understands the data you give it, so unless the way you hand over the material changes, the automation won't last.
What to review first is less the AI tool itself and more how you're handing over your own data. If you're re-pasting each time, switching to a form where the latest data is handed over automatically cuts the heavy monthly work a lot. Connect once and you stop re-explaining every month — that's what decides whether monthly report automation lasts. Start by writing out which numbers you gather, and how, each month.
See which ads actually drive revenue, at a glance
Free up to 5,000 sessions/month, AI analyst included. No credit card required. Up and running in 5 minutes.