
The order count in WooCommerce and the number of purchase events in GA4 don't line up. On some sites the match rate settles around 80%, on others the gap opens to 50%. The size of the gap differs from site to site because WordPress leaves the measurement path for you to assemble yourself. This article lays out the order in which to isolate where purchases are dropping out, and how to decide which number you judge with.
Contents
TL;DR#
- The gap between WooCommerce orders and GA4 purchases changes size from site to site. There is no match rate you can hold up as a target
- Purchases don't drop out in a single place, so correcting one setting in the measurement plugin still leaves the gap standing
- Subscription renewals are processed without any customer action, so a tag that fires on the load of a purchase confirmation page never counts them
- They will not match exactly. Decide first which number answers which question: WooCommerce orders for the accounting close, the measurement side for traffic allocation
- What an allocation decision needs is not matching order counts but revenue per visit for each channel
1. Why the Match Rate Differs from Site to Site#
There is no going rate for the match rate. Even on the same plugin, the measurement path is a different thing on every site.
Once you notice the numbers don't agree, the first move is usually to inspect the GA4 integration plugin and the tag settings. That inspection alone almost never makes the gap disappear, because purchases don't drop out in a single place. Fix one, and the remaining places keep losing the same volume they lost before.
The condition under which GA4 counts a purchase is itself clear. The official procedure places a purchase event on the page where the purchase happens and adds that event to the confirmation page shown at the moment of purchase. The event code sits inside a <script> tag and fires when the page loads[1]. Read the other way around, it assumes the confirmation page is displayed and that its load runs all the way through.
WordPress does not settle on one shape that satisfies that assumption. The checkout implementation, how consent is collected, how the measurement plugins are arranged, whether subscriptions are handled at all — each is chosen separately on each site. The combination you choose becomes the measurement path, so the volume you lose splits as many ways as the combinations do. The distance between a site at 80% and a site at 50% comes from the difference in combination, not from how skillfully the settings were made.
This is why the same measurement plugin produces different results. What a plugin can send reaches only as far as what the checkout process hands outward. If the theme replaces the purchase confirmation page, or a payment extension carries its own completion routine, the purchase is invisible from where the plugin sits. The result is set by the position the plugin occupies, not by its quality.
The same phrase "they don't match" means something different when the commerce platform itself supplies the measurement path. Why GA4 revenue doesn't match Shopify covers that case for Shopify. This article covers the case where you assembled the path yourself.
2. The Order to Isolate Where Purchases Drop Out#
Start the inspection with whatever loses the most volume.
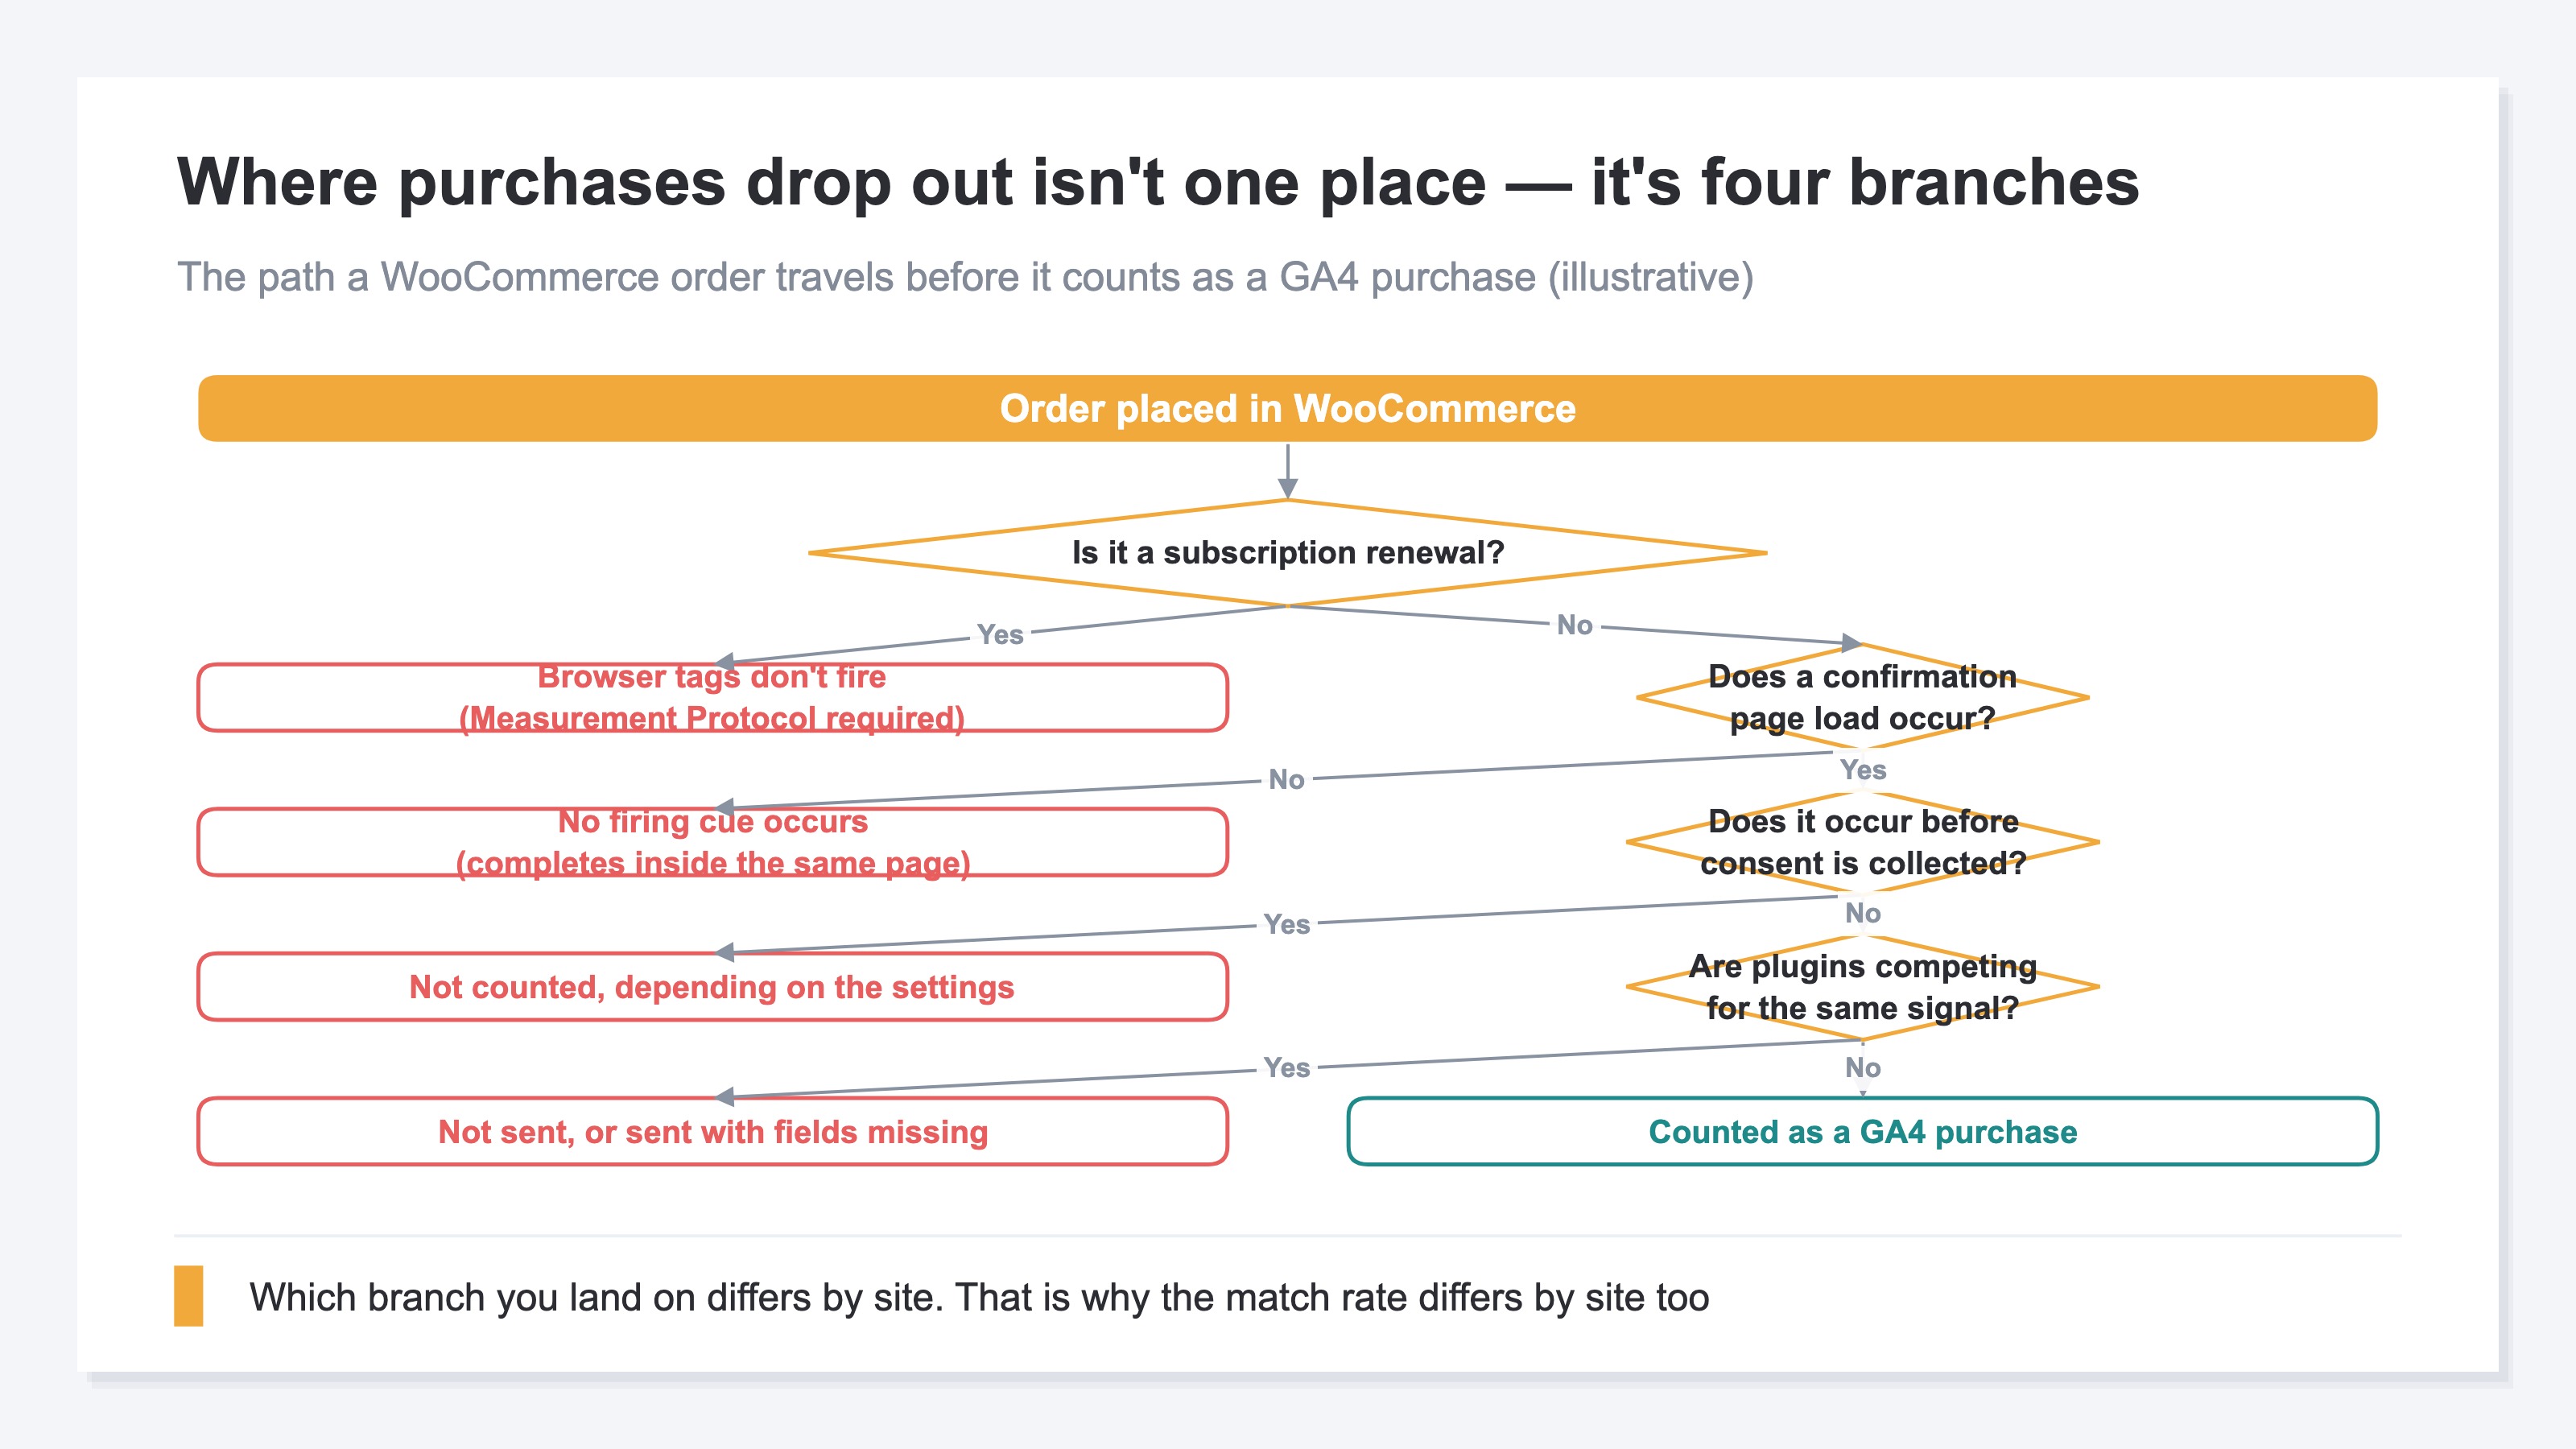
Separate subscription renewals first. WooCommerce renewals are processed without requiring any customer action[2]. No purchase flow happens in a browser, so a tag that fires on the load of a confirmation page never runs there. Sending these to GA4 means using the Measurement Protocol, a mechanism for sending events directly to GA4's servers over HTTP, provided for recording processing that happens server to server or offline[3]. That is development work, and even after it ships you still carry the job of checking for overlap with ordinary purchases. If you handle subscriptions, start by counting renewal orders separately from ordinary orders.
Suspect checkouts that never change pages. When purchase completion is processed inside the same page, the very cue that triggers the tag — a confirmation page load — never happens. Take five to ten orders by order ID and match them up, watching for whether one payment method in particular is the one missing. Starting from the total tells you nothing about which path is missing. Splitting by payment method narrows the candidates further. If only the methods that send the shopper to an external payment screen are missing, measurement most likely isn't running on the page they return to. If a steady share is missing regardless of method, the cause isn't the checkout implementation but consent or plugins, further down.
Check how consent is collected. How events that occur before consent is obtained get treated changes with the settings, and that reaches the purchase count too. Consent banners cut GA4 numbers covers the relationship between the settings and the figures.
Look at plugin conflicts last. When the measurement plugin, the theme and the payment extension compete for the same signal, events go unsent, or they get sent with the amount or the order ID missing. This turns into disabling one at a time and confirming reproduction, so limit it to the portion the three items above cannot explain.
Even after checking all four, the order count and the purchase count will not match. What isolation gets you is how much each path is losing, and no further.
3. They Never Match Exactly So Decide the Number You Judge By#
The gap that remains is not a defect. A GA4 purchase event is not a record of an order — it is a record of measurement that fired in a browser.
Returns and cancelled purchases, ad blocking, visits that don't permit measurement. These survive any rebuild of the path. Spend months lifting the match rate and the ceiling still isn't 100%. And through all those months, next month's ad budget still has to be decided.
Swap the question and the data you need swaps with it. "How close did we get the order counts to matching" is a question about measurement precision, and no amount of precision decides next month's allocation. Answering "which channel should we shift toward to grow revenue" requires sessions and revenue for each channel to sit inside the same aggregation over the same period.
Split the decision in two. The accounting close and order management treat WooCommerce orders as authoritative. Traffic allocation fixes on one measurement-side series and compares only within that series. Add and subtract across the two series and the volume you lost slips into the allocation decision.
Which series you use for allocation doesn't have to be chosen on precision alone. What has to be decided is that you keep using the same series every month. Refer to WooCommerce orders last month and GA4 purchases this month, and the effect of changing the allocation gets mixed into the same rise or fall as the effect of changing what you referred to. Fix on one series and the cause of a rise or fall narrows to the allocation you changed yourself.
When the gap points the other way — when the GA4 purchase count exceeds the WooCommerce order count — both the cause and the response are different. GA4 purchase counts higher than orders and purchases double-counted in GTM cover that. If you are comparing against revenue after returns have been deducted, part of the gap is how returns are booked; see GA4 revenue doesn't match the books for that.
RevenueScope solution
What you need here isn't the work of making order counts match — it's per-channel efficiency to decide allocation with. For any period you choose, RevenueScope shows revenue, sessions, RPS (revenue per visit), AOV (average revenue per order) and CVR, setting the current period against the prior one. The channel breakdown shows sessions, revenue and RPS for each channel. For periods where ad spend has been entered by year, month and channel, or imported in bulk from CSV, that channel's ad spend is shown alongside.
Measurement takes the form of placing a single tag, riding directly on the dataLayer purchase you already prepared for GA4 ecommerce. The path you assembled for GA4 doesn't have to be built a second time. Revenue attribution defaults to last-touch, assigning revenue to the channel passed through immediately before the purchase. You can switch to first-touch, linear or time-decay to compare. Revenue that cannot be assigned to a channel appears separately in the unattributed-revenue category. Figures are shown after visits judged to be bots have been excluded.
Fictional Store R's acquisition efficiency by channel (illustrative)
| Channel | Sessions | Revenue | RPS |
|---|---|---|---|
| Google search | 10,000 | ¥2,000,000 | ¥200 |
| 2,000 | ¥300,000 | ¥150 | |
| Social ads | 5,000 | ¥400,000 | ¥80 |
Note: the sample store that opens from the CTA is displayed with sample data, refreshed daily. The table above is separate from that — a teaching example built to isolate one reading only, the case where the top position does not change hands.
What the table is worth reading for is that no reordering has happened. Google search, first by sessions, is also first by RPS at ¥200. Email and social ads keep the same order in volume and in efficiency. What this settles is one thing: Google search comes off the list of candidates to cut in next month's allocation.
The next move is to concentrate your checking on that one channel. Because the current period and the prior-period comparison appear on the same screen, the month Google search's RPS falls by a fifth is the month you notice first. Catching the month your leader slips does more for next month's revenue than hunting for somewhere to add budget.
FAQ#
Frequently asked questions#
Q. How high does the match rate have to be to count as normal?
A. There is no benchmark you can set as a target. WordPress has the measurement path assembled site by site, so the volume lost splits site by site too. Rather than comparing against another company's match rate, watch whether your own site's match rate has stayed at the same level from last month to this month. If there's a month where it suddenly opened, the plugin you added or the setting you changed that month is the candidate.
Q. Do subscription renewals get counted in GA4?
A. Not if you're using browser tags as-is. WooCommerce renewals are processed without requiring any customer action[2], so a tag that fires on the load of a purchase confirmation page doesn't run. Sending processing that happens server to server or offline to GA4 means using the Measurement Protocol[3].
Q. If we switch to server-side measurement, will they match?
A. The losses shrink, but they won't match. Returns, cancelled purchases and visits that don't permit measurement remain. If you're considering the switch, don't set a match rate as the goal — decide first which path's losses you want to reduce.
Q. When the GA4 purchase count is higher than the order count, is it the same inspection?
A. It's a different inspection. On the over-counting side the causes are the same purchase being sent more than once, or a payment retry creating two orders. Purchases double-counted in GTM covers it.
Q. Will swapping the measurement plugin raise the match rate?
A. Swapping resolves only the portion that plugin was causing. In this article's order, that's the fourth item. If subscription renewals or a checkout that never changes pages is the cause, a different plugin loses the same volume. Before swapping, count renewals separately from ordinary orders and confirm which side the gap is coming from.
Summary#
Once you know the numbers don't agree, count subscription renewals separately before you head for the GA4 integration plugin's settings. Renewals are processed without requiring any customer action[2], so browser tags don't count them. After that, check in this order: checkouts that never change pages, how consent is collected, plugin conflicts. Working down from whatever loses the most volume cuts the number of rounds you spend checking.
On top of that, take an exact match off the goal list. A GA4 purchase event is not a record of an order — it's a record of measurement that fired in a browser. WooCommerce orders for the accounting close, measurement-side numbers for next month's ad allocation. Settle that assignment first and the allocation decision moves forward even with the gap still open. Put the basis for that decision on per-channel efficiency compared over the same period.
See which ads actually drive revenue, at a glance
Free up to 2,000 sessions/month, AI connection included. No credit card required. Up and running in 5 minutes.