The week after you put up a consent management banner, GA4 sessions and revenue both fell visibly. Before you decide you got a setting wrong somewhere, there is something to check. This article covers how to separate the part that went unmeasured from the part that genuinely did not sell, and which metric to judge the numbers by once the banner is live.
Contents
TL;DR#
-
The numbers come down because visits that did not consent fall outside what is measured
Under consent mode, how tags behave is restricted while consent has not been granted
-
Whether revenue actually fell is answered by matching against order data
Revenue on the cart and payment side is not affected by the consent banner
-
After the banner, judge on RPS and CVR rather than absolute sessions or revenue
Numerator and denominator leave the record for the same reason, so rates stay easier to compare across the change
1. The Drop Is Not a Bug but How Consent Banners Work#
A consent management banner asks visitors whether their data may be used for measurement and advertising purposes, and passes their answer to the tags on the site. GA4 receives that answer in the form of consent mode.
Consent mode has two implementations. Under basic consent mode, Google's tag itself is not loaded until consent is obtained, so measurement never starts. Under advanced consent mode, the tag loads and what it sends changes according to the consent state[1]. Which of the two you are on changes the shape of the decline.
If you are on advanced consent mode, Google fills in part of the non-consented visits through behavioral modeling built on data from consented visits. This applies to properties that meet the conditions, and for periods that fall below the thresholds no modeled data is shown[2]. The fill-in, in other words, is not a premise — it is a conditional feature. The wider shift in measurement, consent management included, is covered in EC measurement strategy for the third-party cookie era.
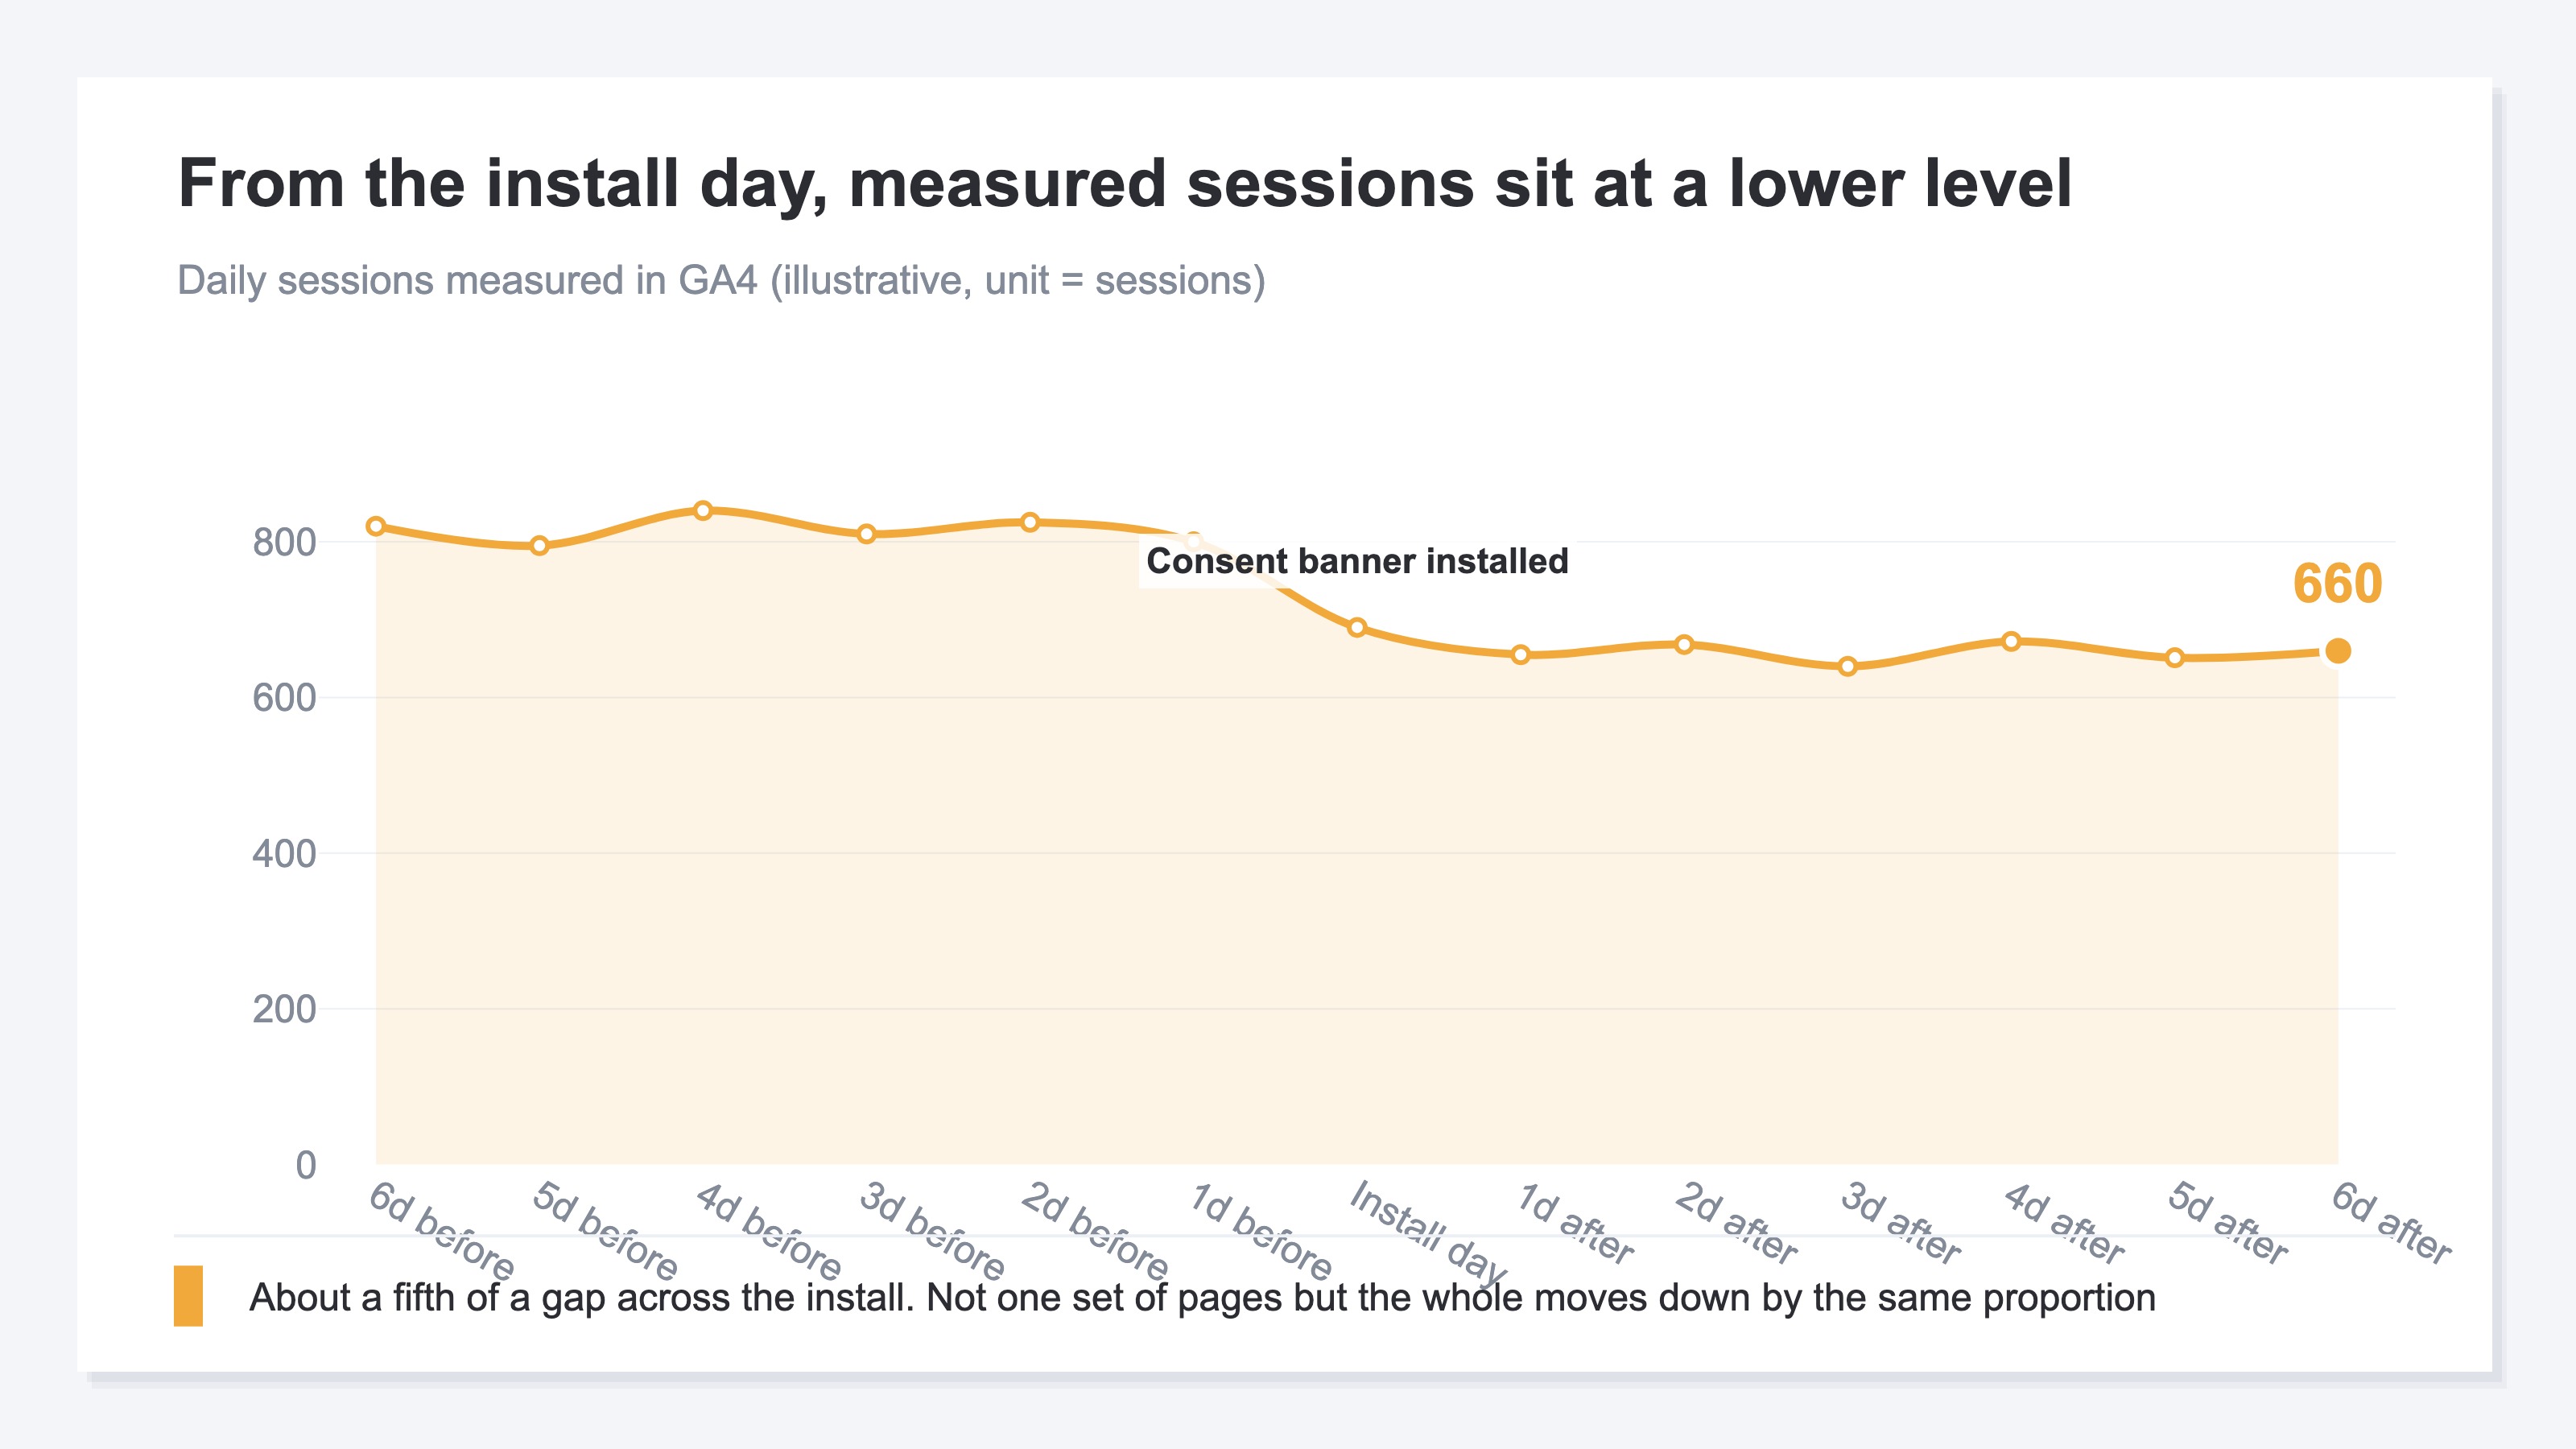
This shape of decline looks different from the shape you get when measurement itself is broken. With a tag installation mistake, the numbers approach zero from a given day onward, or one particular set of pages stops being recorded. With a consent banner, the whole moves to a level lower by a steady proportion. It is simply a state in which some visits are not measured. If you want to confirm quickly that tags are firing correctly, the inspection steps in Is your ad conversion tracking broken apply.
That changes what you check next. Rather than reviewing settings, it becomes your turn to confirm somewhere else whether actual revenue came down too.
2. Match Order Data to Estimate the Measurement Gap#
There are two records of revenue on hand that a consent banner does not touch.
One is the order data in the admin screen of your cart or payment provider. The fact that an order completed stays on record regardless of whether the visitor consented to measurement. The other is Google Search Console. That side records clicks and impressions on Google's search side[3], and is not swayed by how the tags on the site behave.
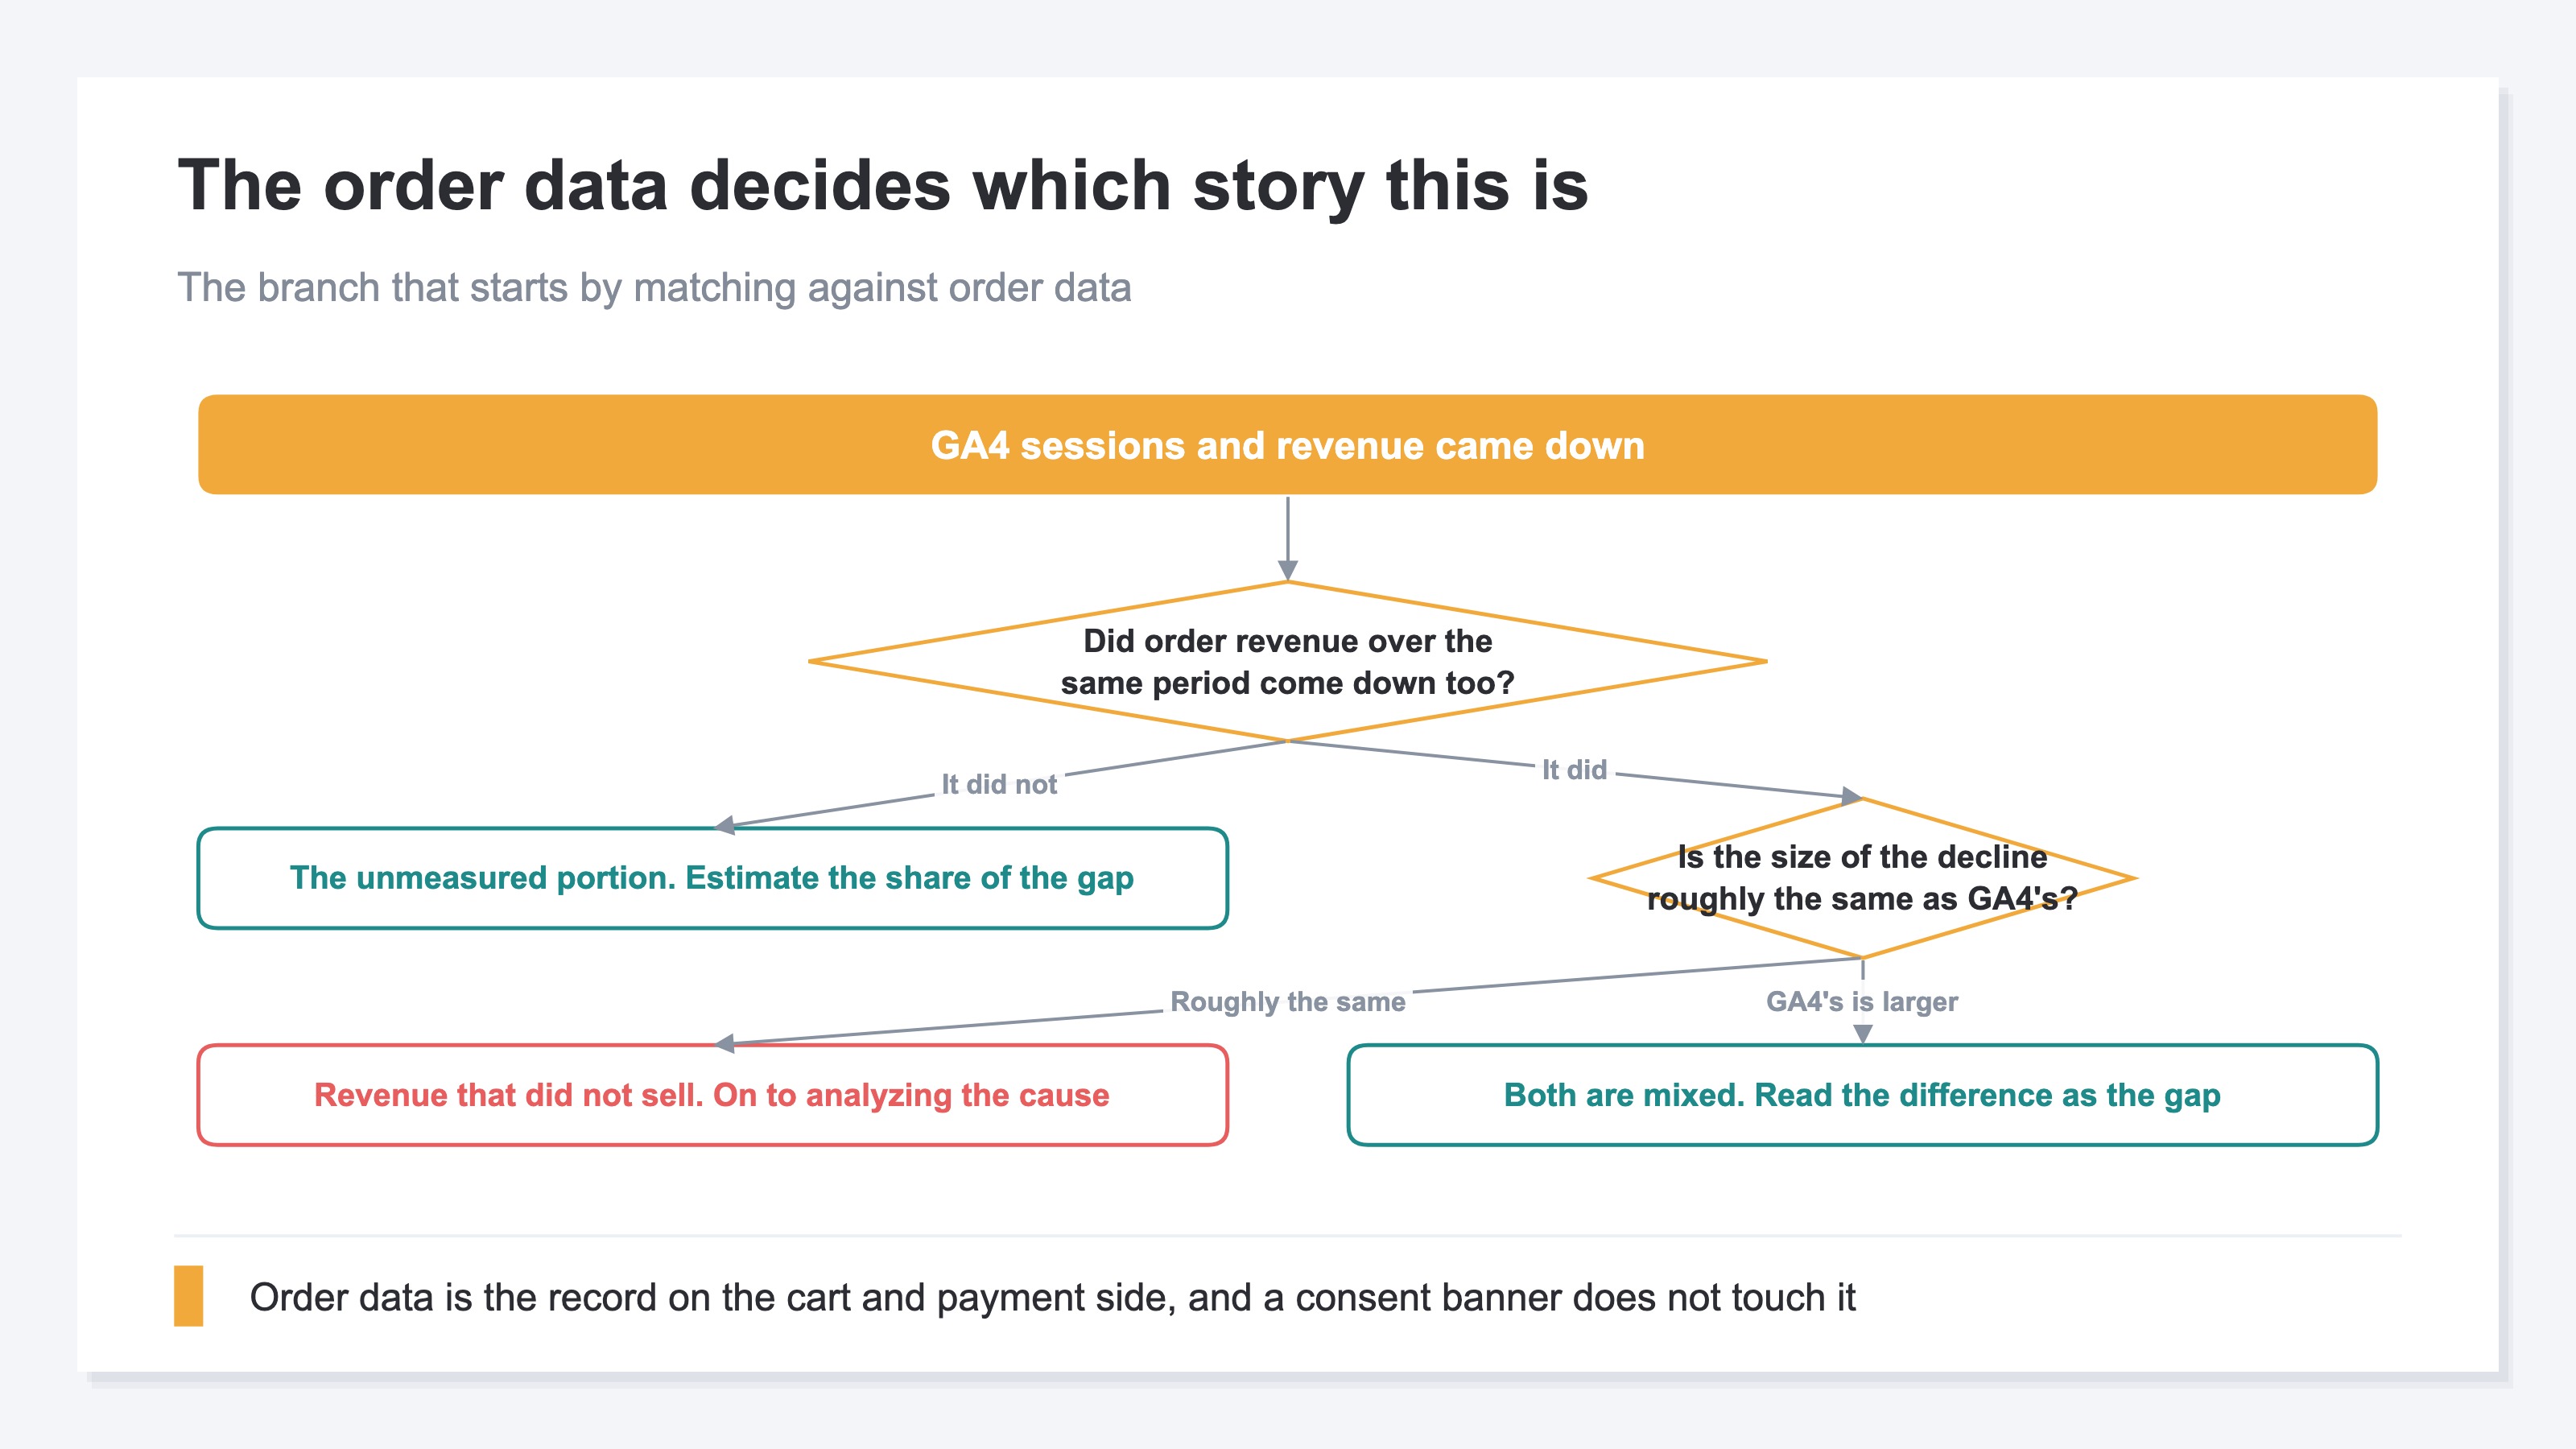
For the size of the measurement gap, the order data alone gets you an estimate in one pass. Match order revenue and GA4 revenue over the same period, and work out what share of order revenue GA4's revenue amounts to. If it comes to 80%, the remaining 20% is the part that went unmeasured.
Note that GA4 revenue and cart-side revenue diverge by some margin even with no consent banner in place. The reasons and what to do about them are collected in Why GA4 revenue doesn't match Shopify. What you want to see here is whether that divergence widened at the install date.
If order revenue is roughly unchanged from before and only GA4 revenue is down, what fell is the measured portion. There is no reason to stop ads or roll back what you launched. If order revenue is down by the same amount, this is not a measurement story — it becomes a matter of chasing revenue that genuinely did not sell. If GA4's decline alone is the larger one, both are mixed together. You read the difference as the portion that went unmeasured.
The share you work out once becomes the baseline for reading GA4's numbers from next month on. When you compare against results from before the banner, you judge after adding that share back.
3. Read Rates Not Absolute Numbers After the Banner#
The measurement gap carries on indefinitely after the install. As long as a steady proportion of visitors decline consent every day, sessions and revenue both keep being recorded at a level below reality. They are no longer numbers you can compare plainly against the month before the banner.
There are, though, metrics that keep their comparability. Rates such as RPS (revenue per session) and CVR. A visit that did not consent leaves the record as a session and as revenue at the same time. Because numerator and denominator leave together, the result of the division moves far less than the absolute numbers do.
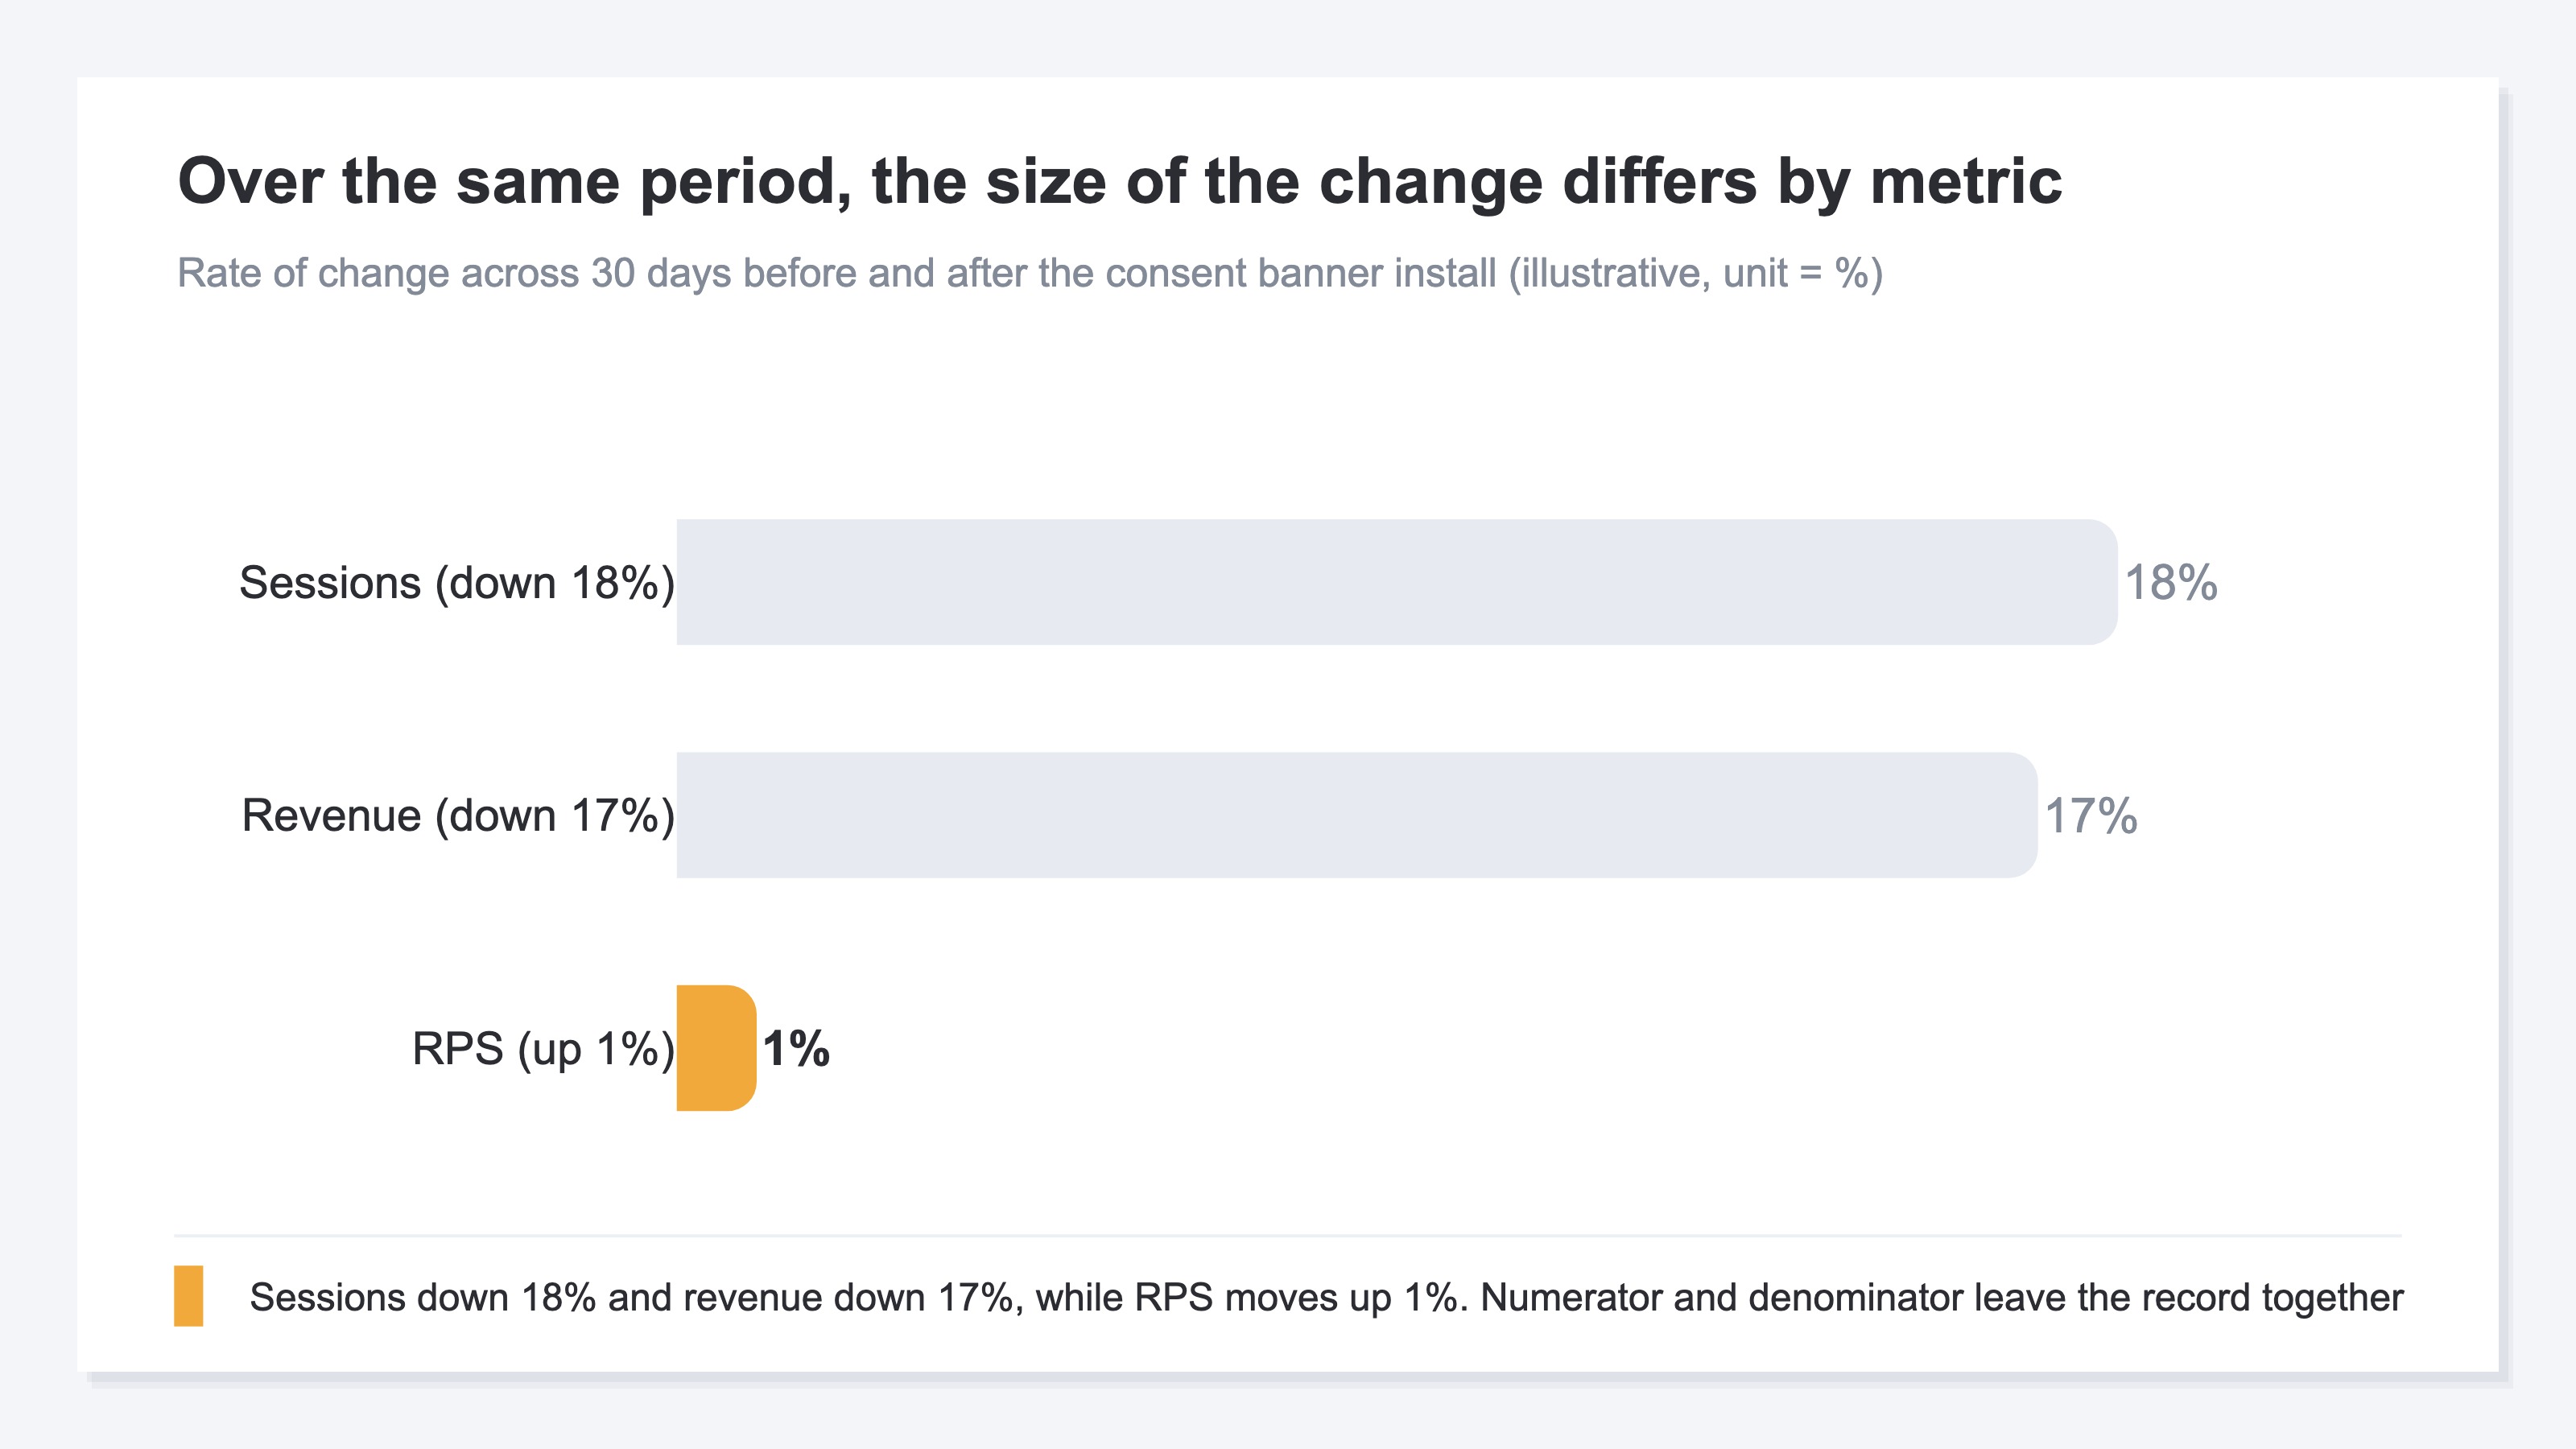
That said, rates are not perfectly preserved. If people who consent and people who do not buy differently, the rate moves as well. Even so, when absolute numbers fall by 20% while the rate moves by 1%, the rate is the one you can build a decision on.
And the data behind that decision has a weak point. Under the basic implementation, non-consented visits leave no measured record at all. Even in periods where the advanced implementation meets the modeling conditions, what appears in the reports is the estimated fill-in — the measurement of who saw what and when does not come back. What is not displayed will not announce itself as a shortfall no matter how carefully you read the screen. The people who notice are the ones watching both the change in rates and the order data that sits outside consent. How channel attribution breaks down is collected in GA4 (not set) and (other).
RevenueScope solution
RevenueScope displays RPS, AOV and CVR as headline metrics on the first screen. Sessions and revenue appear on the same screen, but the rates do not get pushed to the back.
Headline metrics for each period come with a prior-period comparison and a daily trend. Specify a period that spans the day you installed the consent banner, and you can confirm in one pass which day the level changed and how far the size of the change differs from metric to metric. Ask again over a different period and it becomes a comparison of a period entirely before the install against a period entirely after it. Comparing before and after the install with rates in the lead role is where RevenueScope ends; consent mode's settings themselves are handled on the GA4 and tag side.
Fictional Store A's channel breakdown, asked of RevenueScope (illustrative)
| Channel | Sessions | Revenue | RPS |
|---|---|---|---|
| Google search | 4,200 | ¥520,000 | ¥124 |
| Direct | 2,600 | ¥260,000 | ¥100 |
| Meta | 1,900 | ¥170,000 | ¥89 |
| Yahoo! search | 800 | ¥90,000 | ¥113 |
Note: this consent-banner channel table is an illustrative example. The actual demo screen carries the sample store's sample data, refreshed daily, so neither the lineup of channels nor the figures will match what is shown here.
Google search, with the most sessions, also comes top on RPS. There is little that is newly learned from this table. What can be read off it is one point: after the banner went up, the revenue per visit on this row has held. That is where the grounds are built to suspect an actual change rather than a measurement gap the month RPS on this row falls. How to read RPS itself is covered in What RPS is.
FAQ#
Frequently asked questions#
Q. Do GA4 numbers always come down when you install a consent banner?
A. How far they come down varies widely with the implementation and how the banner is presented, so there is no across-the-board benchmark. Matching your own order data against GA4 revenue over the same period, and working out the share for your own store, is the reliable route.
Q. Does behavioral modeling bring the original numbers back?
A. Behavioral modeling does not restore the original measured totals. It is a fill-in applied to properties that meet the conditions, and for periods that fall below the thresholds no modeled data is shown[2]. Even in periods where the fill-in is applied, the measured values for non-consented visits do not come back.
Q. If we raise the consent rate, does the measurement gap disappear?
A. A higher consent rate makes the gap smaller, but it does not reach zero. Reviewing the wording and placement of the banner is worth doing. That said, once you have moved the basis for decisions onto rates, comparisons carry on even when the consent rate shifts somewhat.
Summary#
GA4 numbers coming down after a consent management banner is installed happens because visits that did not consent fall outside what is measured. The first thing to do in that state is not to review settings but to match against order data. If order revenue has not changed, what fell is the measured portion, and there is no reason to roll back what you launched.
After the install, judge on RPS and CVR rather than absolute sessions or revenue. Because numerator and denominator leave the record together, rates stay easier to compare across the change. Work out the share of the measurement gap once and hold it as a baseline, and the numbers from next month on stay readable.
See which ads actually drive revenue, at a glance
Free up to 5,000 sessions/month, AI connection included. No credit card required. Up and running in 5 minutes.