A product that moves hundreds of units a month on an EC marketplace moves in single digits on your own store. When the product and the price are the same on both, the difference sits outside the product — in how the places that generate visits are built. Before rewriting the product page, find out which entrance, which channel, is producing buyers.
Contents
TL;DR#
- The same four products do 310 orders a month on the marketplace and 20 on the store. When the selling order matches, the gap is not product strength but how the entrance is built
- On a marketplace, the marketplace owns the entrance. On your own store you build the entrances yourself — social, search, ads, email — and people arrive through each for a different reason
- Pull revenue per session for each entrance and the entrance carrying the most sessions can turn out to be the one that earns the least
- In one fictional store, social carried 620 sessions at ¥12 while Google search carried 340 at ¥226. The leader in volume and the leader in earning power are different entrances
- The top two entrances sat 3% apart on RPS. The deciding factor was not efficiency but the sessions search could still be expected to add
1. Three Months of Product Page Edits Did Not Move Orders#
What was decided three months ago was to rebuild the product pages. The photos were reshot on white, sizes and materials were added to the copy, and a post-purchase review request email was set up. All of the work was finished. Orders on the store went from 18 a month to 20.
The same four products sell 310 units a month on the marketplace.
What ran down over those three months was not inventory but the time available to find the cause. And one thing had been left untouched: the channel visitors arrived through, and the share of those visitors who bought. Without looking there, the cause had already been declared to be the product page.
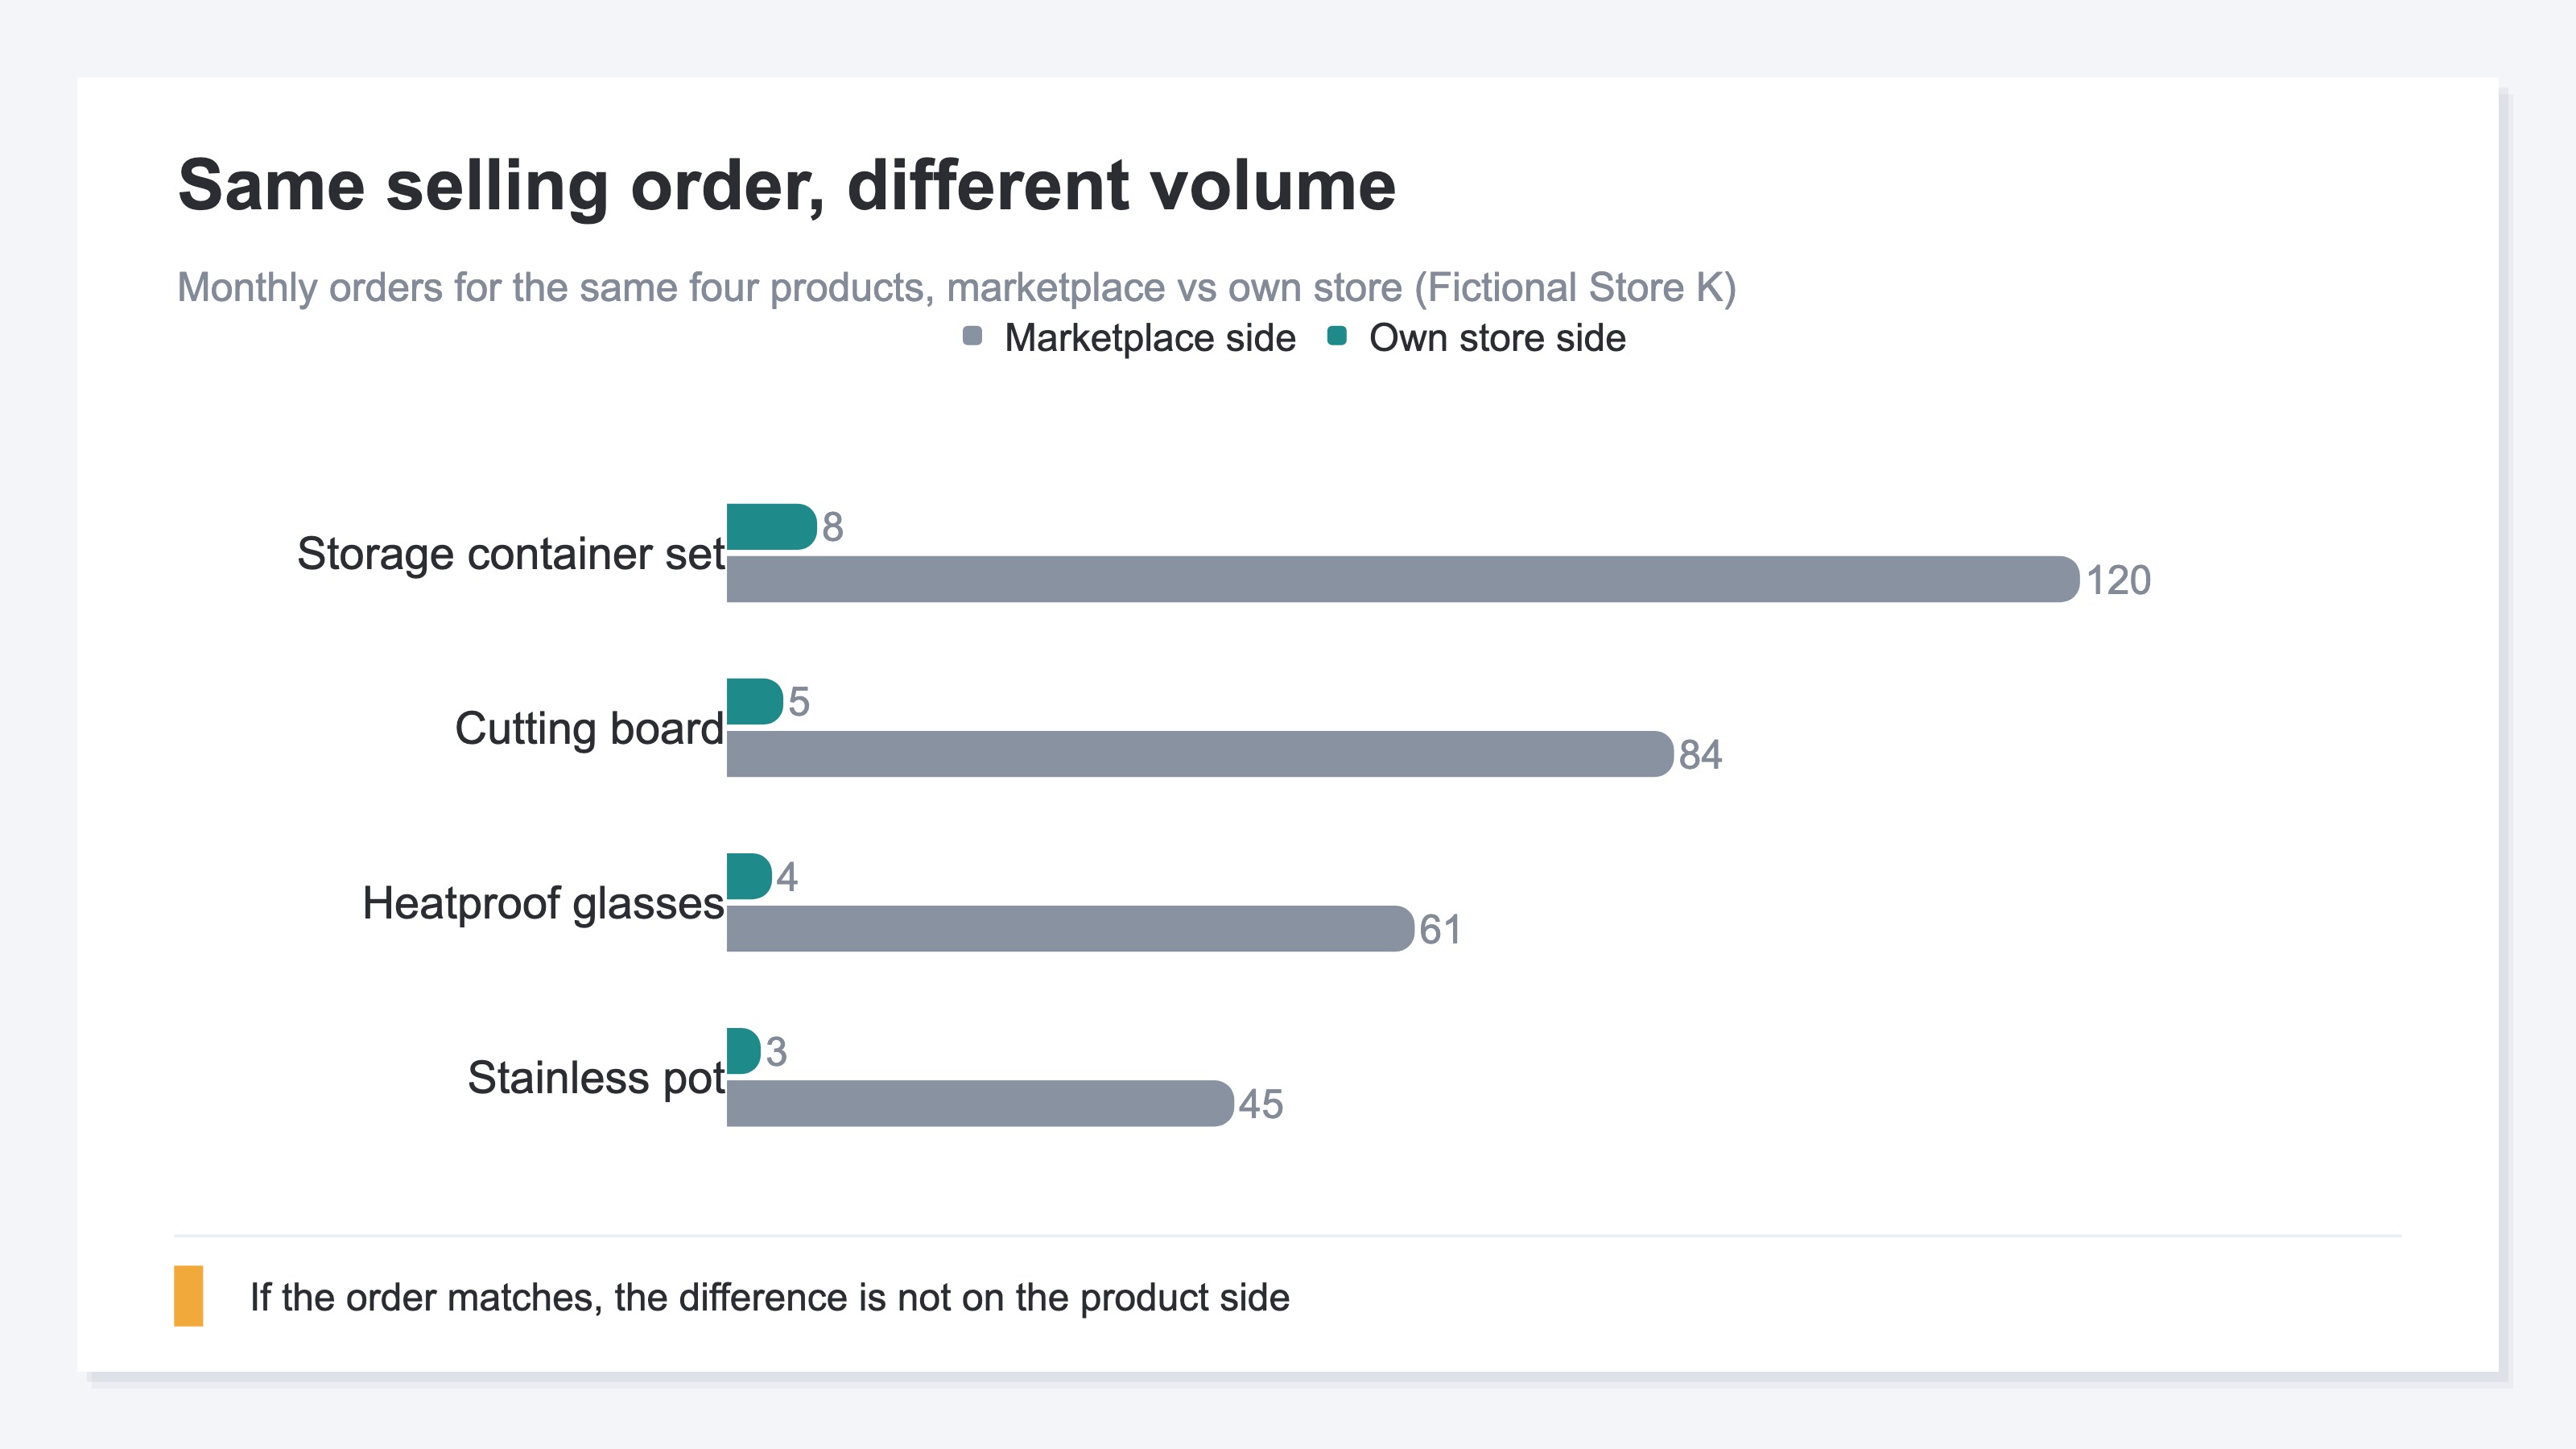
In Fictional Store K's figures, the monthly order counts for the same four products line up like this. The storage container set does 120 on the marketplace and 8 on the store. The wooden cutting board, 84 and 5. The heatproof glasses, 61 and 4. The stainless pot, 45 and 3. Totalled, that is 310 against 20 — orders on the store come to about one-fifteenth of the marketplace.
What is worth noticing is that the selling order matches. The storage container set, the best seller on the marketplace, is also first on the store. Same order, and only the overall volume divided by fifteen. When the shape looks like this, the product is not what to suspect.
If product strength were the cause, the same products would struggle the same way on the marketplace side. Put the same items at the same price in both places and see one of them off by an order of magnitude in volume, and the difference lies outside the product.
2. Marketplaces and Your Own Store Differ at the Entrance#
What creates the gap is who prepares the entrance that brings traffic.
Open a shop on a marketplace — Rakuten Ichiba, Yahoo! Shopping, Amazon — and the entrance belongs to the marketplace. The buyer opens the marketplace, types a product name into its search box and picks from a list. What the seller builds is the product page; the route that carries people to it lives inside the marketplace's machinery. That is why work spent tidying the product page tends to come back as a result.
Your own store is the opposite. You build the entrances yourself. Social posts, Google search, ads, email, a URL printed on packaging or a business card. People arriving through each of those arrive for different reasons. Someone who saw a photo on social and opened the page is not necessarily there on the same impulse as someone who searched the product name. Visits of different natures land on the same product page, mixed together.
What can be stated firmly stops at the entrances differing in nature. That people arriving from marketplace search have stronger purchase intent is a comparison published statistics do not confirm. The way to confirm it is to pull revenue per session for each entrance on your own store. That method is covered in a later section.
Some background figures are worth holding onto. According to the Ministry of Economy, Trade and Industry, Japan's domestic BtoC e-commerce market was ¥26.1 trillion in 2024, up 5.1% from ¥24.8 trillion the year before[1]. The market is not shrinking. Blaming the e-commerce market itself for orders not coming in stops making sense here.
The same survey also reports the e-commerce penetration rate. For BtoC e-commerce it stands at 9.8%, up 0.4 points year on year[2]. That 9.8% is an average across physical goods, though, and the spread between categories is wide. Books, video and music software read 56.45%. Home appliances, AV equipment, PCs and peripherals read 43.03%. Household goods, furniture and interior read 32.58%[2]. Even between those three categories, the degree to which buying happens online differs by nearly a factor of two. The point being that no single average settles whether a store succeeds.
Note also that this survey does not break out marketplaces versus own stores. It is no basis for the claim that things sell on marketplaces, so what it supports here is only two points: the market is growing, and the starting conditions differ by category. If neither the market nor the category explains it, what remains is the data on your own site.
3. Break Down the Shortfall and It Stops Being About the Product#
The reason orders do not come in splits into how many people arrived and what share of them bought.
Say the store took 20 orders last month. Those 20 are sessions multiplied by the share that reached a purchase. Which of the two is short changes what to do. If people are short, it is a traffic question. If the share is low, it is a product page or cart question. Deciding to spend three months on product pages was deciding it was the latter.
Do the breakdown entrance by entrance. Producing one share for the whole site only gives an average of visits with different natures mixed into it.
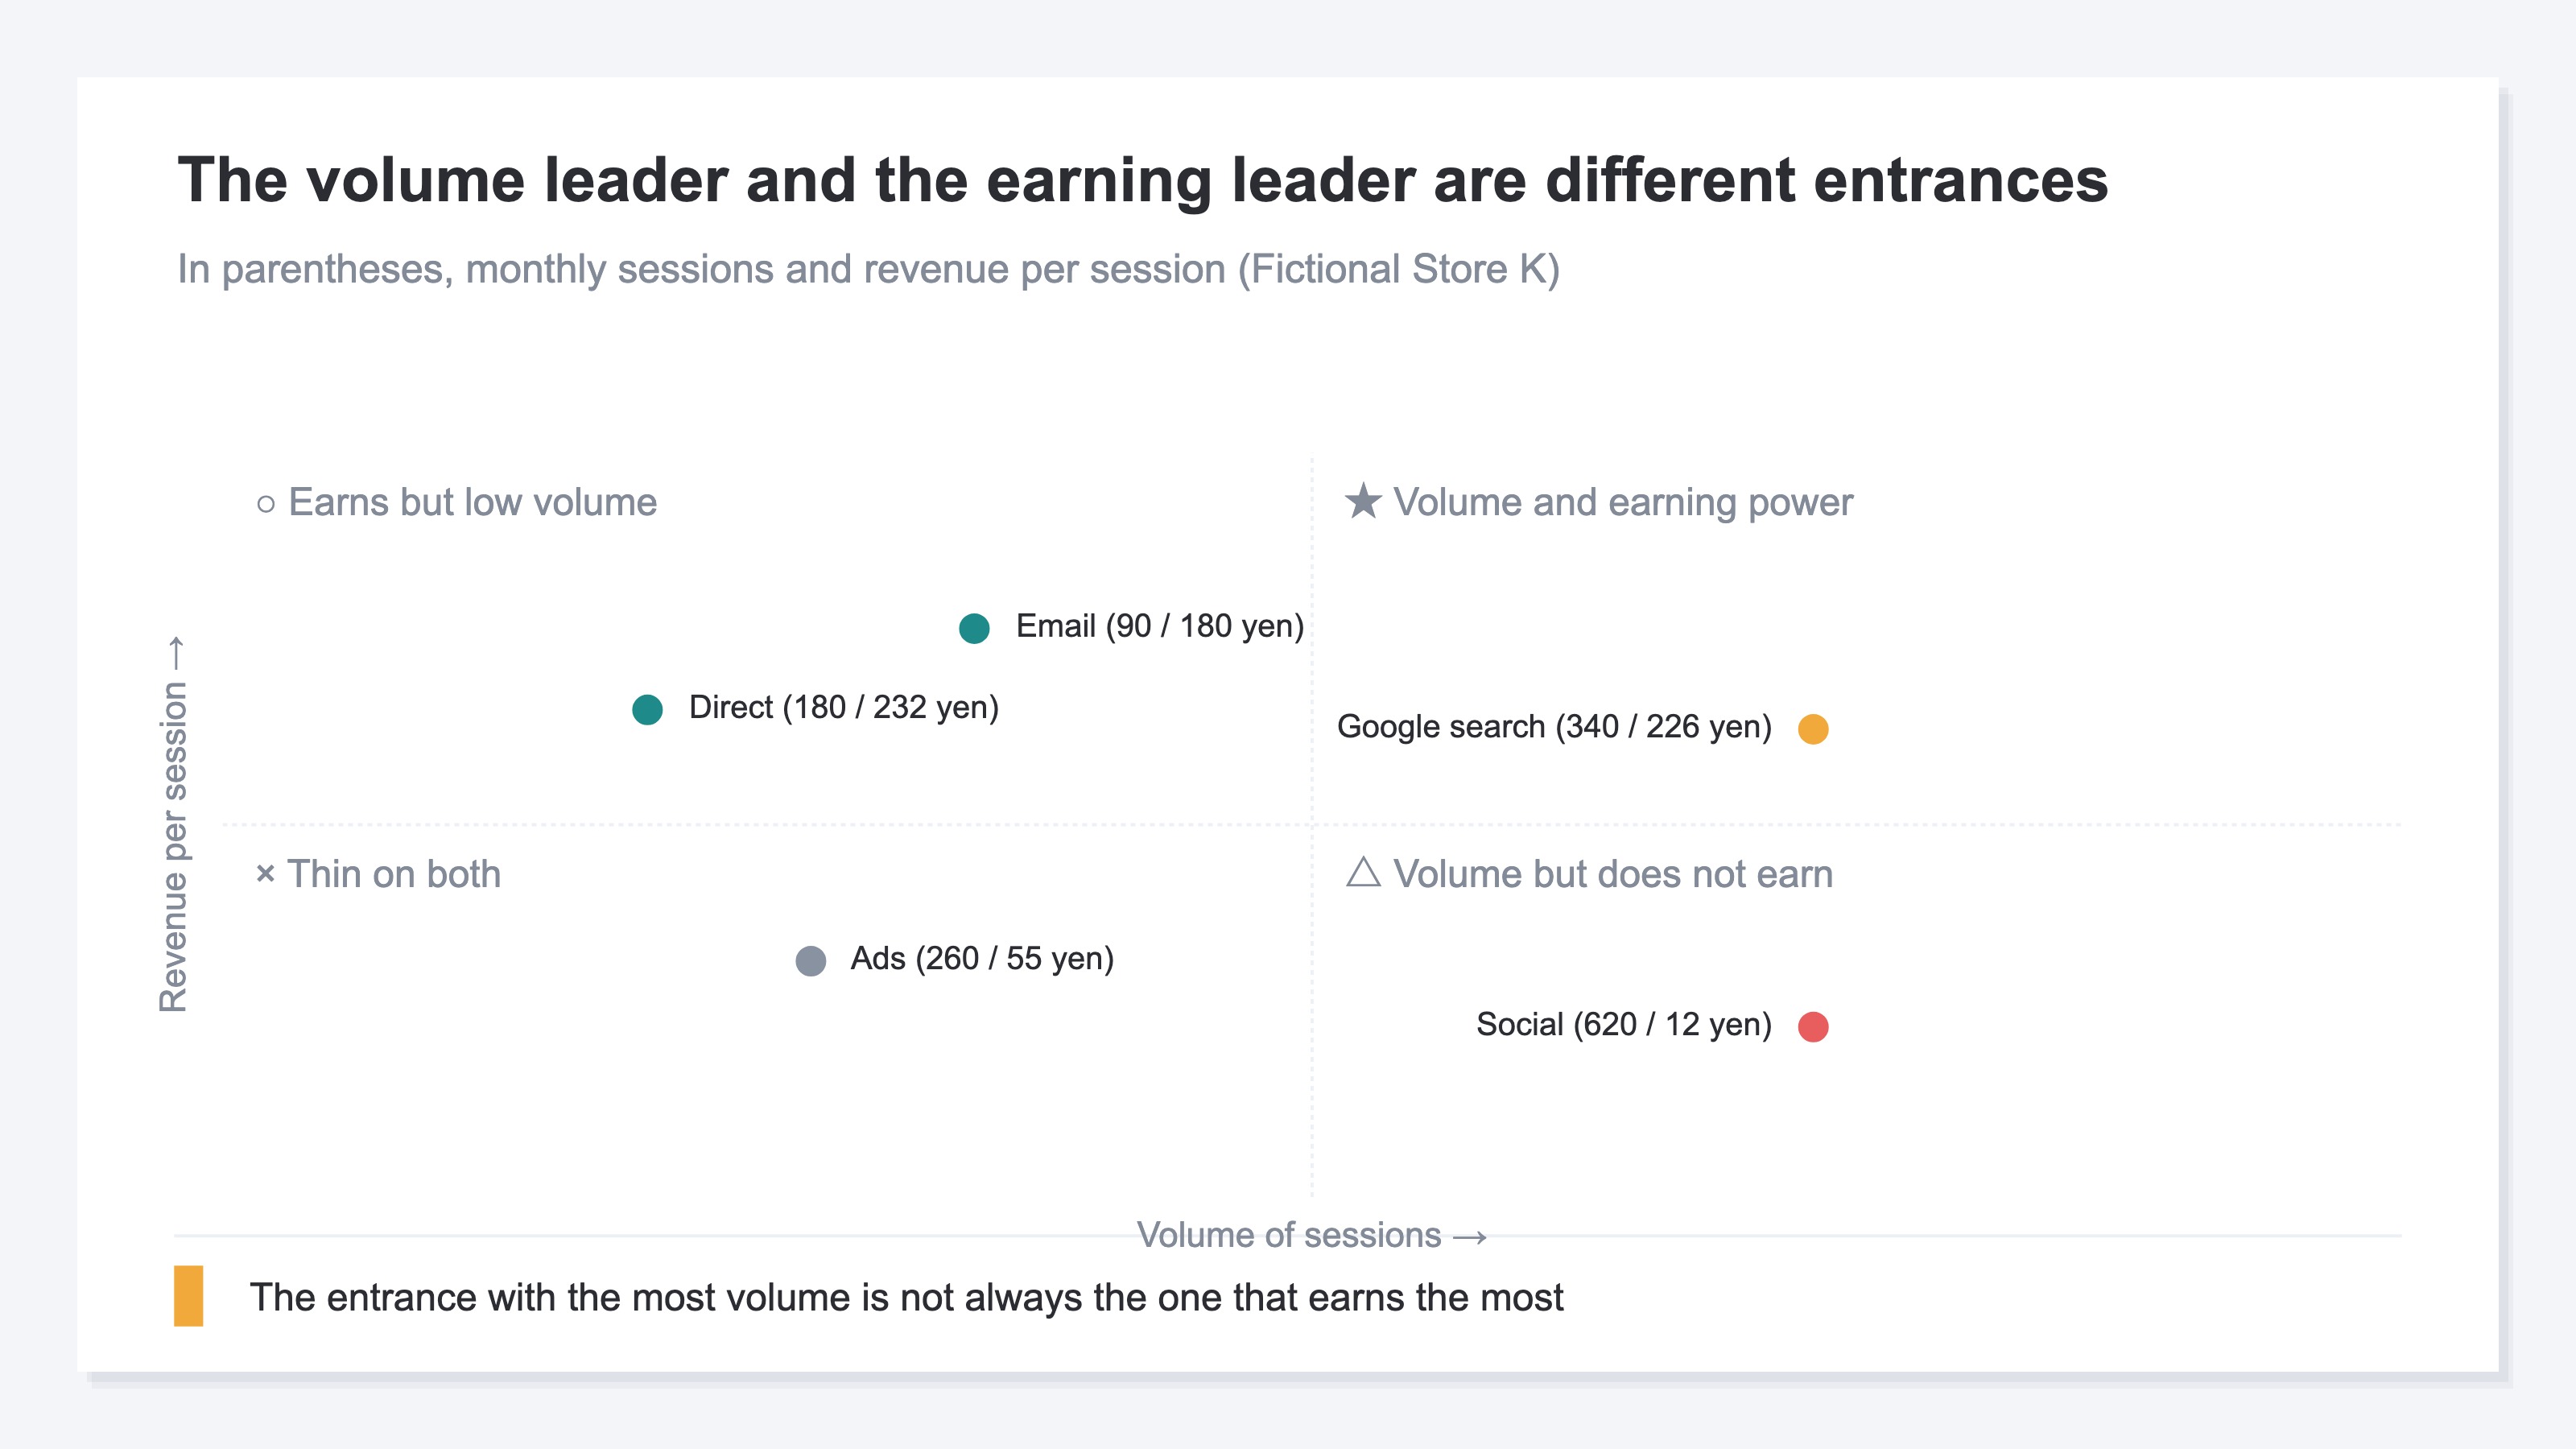
In Fictional Store K's figures, putting the store's entrances on two axes looks like this. The horizontal axis is the volume of sessions, the vertical is revenue per session. That revenue per session is what we call RPS (revenue per session — how much one visit earned).
Social carries 620 sessions at an RPS of ¥12. First in volume, last in earning power. Ads carry 260 sessions at ¥55. Google search carries 340 at ¥226. Direct carries 180 at ¥232. Email carries 90 at ¥180. The leader in volume and the leader in earning power are different entrances.
The total is 1,490 sessions and about ¥157,000 in revenue. With 20 orders, CVR (the share of sessions that reached a purchase) comes to 1.3%. What is doing the work here is the mix. Social generates four in ten of all sessions, yet contributes ¥7,000 in revenue — under 5% of the total. Direct and Google search, the two of them, make 75% of the revenue.
Once that shape is visible, the product page argument moves to the back. Four in ten of the visits arriving come from an entrance that barely connects to revenue. However well the product page is tidied, the reason those four in ten came does not change. Three months turning 18 into 20 was not the result of editing badly; it was the result of the pool receiving those edits staying the same.
GA4 will also show sessions and revenue by channel. What is missing is the step after: how much one session earned is not prepared anywhere in the channel list. You end up pulling out the two pieces — sessions and revenue — dividing them yourself for each entrance, and redoing the same work every time the month turns over. The metric itself and how to produce it are laid out in what RPS is.
The marketplace's admin console does not hold the materials for that calculation. Traffic to your own store is not included in the marketplace's screens. That is a fact of how the systems are arranged, not a comparison of which console is better. It is close in structure to the case where the same order is counted differently once the counting party changes; why the numbers disagree is covered in affiliate results that do not match.
There is also the question of timing. At a scale of 20 orders, one more order reorders the entrances. Deciding superiority by share over that period leaves you with a conclusion that does not survive into the next month. What can be decided is volume and growth. Where to draw the line is written up in analysing a low-traffic store. For an entrance with hundreds of sessions accumulated, as in this article's example, a difference in the order of magnitude of RPS is readable.
4. Shift Traffic Toward the Entrance Buyers Come Through#
The conclusion is not to stop posting on social. Those 620 sessions will be generated again next month. Stop, and the 620 disappear. What to do is reassign the roles of the entrances.
An entrance with high RPS is a route buyers are travelling. Concentrate traffic there. Direct at ¥232 and Google search at ¥226 differ from social's ¥12 by nearly 20 times. If you are adding the same 100 sessions, which one you want them added to is settled.
An entrance with low RPS and high volume gets the awareness role. Someone who learned about a product on social may not buy that day and may come back later by searching the product name. In that case, the last entrance clicked is Google search. So social's ¥7,000 in revenue does not mean social has no value. What it means is only that social should not be judged on the same basis as the entrance that takes orders. Choosing which entrance to grow from a full list is covered in 12 EC acquisition channels compared. This article is the other side of that: ranking the entrances you already have.
So between the top two, direct and Google search, which one do you shift toward?
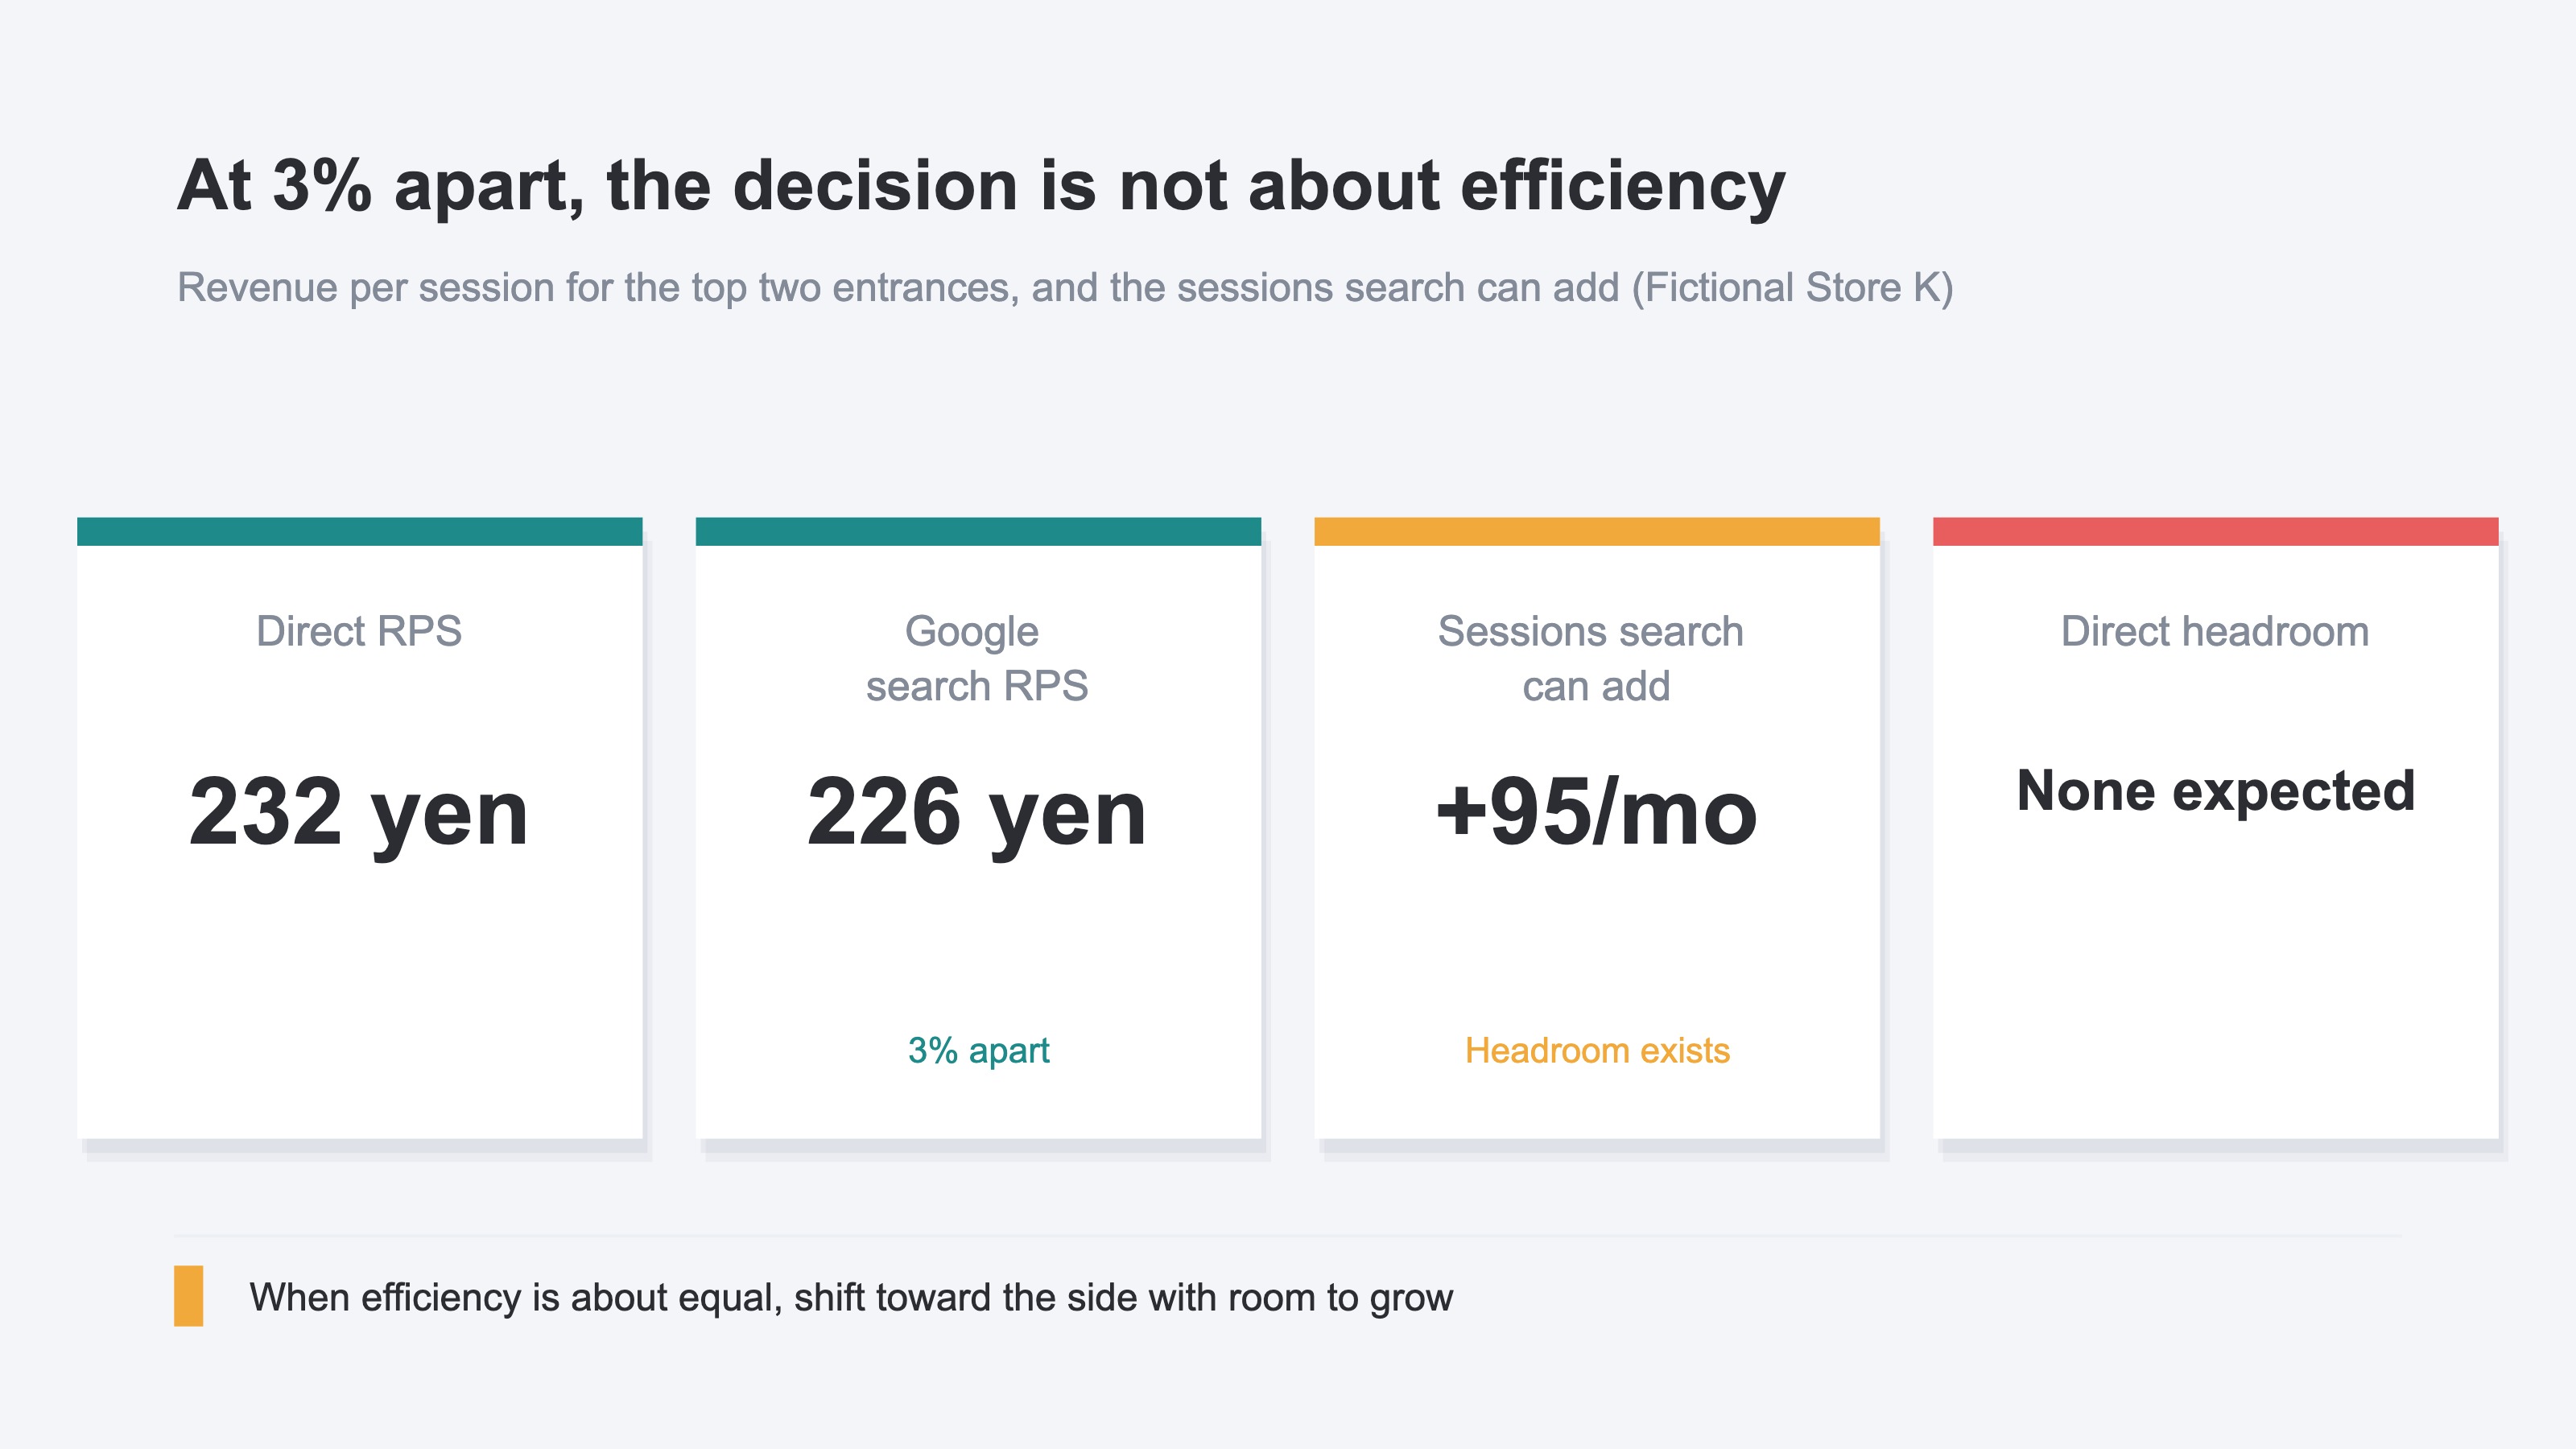
RPS reads ¥232 and ¥226 — a difference of 3%. Add 100 sessions and the difference in revenue comes to about ¥600. Neither choice changes the outcome.
The deciding factor was outside the table: the size of the headroom you can grow into. Google search has keywords that show at positions 4 through 20 in the results and are not taking the clicks. In this example, that amounts to headroom of 95 sessions a month. Growing direct would need a separate initiative — ads, or URLs printed on paper — and no figure stands up for it in the form of search headroom. With the race that close, start on the side where you already know how to grow.
Check where the deciding materials sit and this stops being a story about missing data. Which products sell is already answered in the marketplace's order data. Which entrance produced each visitor to the store is already recorded on the store's side. The two simply sit in separate places. What is missing is not data but a mechanism on the store's side that ties entrances to revenue and rebuilds it in the same shape every time the month turns over.
RevenueScope solution
The ranking of the entrances that produce buyers is settled by the channel breakdown. RevenueScope measures revenue through a single line of tag placed on your own site and brings sessions, revenue and RPS for each entrance onto one screen. Visits judged to be automated are excluded from the metrics, and the excluded count is disclosed. If automated access had been mixed into social's sessions, the entrances can be compared on figures with that removed.
Revenue that ties to no entrance is stated on its own row as unattributed. It is what remains after subtracting the attributed portion from total purchase revenue, which saves you from describing the whole business using only the revenue shown in the entrance list.
Open an entrance's row and revenue, RPS, AOV (average revenue per order) and CVR appear for each campaign inside it. Within social, if links carry separate parameters, visits from the profile URL and visits from a specific post land on separate rows. Visits without separate parameters are grouped into a single row.
Connect RevenueScope to ChatGPT or Claude and the AI reads your store's data directly and answers. No difficult setup or SQL. Ask which entrance earns the most per session and the answer comes back in this form. Written out for Fictional Store K, it looks like this.
| Entrance | Sessions | Revenue | RPS |
|---|---|---|---|
| Social | 620 | ¥7,000 | ¥12 |
| Google search | 340 | ¥77,000 | ¥226 |
| Ads | 260 | ¥14,000 | ¥55 |
| Direct | 180 | ¥42,000 | ¥232 |
| 90 | ¥16,000 | ¥180 |
Note: what the screen behind the button reads is the sample store's sample data, refreshed daily. The table above is a teaching example built on Fictional Store K (illustrative), so the screen shows different entrance names and different amounts.
Read down by session count and social comes first, yet it is last on RPS. The top two, direct and Google search, read ¥232 and ¥226 — inside this table they do not separate.
The deciding factor sits on a different screen. For sites with Google Search Console connected, pages that can be grown through search are listed in order of the sessions they can be expected to add. What qualifies are keywords sitting at positions 4 through 20 where lifting the position makes more clicks plausible. Open a row and the keyword appears along with the monthly gain expected if it were lifted to a target position. The granularity differs from the entrance list — this one is per page. When the ranking of entrances comes out close, the next move is decided on the expected-gain side.
FAQ#
Frequently asked questions#
Q. Should we drop the marketplace and concentrate on our own store?
A. That is the wrong order. There is no reason to close the entrance that is selling first. Consider the allocation once the entrance producing buyers on your own store has been identified and traffic to it has accumulated. The materials for that judgement are sessions and RPS for each entrance.
Q. Followers on social keep growing but no revenue follows. Should we stop?
A. An entrance with low RPS takes the awareness role rather than the order-taking role. That said, while a month's pool is thin, RPS moves on a single order. Until dozens of orders have accumulated, judge on volume and growth.
Q. Can we compare ads against the other entrances on ROAS?
A. For periods where ad spend has been imported, ROAS — revenue measured on your own site divided by ad spend — is calculated by channel. For periods without ad spend imported, that metric is not produced. In that case use RPS to compare how much one session earns.
Q. So the product page work was pointless?
A. It has a point. It is a question of order. Edit after you know which entrance buyers are travelling and the same work reaches revenue. How to lift CVR and AOV together is laid out in raising CVR and AOV at the same time. The reason to confirm the entrance first is that it determines the pool that receives the edits.
Summary#
When a product that sells on marketplaces does not sell on your own store, the gap is not product strength but how the entrance is built. On a marketplace the marketplace owns the entrance; on your own store you build the entrances yourself. Social, search, ads and email each bring people for different reasons. Visits of different natures land on the same product page, mixed together.
One background figure. Japan's domestic BtoC e-commerce market was ¥26.1 trillion in 2024, up 5.1% year on year (Ministry of Economy, Trade and Industry, "FY2024 E-Commerce Market Survey", published 2025)[1]. The market is growing. Blaming the market for a lack of sales does not hold.
The order to act in goes like this. Produce sessions and RPS for each entrance. If the leader in volume and the leader in earning power differ, shift traffic toward the earning side. If the top two are close, start on the side with more headroom to grow. Product page work comes after that order.
The next move is one thing. This week, do not open the product pages — produce revenue per session for each entrance on your own store. If the entrance that came last is where most of your traffic time has been going, next month's allocation is already decided.
See which ads actually drive revenue, at a glance
Free up to 5,000 sessions/month, AI connection included. No credit card required. Up and running in 5 minutes.