Rankings went up and impressions followed. If revenue still hasn't moved, the cause sits in the keywords you have been collecting. The people typing those keywords are not visitors weighing a purchase. This article works through it in order: confirm the added traffic is human visits, sort the keywords by purchase intent, and then choose again which keywords to prioritize.
Contents
TL;DR#
- When rankings and impressions are both climbing and revenue is not, what separates them is whether the people searching those keywords are buyers
- The first thing to look at is whether the increase is human visits. Judge it from how the traffic behaves and exclude it, and every decision after that sits on a bot-excluded base
- The same first position holds two different things. A visit that takes an answer and leaves behaves differently from a visit checking conditions before buying. Sort by whether the visits a keyword brought reached a purchase, not by how the keyword looks
- The move is a swap in which keywords get your hours over the next 90 days. Shift to keywords that already reach a purchase and still have room left in the rankings
1. The Steps Are Right and Only the Order Differs#
Add articles, tidy the internal links, lift the rankings. That sequence is right. Only the place it starts is different.
The procedure most EC sites put together is nearly the same. List the keywords that have search demand and prepare articles for them. Tidy the internal links, then rewrite the pages that do not climb all the way. Check rankings and impressions at the end. Not one of those steps is wrong.
Run them in that order, though, and the numbers you check last overturn the decision you made first. Impressions, position and clicks in Google Search Console mean the number of times the site appeared in search results, the average position of those appearances, and the number of times they turned into a visit[1]. All three are climbing. If revenue still has not moved, what you end up revisiting is how you chose which articles to add. And that revisit arrives after three months of production capacity have already been spent.
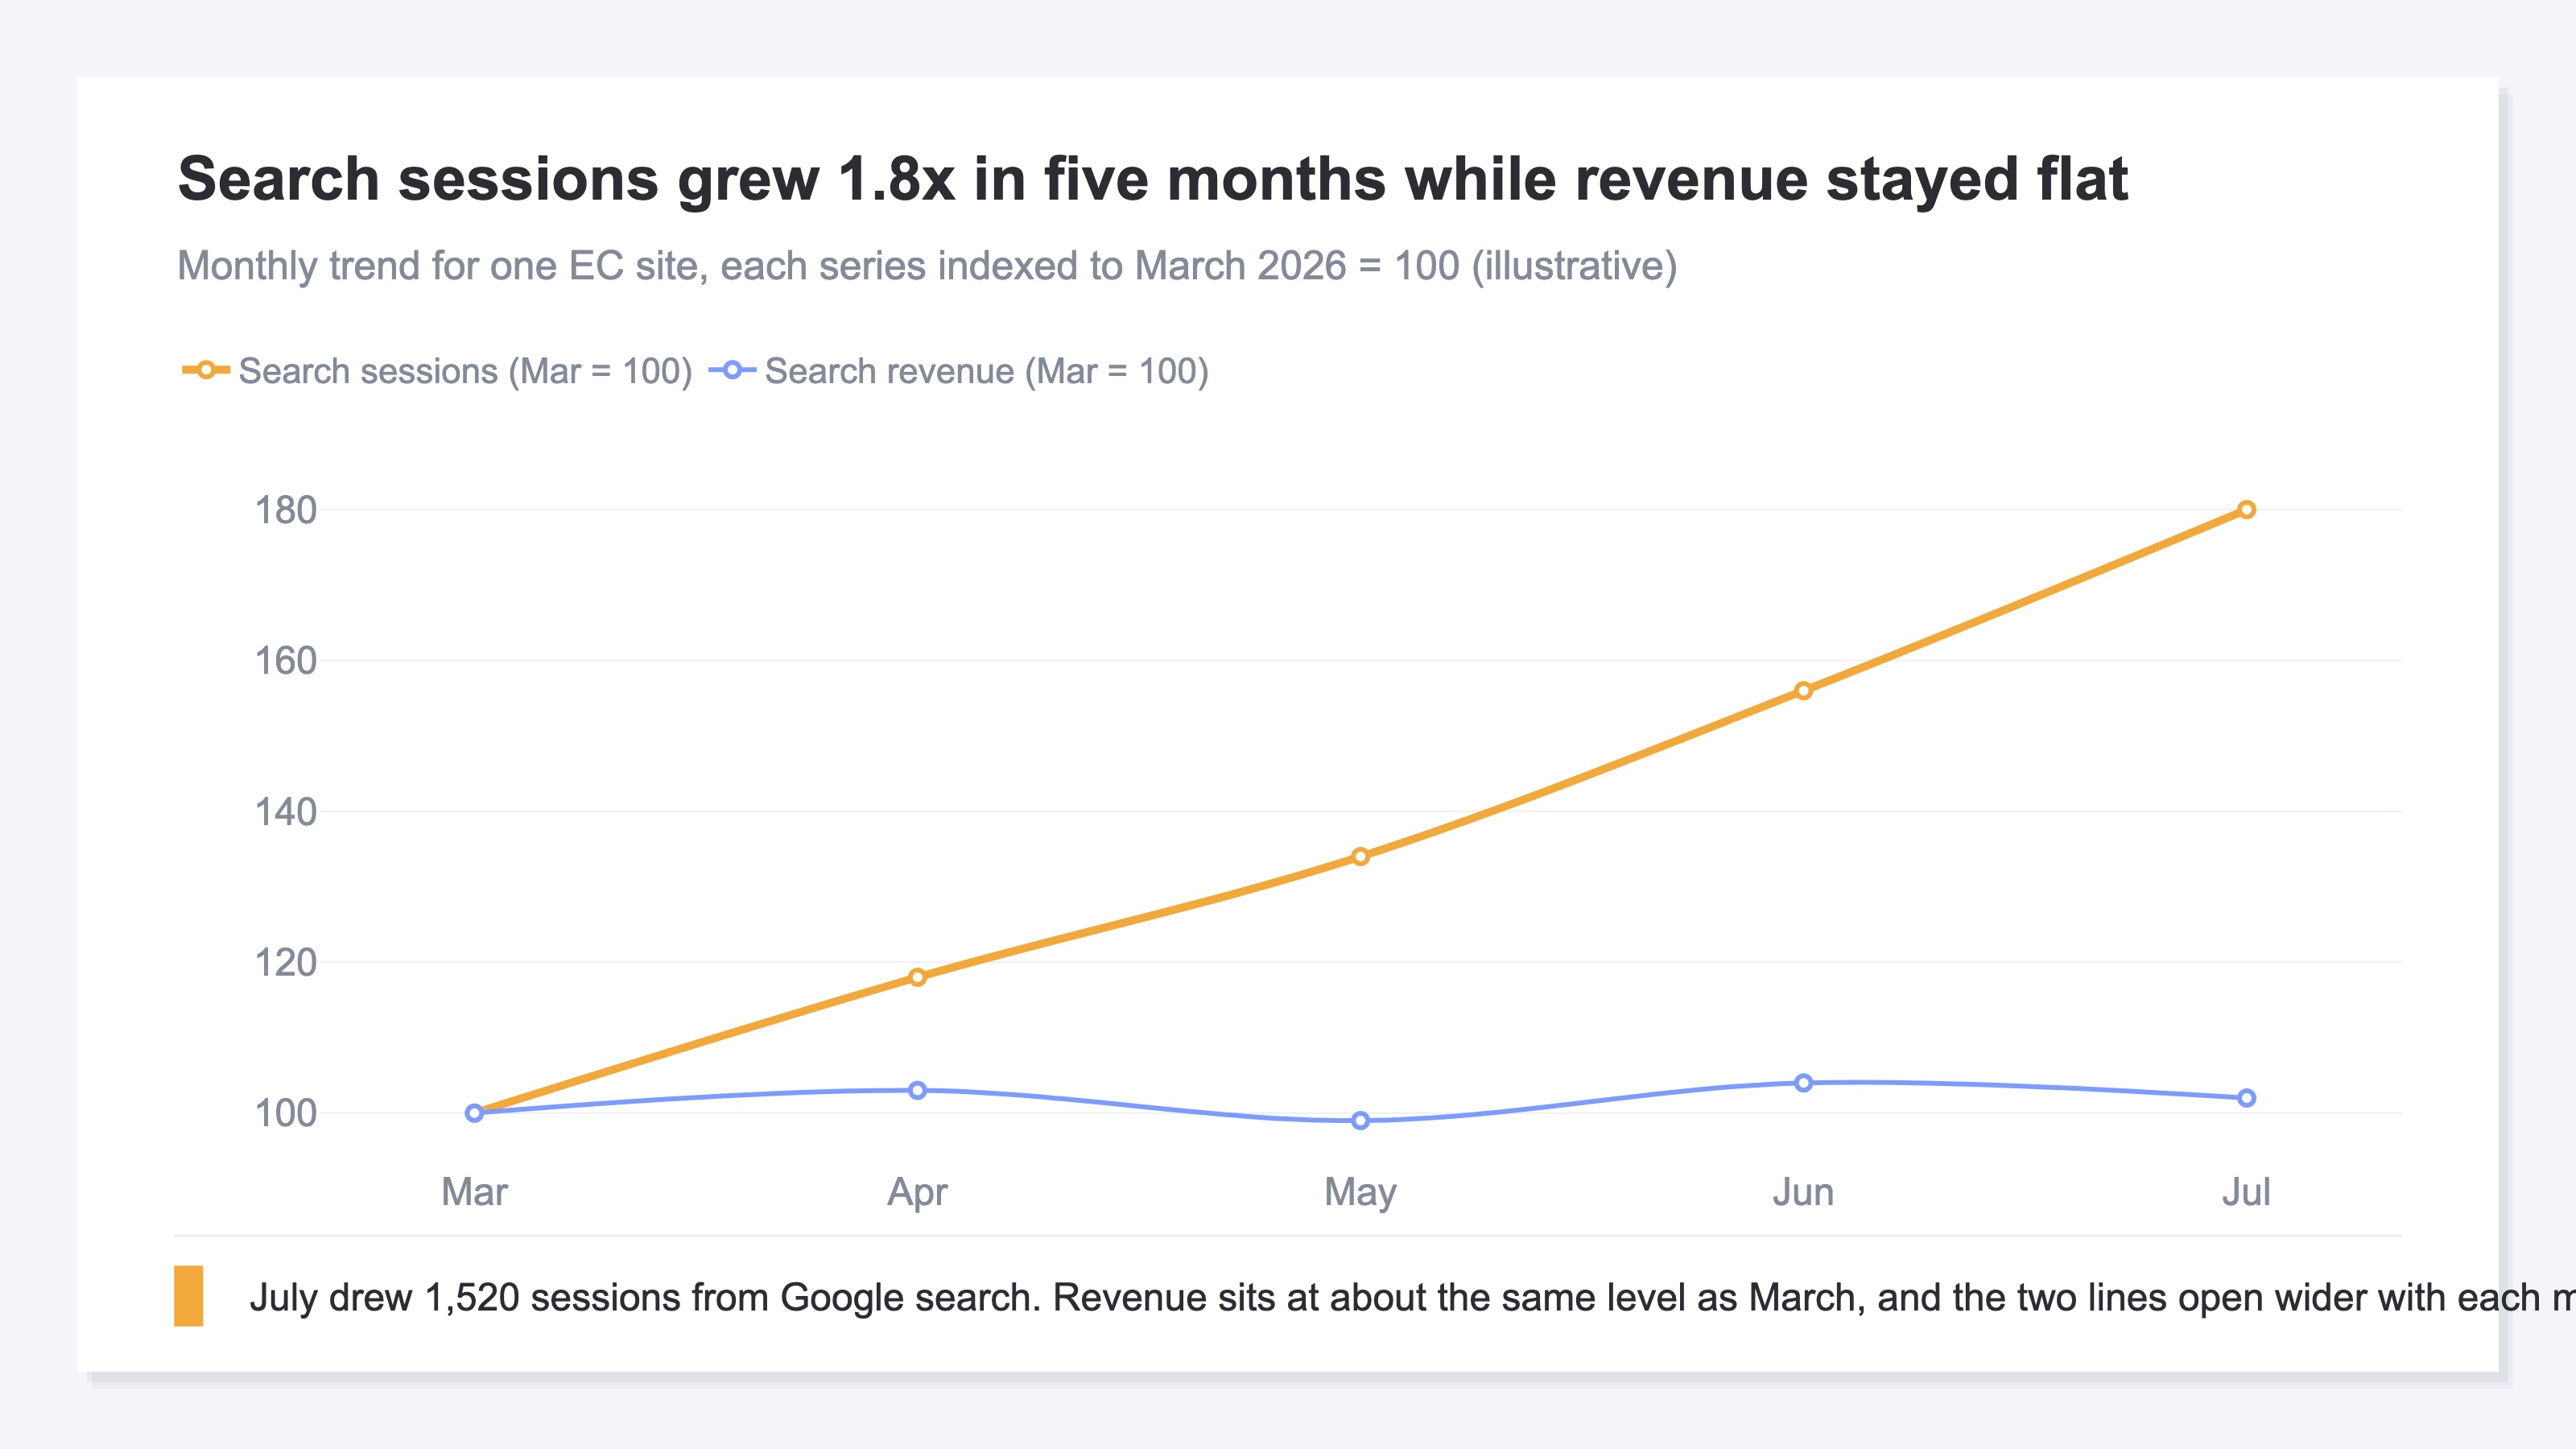
The right order has three stages. The first is whether the added traffic is human visits. The second is whether the people searching those keywords are buyers. The third is which keywords get your hours. Splitting traffic as a whole into three layers by channel is laid out in more traffic but flat revenue. What this article looks at sits inside that: it takes the search channel down to the level of individual keywords. Settle the first two stages before you get into planning articles, and the answer to the third one changes.
2. First Confirm the Added Traffic Is Human#
Is anything non-human mixed into the increase? This only has to be checked once.
The clue is in how the traffic behaves. Has traffic with an extremely short average stay gone up? Has the bounce jumped? A human visit leaves enough time to read something after arriving from a search result. When visits that move to the next URL without reading rise as a block, that is a different pattern from human browsing. What is under suspicion here is automated access by a program rather than a person — bot traffic. The detail of how that judgment is made is covered in the age of agentic shopping.
Outside research gives a sense of the scale. In a study by Thales that aggregated bot activity across the whole of 2025, 53% of web traffic worldwide was bots, above the human share of 47%[5]. That does not mean search traffic to your own site follows the same ratio. It is also not a reason to read on without checking what the increase is made of.
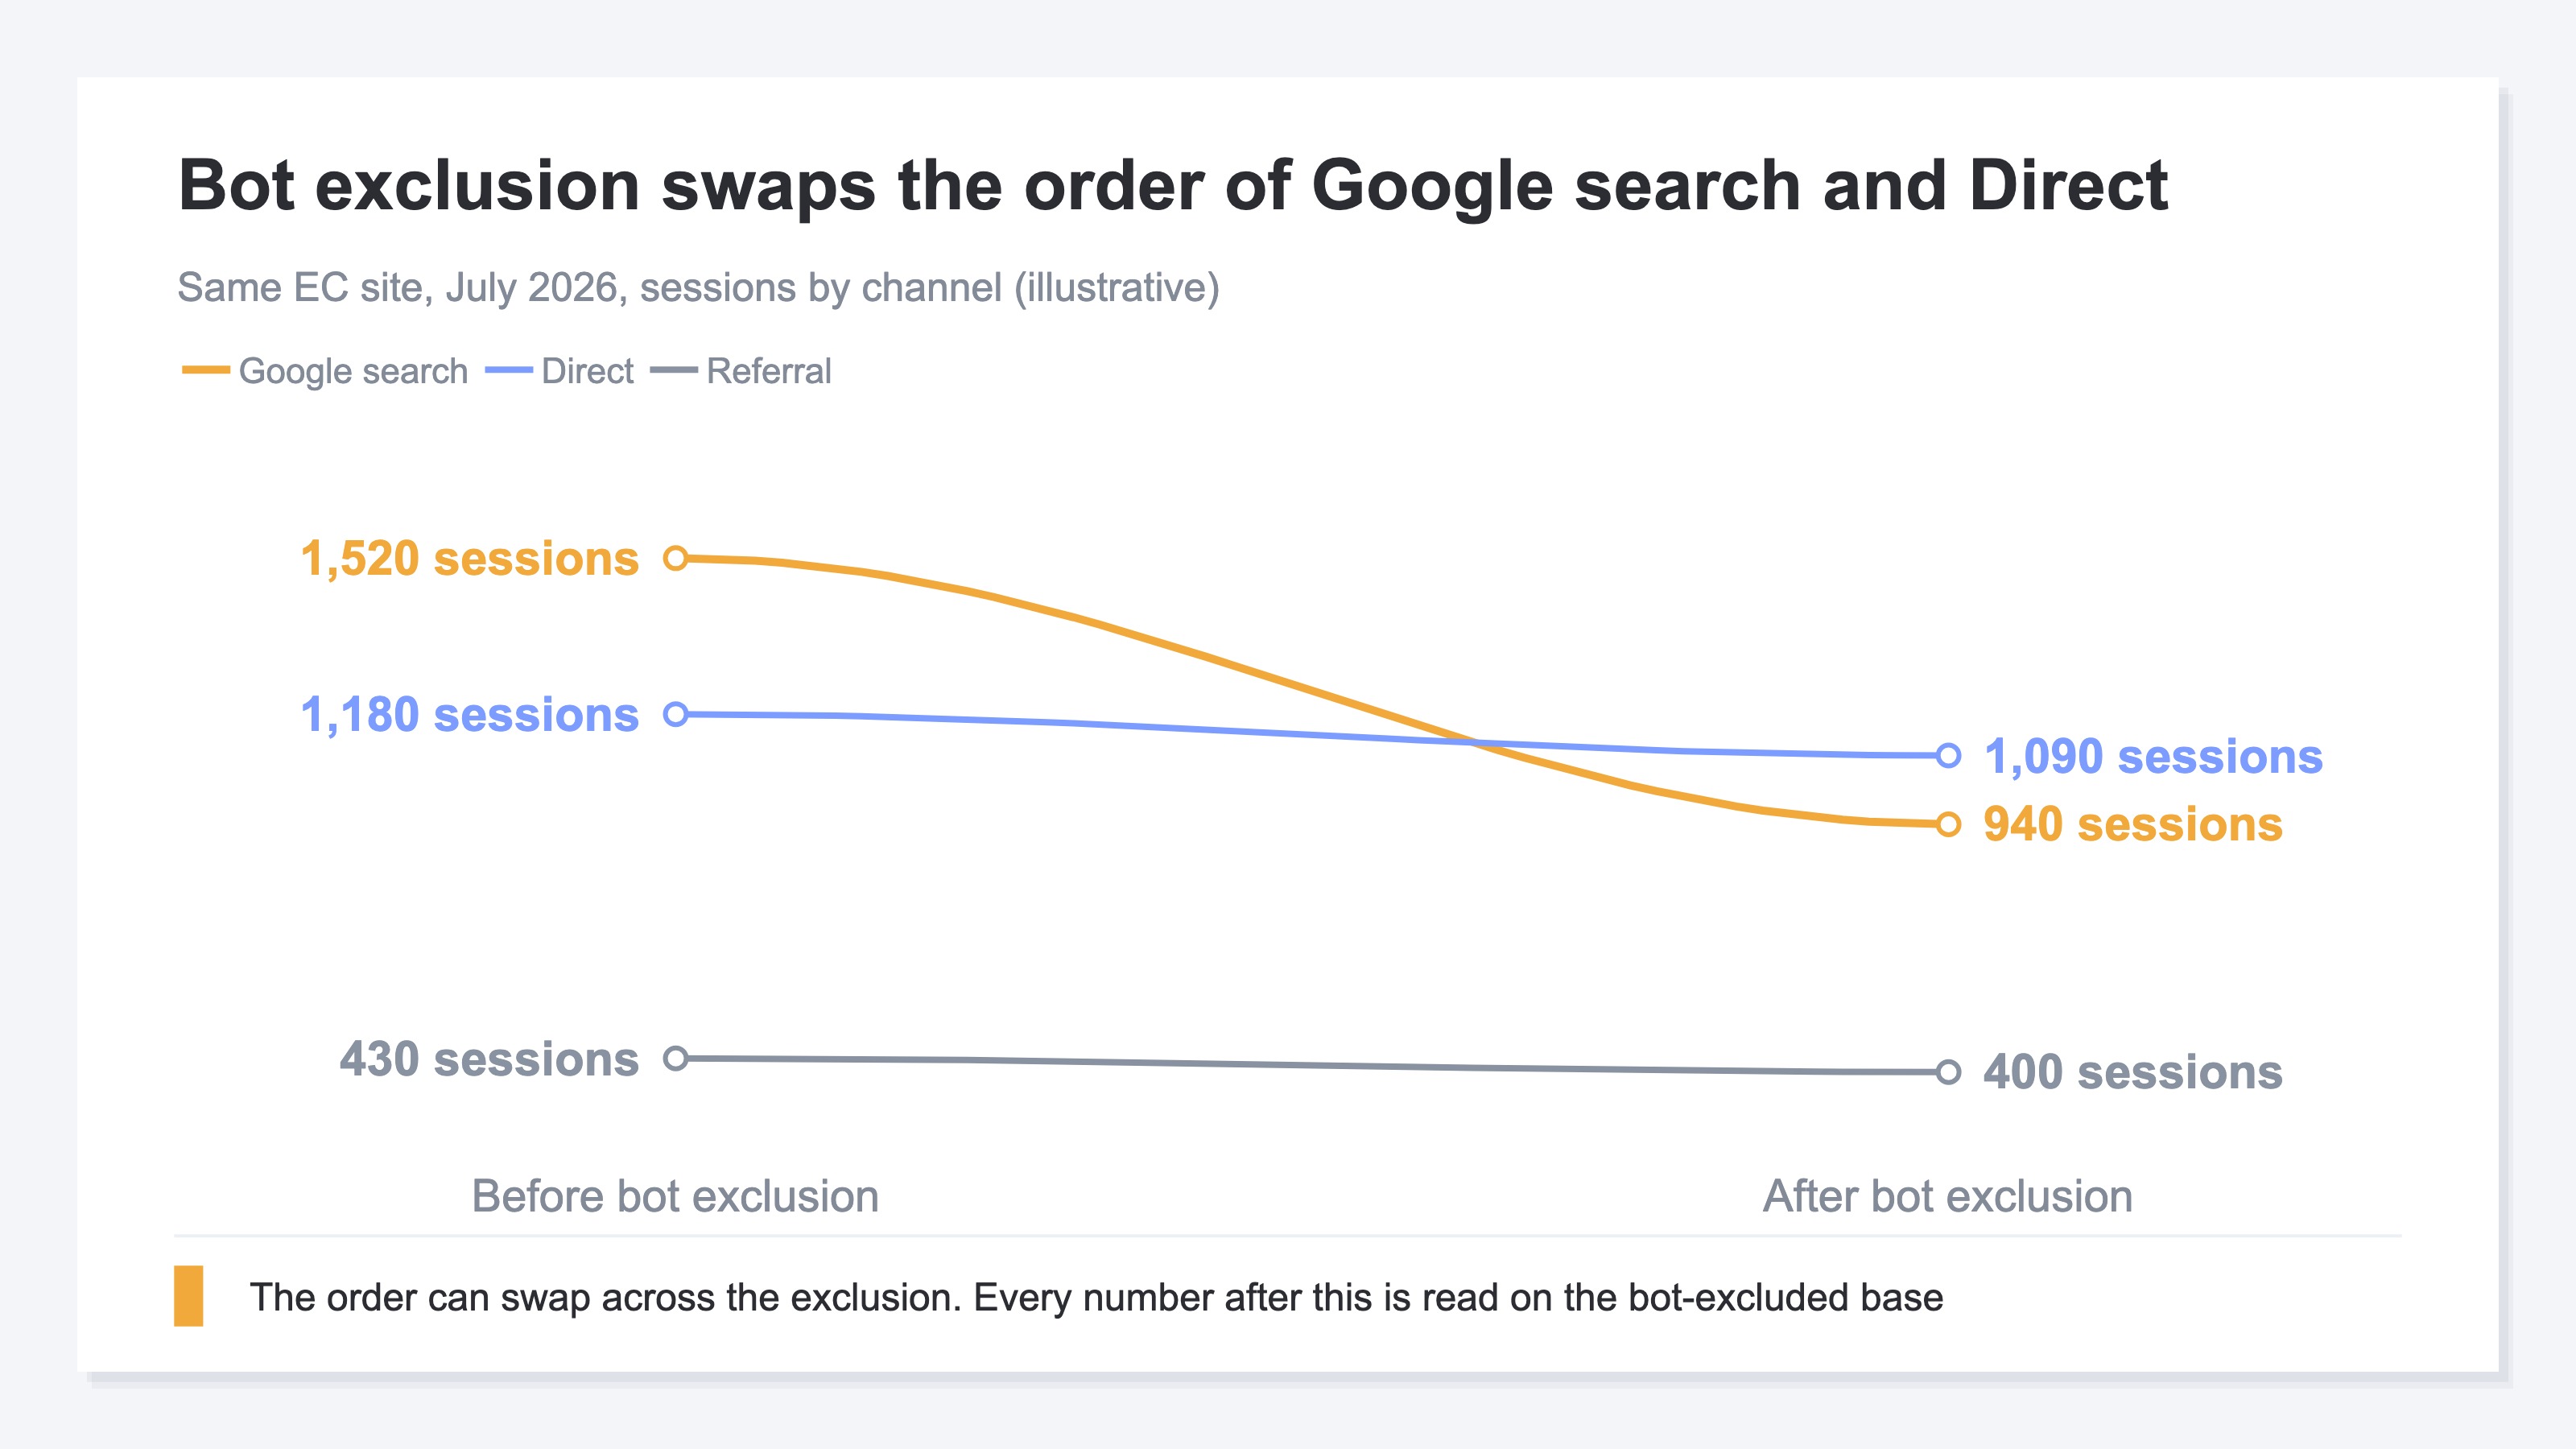
When the count of what was judged and excluded is disclosed as well, the other numbers can be read again on the post-exclusion base. What behavior alone can identify is access that differs from human browsing, and no further. Real visitors arriving through a VPN or a cloud proxy can still be misjudged, so treat it as the first move in narrowing things down.
If search sessions are still up after the exclusion, bots are not the cause. Where you look next changes.
3. The People Searching Those Keywords Are Not Buyers#
If revenue does not move once bots are out, the next thing to look at is who is searching those keywords.
The same "first position" holds two different things. Take first place for "when is shipping free" and the visitor takes the answer and leaves the site right there. Their purpose was served, so as an article that is the correct result. Take first place for "refill subscription price" and the visitor is checking the conditions before buying. Behind the same result — a rank — only what happens next splits.
Google's guidance is to create helpful, people-first content that answers what the searcher came for[3]. The more faithfully an article follows that principle, the more the reading ends at the moment the answer is handed over. The higher the rank climbs, the more visits arrive to take only the answer and leave. Rank and revenue part company here. A different shape of the same symptom, where the increase turned out to be searches on your own brand name, is covered in traffic up but no new customers. What is in view here is the reverse: non-branded keywords are genuinely being collected.
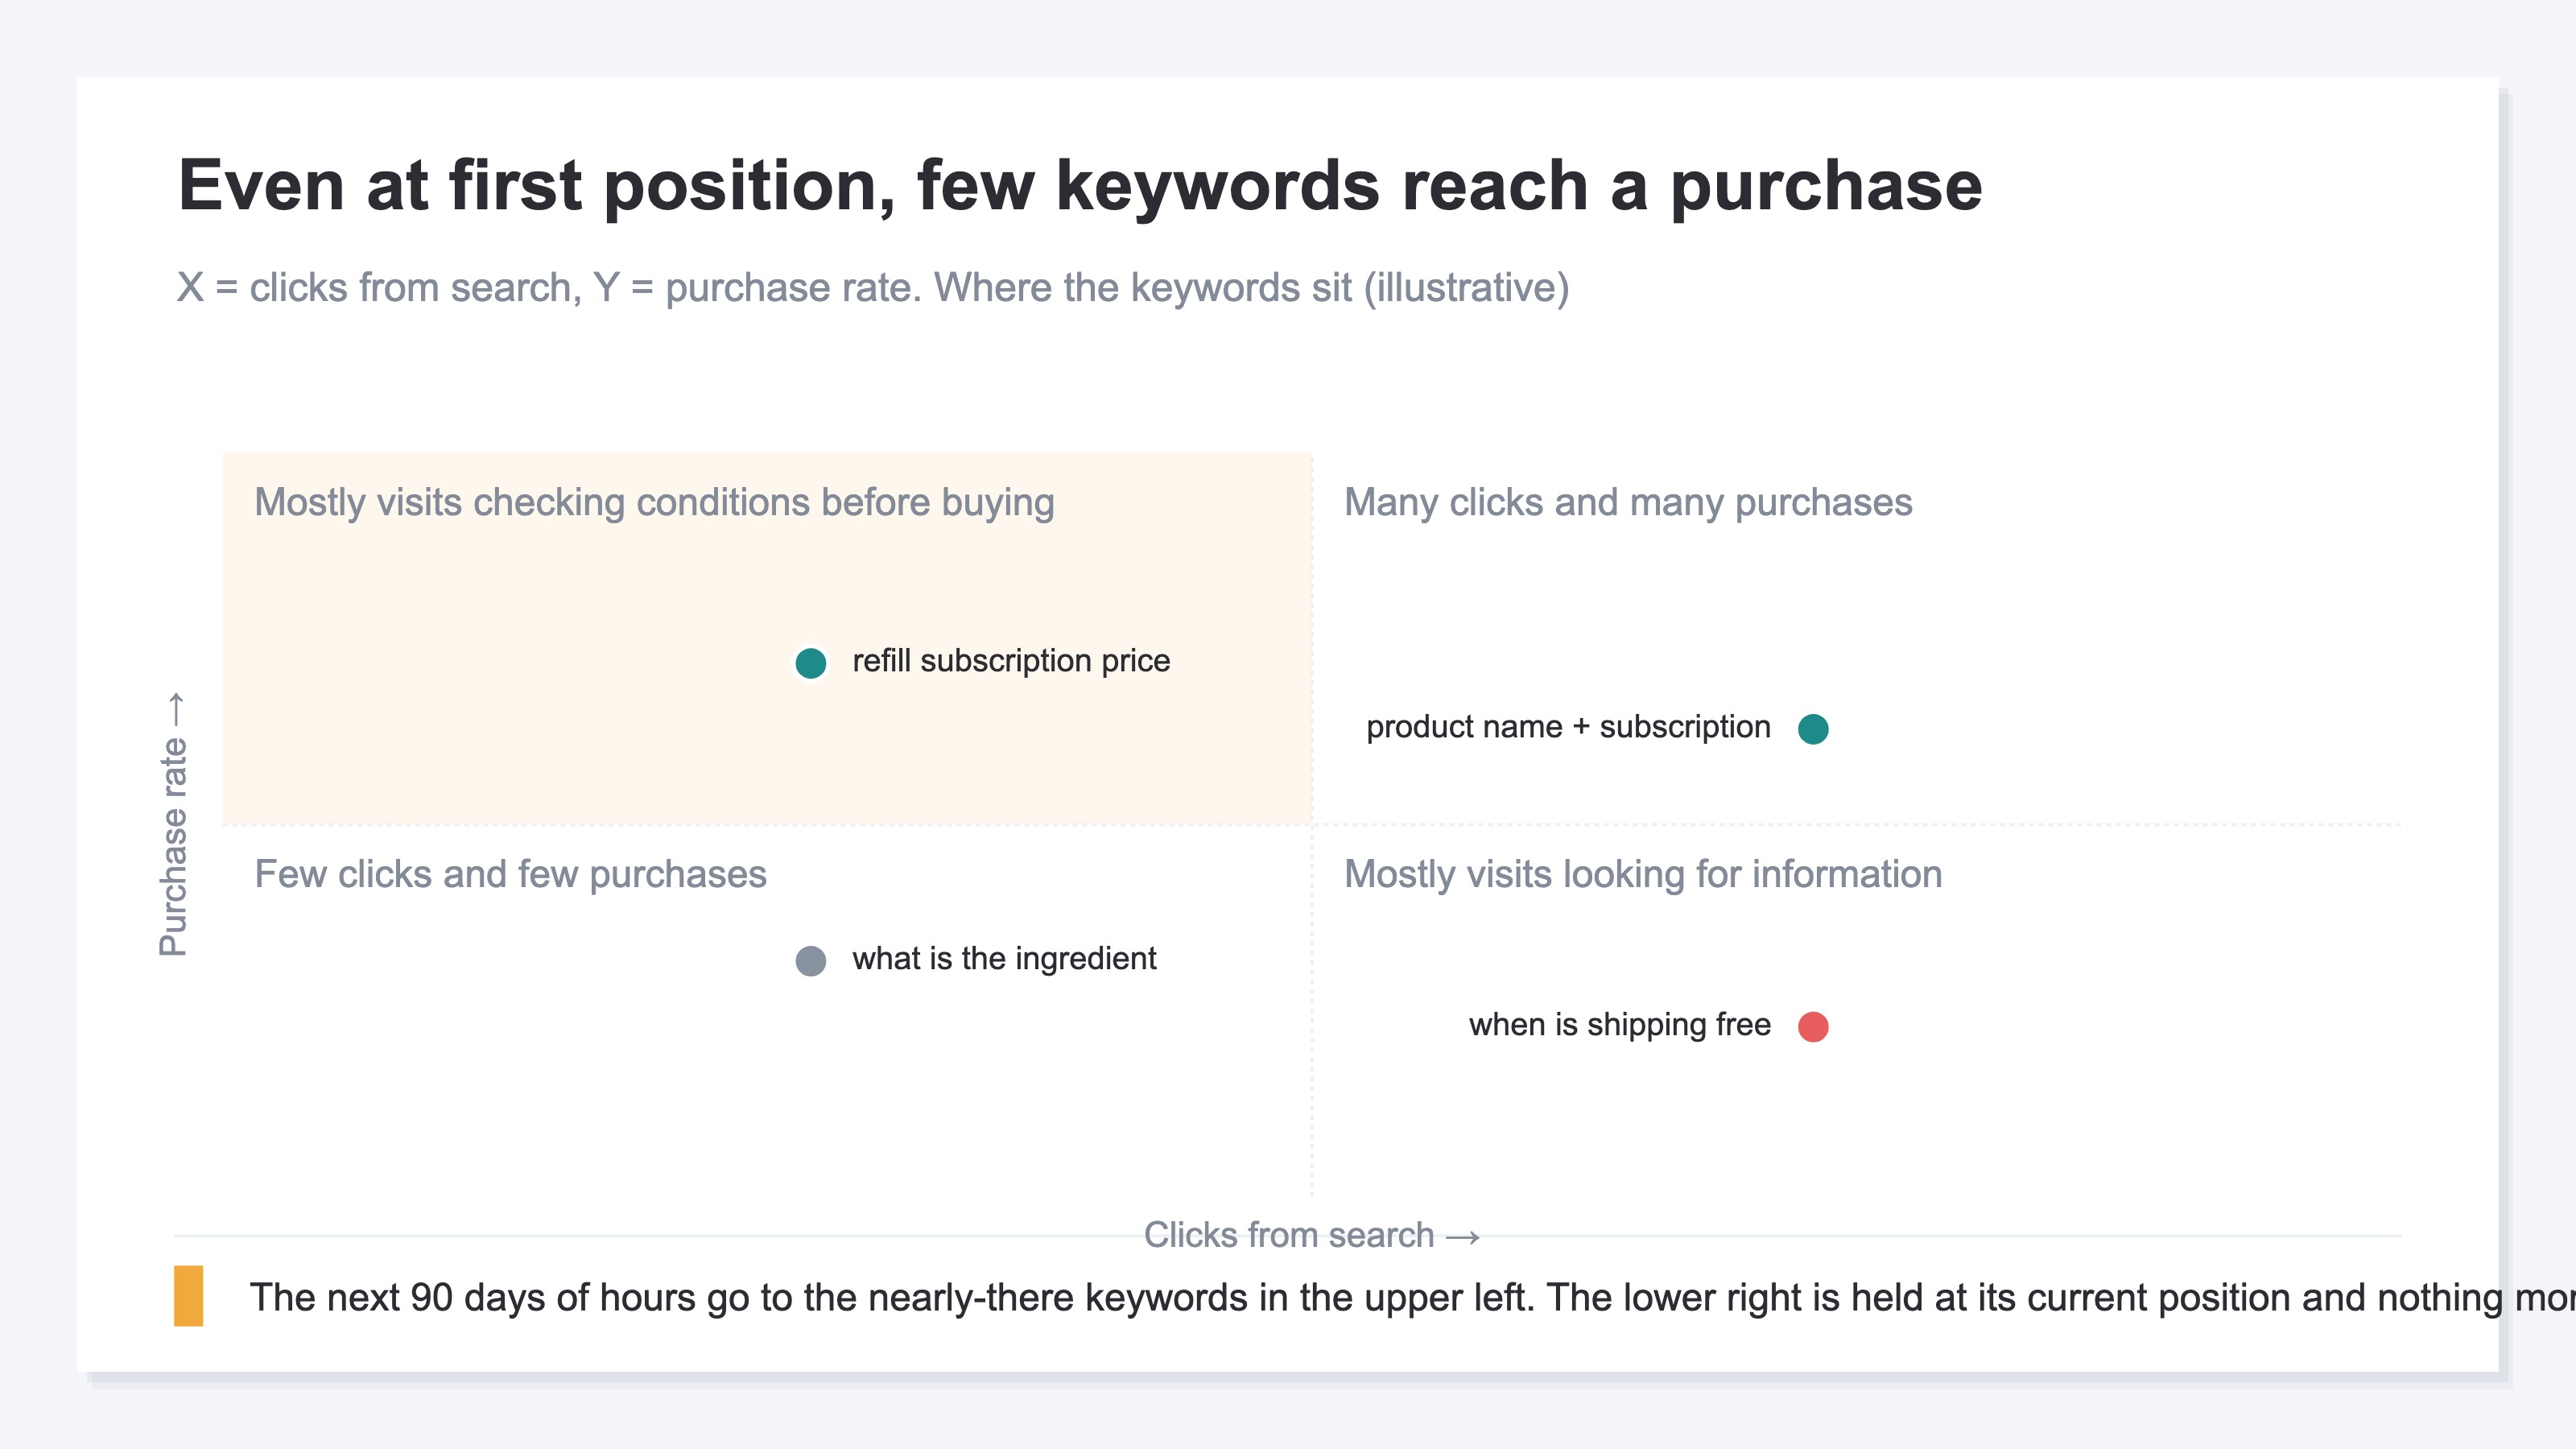
Move the basis for sorting from how a keyword looks to what it has produced. "This one looks like it carries purchase intent" is the writer guessing from the wording, without looking at whether the visits from that keyword reached a purchase. Even for the same keyword, the result changes with the price range of what you sell and the state of your stock.
The difference in how pages get read can be measured on our own site as well. We checked article traffic on revenuescope.jp with RevenueScope. Visits that did not read deeply reached the sign-up path at the end of the article zero times, while more than 40% of the visits that did read deeply reached it. Arriving on the same page, a change in how it is read changes what happens next. Position does not show that difference.
Whether a click happens at all is the stage before this, and it is covered in rankings up but no clicks. What this article looks at is whether the clicks that do arrive reach a purchase.
4. Swap the Keywords You Prioritize for the Next 90 Days#
The move is not to add articles. It is to swap which keywords get your hours.
The first ones to push are the keywords that already reach a purchase and still have room left in the rankings. Sitting at the bottom of page one or on page two, with purchases on record. Concentrating hours there raises the chance that the added clicks reach a purchase. How to pick those nearly-there keywords is laid out in striking-distance keywords. What this article decides is what goes into that list.
Keywords with no buyers behind them are held at their current rank and nothing more. If they are already near the top, no extra article and no rewrite is needed. The hours that frees move to the nearly-there keywords. The division of roles falls out here too. Answer the searches that want an answer with articles, and answer the searches checking conditions before buying with category pages and product pages. Keep assigning articles to the same keyword and all that accumulates are pages that hand over an answer.
It is worth knowing how far the free tools take you. The Google Search Console performance report shows clicks, impressions and average position for each query[2]. That gets you as far as suspecting whether the "looking it up" keywords have taken the top places. On the GA4 side, purchases can be measured[4]. Lining up the purchase rate for each channel gives you material for suspecting that the search channel sits lower than the others.
Both of them break off partway, though. What Google Search Console holds ends at the click, and it carries nothing that shows how much revenue that click became. GA4 can hold search queries on screen once it is connected to Google Search Console, but the only things that can sit next to a query are the landing page, the device and the country[6]. Neither revenue nor conversions is in there, so keywords and amounts never appear in the same table.
Decisions have a due date. SEO takes time between concentrating hours and seeing rank and revenue change. To make the next peak season, the keywords to prioritize get decided this week. But the production deadline arrives before the investigation is finished. By the time rankings move, that quarter's budget is already allocated.
RevenueScope solution
RevenueScope collects these keywords in a tab named Search keywords. For each keyword it displays clicks, impressions, CTR, average position, the top landing pages and estimated revenue. Two of them carry a comparison against the prior period: clicks and estimated revenue. Estimated revenue is a conservative approximation, revenue per search visit (RPS) multiplied by clicks, and not confirmed revenue. The sessions behind that RPS are the figures after bot exclusion. Clicks, impressions, CTR and position are values received from Google Search Console and have not been through bot exclusion.
The content improvement tab classifies content pages into five states by prior-period comparison, separating the pages that have stalled from the pages with room to grow. Open a page and it displays that page's landing revenue, the search keywords that make up its room to grow, the expected monthly session increase, and a recommended action. Landing revenue is a measured value attributed to the landing page on a last-touch basis.
How the economics split by keyword becomes visible once you break it apart.
Fictional Store C's search traffic, split by type of keyword (illustrative)
| Type of keyword | RPS | Purchase rate | Order value |
|---|---|---|---|
| Looking up how to use it | ¥90 | 0.3% | ¥30,000 |
| Searching by product name | ¥90 | 3.0% | ¥3,000 |
Note: the table above is one example, built to explain how the economics differ by keyword. The demo screen runs on the sample store's sample data (refreshed daily), and its Search keywords tab lists clicks, impressions, CTR, average position, top landing pages and estimated revenue.
Revenue per visit is ¥90 for both types. What sits inside them is the opposite. The how-to-use keywords carry a purchase rate of 0.3%, with an occasional high-priced item lifting the order value. The product-name keywords carry a purchase rate 10x higher at 3.0%, with an order value of ¥3,000.
The hours go to the second one. The clicks needed for a single purchase are about 333 on the how-to-use side and about 33 on the product-name side. Because revenue per visit is the same, adding the same number of clicks adds the same expected revenue. What differs is how many purchases that revenue is built from. The product-name side builds it from 10x the number of purchases, so even in a window as short as 90 days the outcome is readable. On the how-to-use side, the result swings on whether an occasional high-priced item lands. The next 90 days of production capacity go to the product-name keywords that still have room left in position.
FAQ#
Frequently asked questions#
Q. We hold first position and revenue has not changed. Is that because the article is low quality?
A. A first-place ranking does not by itself imply a quality problem. The more completely an article answers a search that wants an answer, the more readers finish and leave the site right there. Google itself recommends content that answers what the searcher came for[3]. What separates rank from revenue is not how well the article is made, it is the purpose of the people searching that keyword.
Q. Where do we tell whether the added traffic is bots?
A. Judge it from how the traffic behaves. An extremely short average stay, or a bounce that has jumped, are the clues. If the excluded count can be confirmed as well, the other numbers can be read again on the post-exclusion base.
Q. If we combine Google Search Console and GA4, can we get revenue by keyword?
A. Not as they stand. The Google Search Console performance report is built from four things, clicks, impressions, CTR and position, and it has no column for amounts[2]. GA4 measures purchases[4], but it cannot line up which query a purchase came from. Bring them closer by hand and you get as far as the landing page level.
Summary#
If rankings and impressions are climbing and revenue is not, the thing to open this week is the query list in Google Search Console. Ask whether the top places have filled up with "looking it up" keywords. If that rings true, the candidates for your next production slot change.
Before that, check one thing only: whether anything non-human is mixed into the increase. Without a base that holds, the sorting itself does not stand up.
See which ads actually drive revenue, at a glance
Free up to 2,000 sessions/month, AI connection included. No credit card required. Up and running in 5 minutes.
References#
- [1] Google Search Console Help "What are impressions, position, and clicks?" (2026)
- [2] Google Search Console Help "Performance report (Search results): Overview and basic setup" (2026)
- [3] Google Search Central "Creating Helpful, Reliable, People-First Content" (2026)
- [4] Google Analytics "Measure ecommerce" (2026)
- [5] Thales "2026 Bad Bot Report" (2026)
- [6] Google Analytics Help "Connect Search Console to Google Analytics" (2026)