Traffic is flat or up slightly, yet revenue doesn't follow. You run campaigns and you can grow sessions, but purchases move far less than you expected — a scene most ecommerce managers know well. On paper the traffic holds, but the sense of real progress is thin.
Here's the conclusion first. In most cases, the cause is in what the added visits are made of. That single number called "sessions" mixes together traffic that isn't even human, human traffic that doesn't move revenue, and traffic that never lands on a sale. That's why more visits don't move revenue. This article splits traffic into three layers — real (is it truly human), quality (which channel produces revenue), and landing (which entry point led to the sale). The goal isn't to "grow traffic"; it's to pinpoint which layer is leaking revenue, and to decide which entry points to cut and which to grow.
Table of contents
TL;DR#
-
More traffic ≠ more revenue
That single number called "sessions" mixes non-human traffic, traffic that doesn't move revenue, and traffic that never lands on a sale
-
Layer 1 is "real"
Even when the number looks flat or slightly up, human traffic may be shrinking. Only after removing bots (non-users that merely fire your analytics tag) do you see the real inflow
-
Layer 2 is "quality"
Even among human traffic, channels move revenue differently. Compare by revenue per session (RPS) and the channels that carry many visits but produce little revenue surface
-
Layer 3 is "landing"
Look at which entry page finally led to the sale, and a different lineup appears than the ranking by search position or visit count. Only after narrowing this far can you decide which entry points to cut and which to grow
1. Why more traffic doesn't reach revenue#
Bottom line: More visits don't move revenue because, in most cases, "what the added share is made of" is traffic that doesn't move sales. As long as you look at sessions as a single bar, you can't see that contents.
Open your analytics and the first thing you see is the session count. When it holds, traffic feels healthy. But inside that one bar, traffic of completely different nature lives together. Visits that aren't even human, humans with no intent to buy, visits that were interested but never landed on a sale — all of these stack up to the same height as "one session."
So the job isn't to make the bar taller; it's to slice the bar into layers. From the top down: real (is it truly human), quality (which channel produces revenue), and landing (which entry point led to the sale). Each time you pass through one of these three filters, the base narrows, and what remains at the end is "the real traffic that actually moves revenue." Conversely, which filter narrowed it the most tells you which layer is leaking revenue.
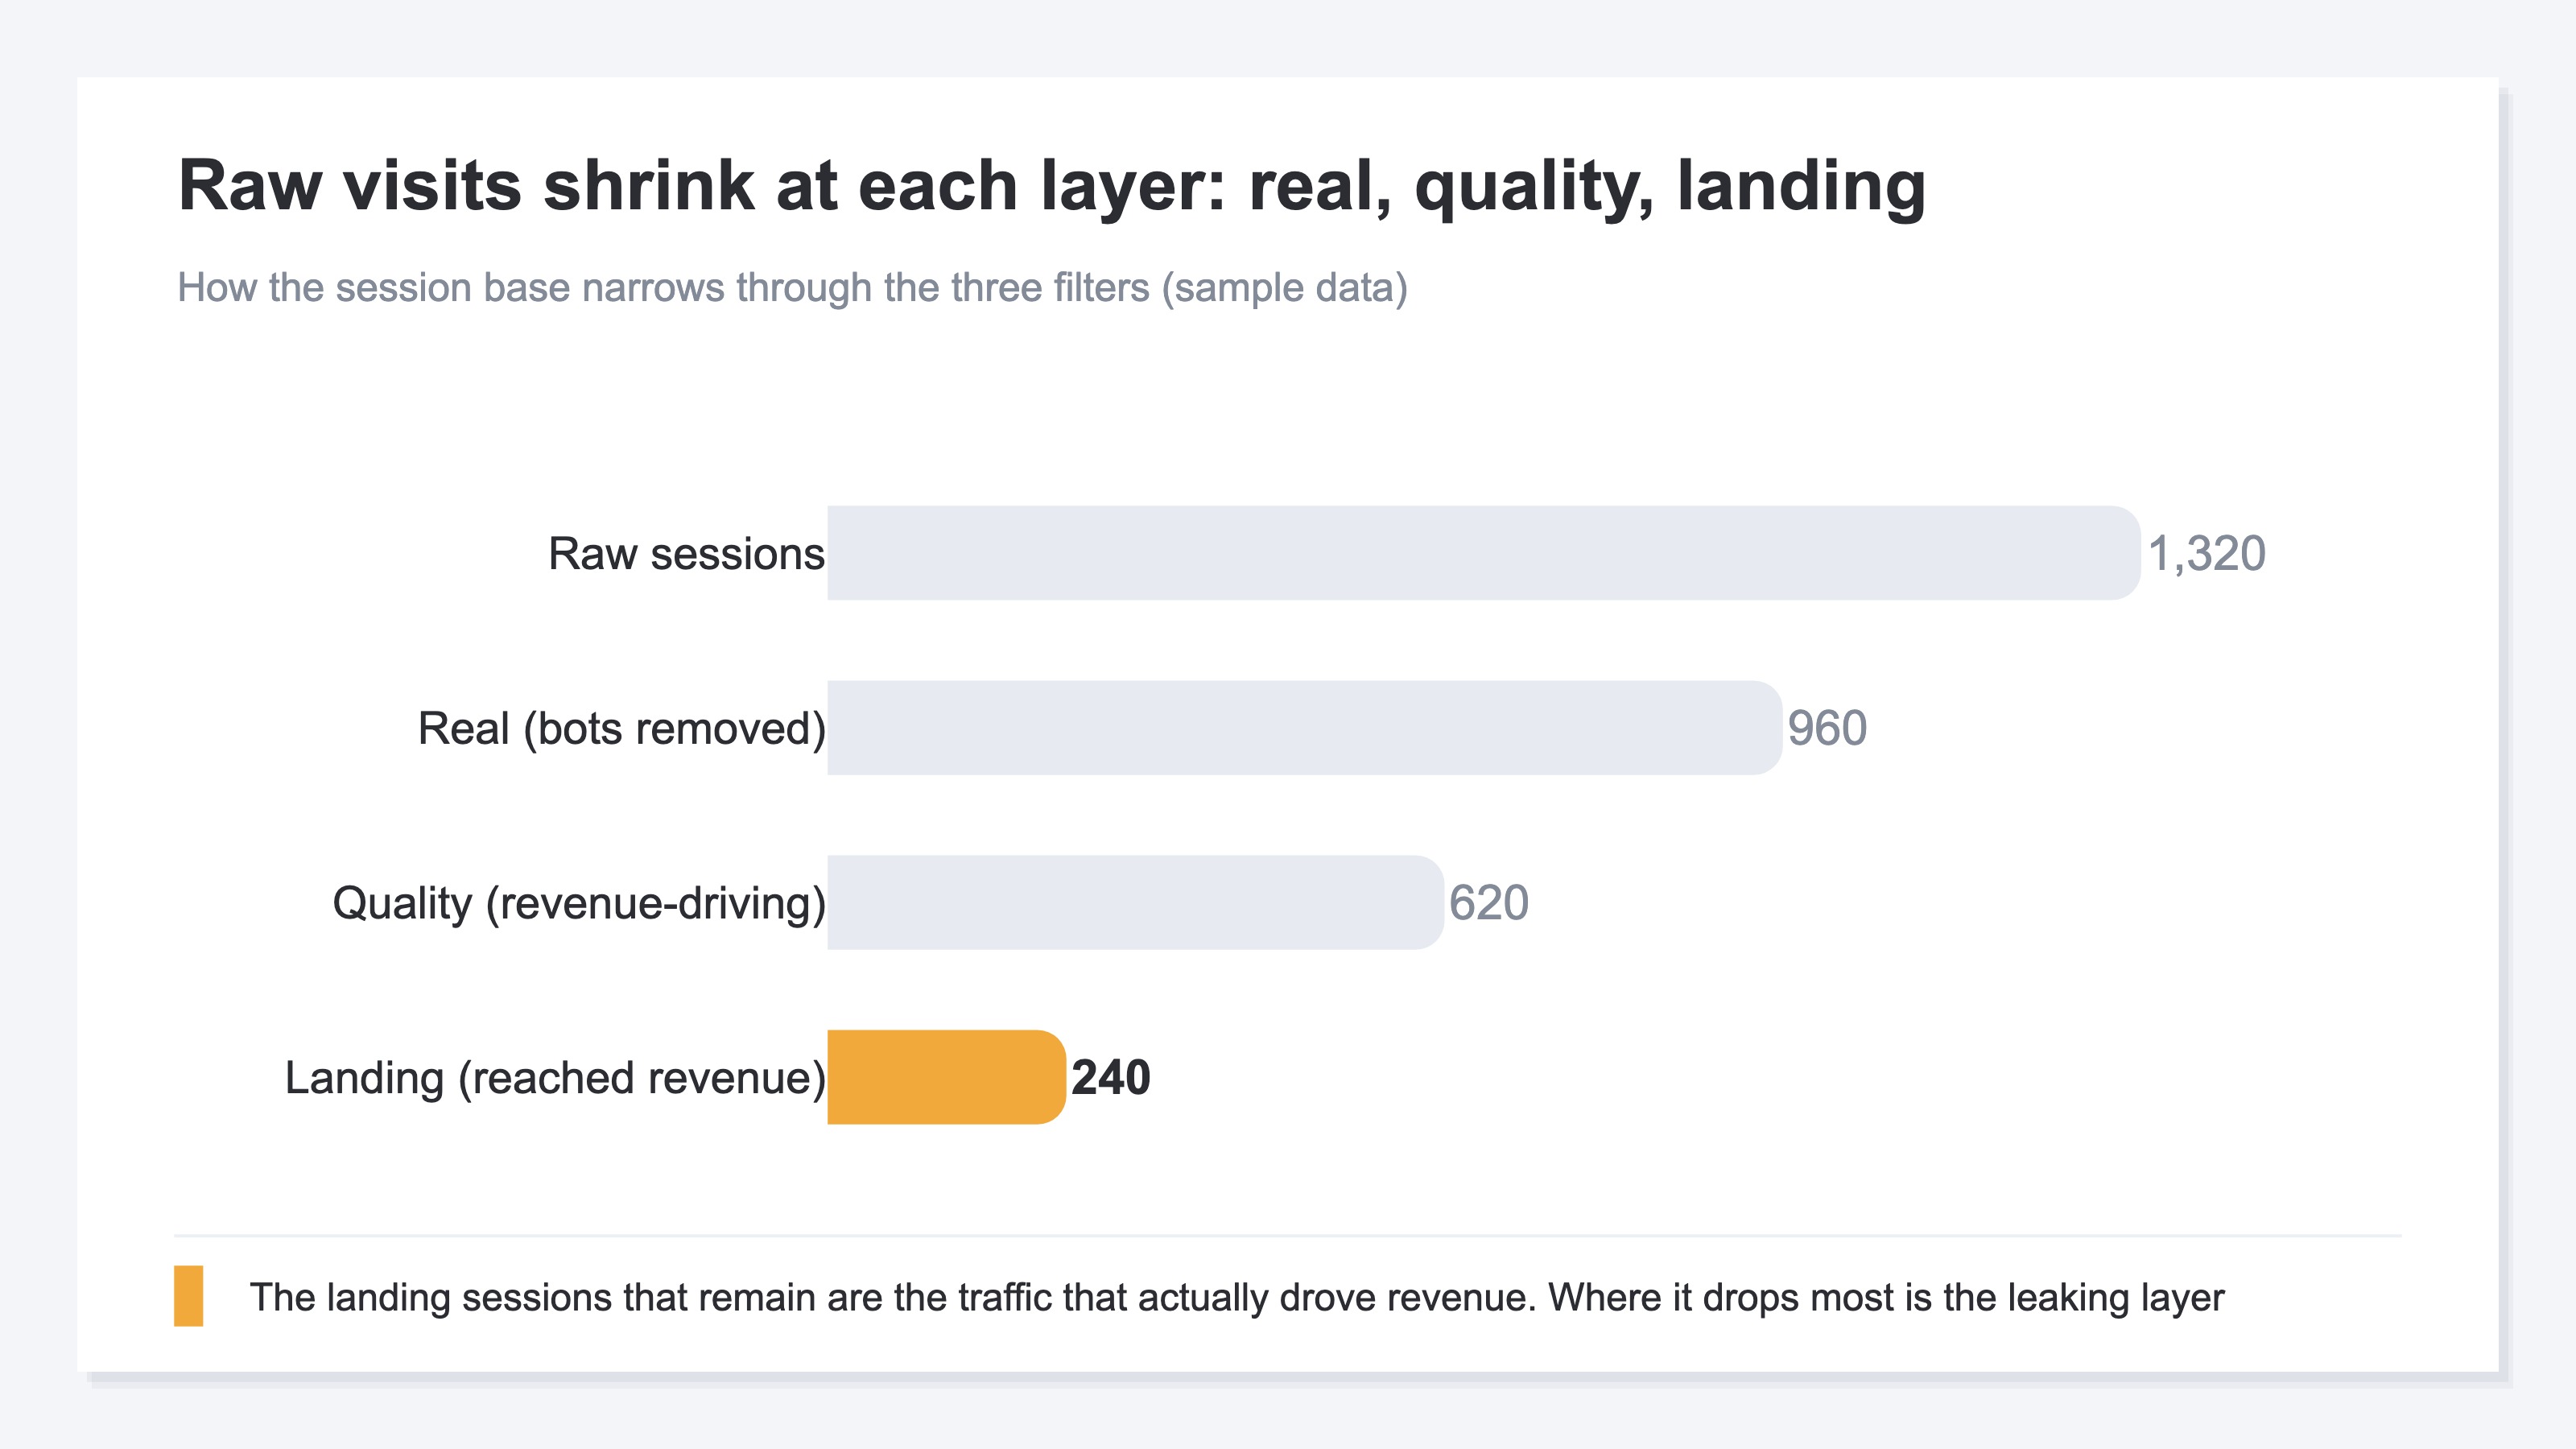
The idea itself isn't hard. What's hard is rebuilding these three layers across channels, by hand, every month. In what follows, we'll walk through what each layer is looking at.
2. Layer 1, real: is the traffic actually human#
Bottom line: The first filter is "is this traffic human." Even when the number looks flat or slightly up, human visits may be shrinking. If you don't remove non-users first, everything downstream runs on a dirty base.
Depending on your analytics setup, bots from certain regions can slip into the totals without being excluded. Then human traffic is actually falling, yet the number alone looks flat to growing. Look at time on site or pages per session and it's not rare to find that much of that "traffic" is bots merely firing the analytics tag — never customers to begin with. Only after removing this and recounting do you see the true cost of acquisition.
Beyond "is it human," casual, no-intent browsing is also a layer-1 concern. The "just looking it up" crowd that used to inflate visit counts is increasingly not bothering to come to your site, now that AI answers on the spot. Traffic falls as a result, but what remains is higher-intent visits. In other words, rather than chasing raw session counts, it's closer to the truth of the business to look at how much real, intentful human traffic remains.
Even within a free toolset you can review your known-bot exclusion settings or flag traffic with extremely short time on site. But that only reaches the level of inspecting the entrance — it doesn't reach the precision of judging bots from behavior and disclosing "how many sessions we removed." Layer 1 is realistically about starting from "doubt it first." How bots distort channel evaluation is laid out in detail in How bots distort traffic and revenue.
3. Layer 2, quality: compare channels by RPS#
Bottom line: Even after narrowing to human traffic, quality still isn't uniform. Channels move revenue in completely different ways. What you look at here is not visit count but revenue per session (RPS — Revenue Per Session).
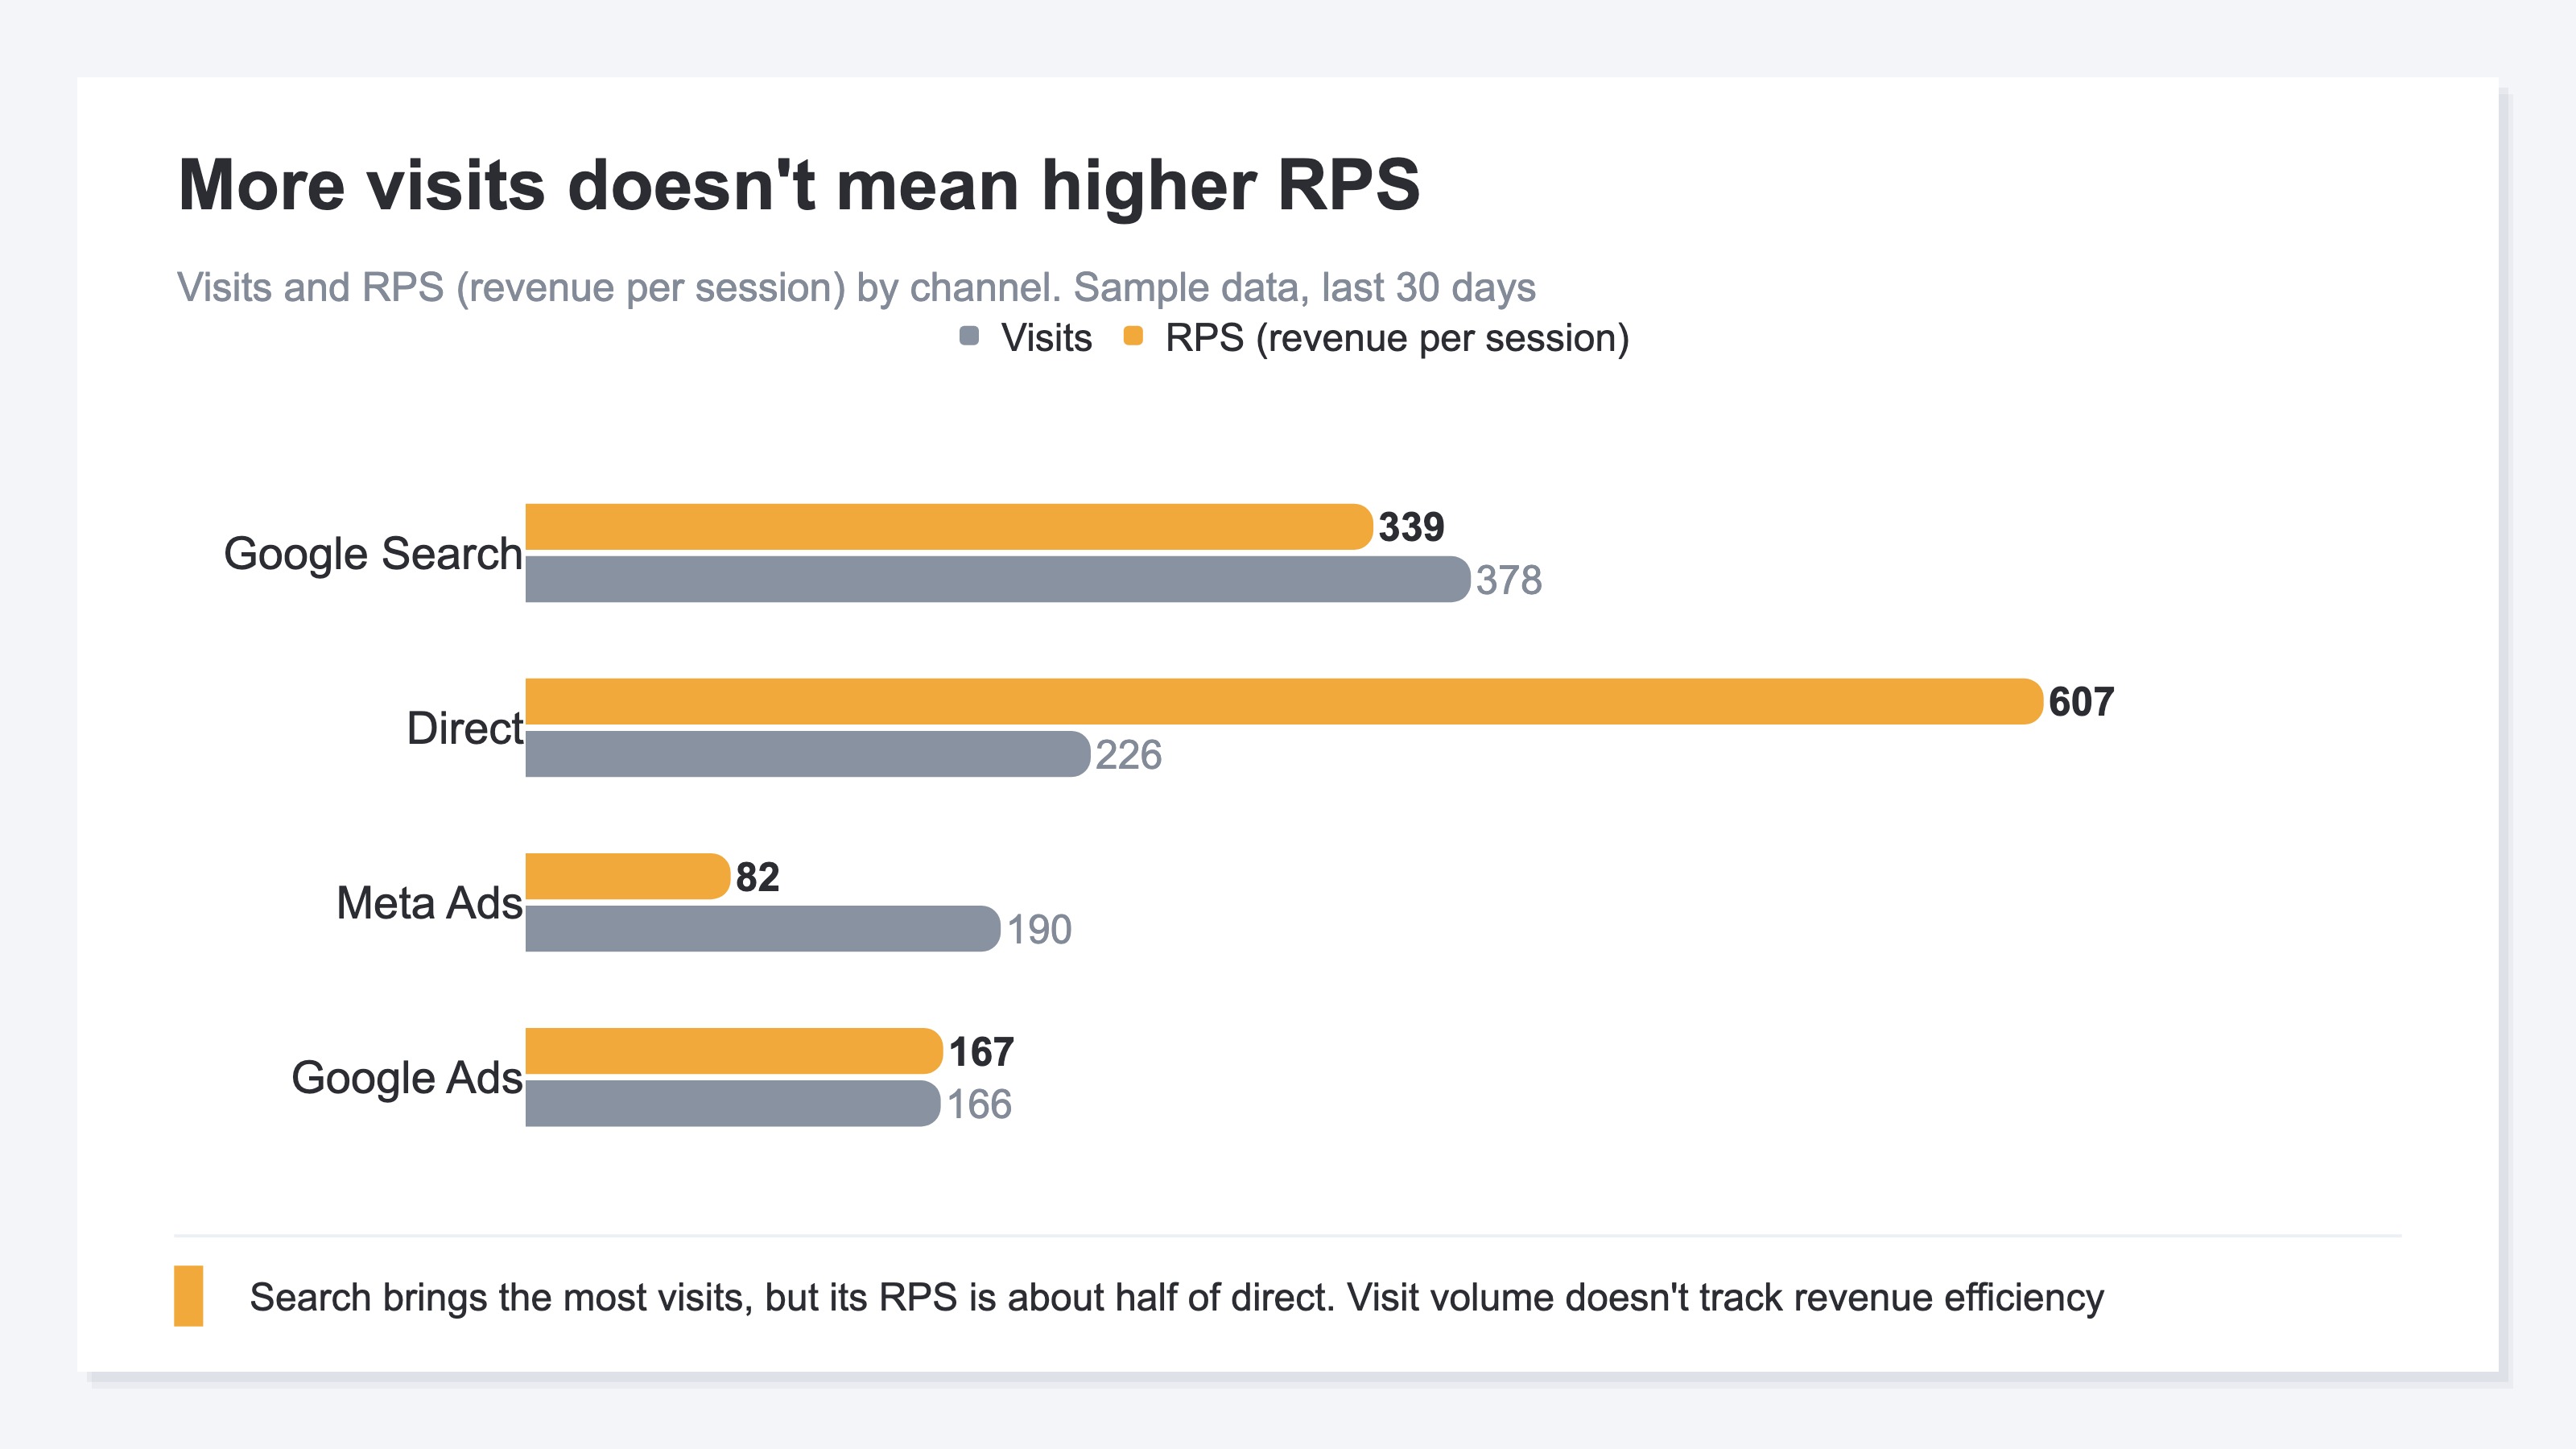
With the same 100 visits, one channel can convert one after another while another produces almost no revenue — that happens routinely. Look only at the bar of visit counts and the channel carrying lots of traffic looks excellent. But overlay RPS and the picture changes. A channel with many visits but low RPS isn't doing much for revenue despite its numeric presence. This is a main source of "traffic went up but revenue didn't move."
There's one more independent lens for quality: RPS split by new versus returning. New visitors can drive volume but often have lower order value and purchase rate, while returning visitors are fewer but more efficient — a gap that shows up often. But this is a separate cut from "by channel." Channel RPS and new-vs-returning RPS are best read as two independent lenses; multiply one by the other into a single number and you'll misread it. How revenue structure differs between new and returning is summarized in Splitting revenue by new vs. returning. The pattern where collecting cheap traffic fails to lift revenue per visit is also covered in How cheap clicks lower RPS.
4. Layer 3, landing: which entry point earned the revenue#
Bottom line: The last filter is "landing." Of the human, high-quality-channel visits, which entry page actually led to the sale. Attribute revenue to the last entry point touched and a different lineup appears than the ranking by visits or search position.
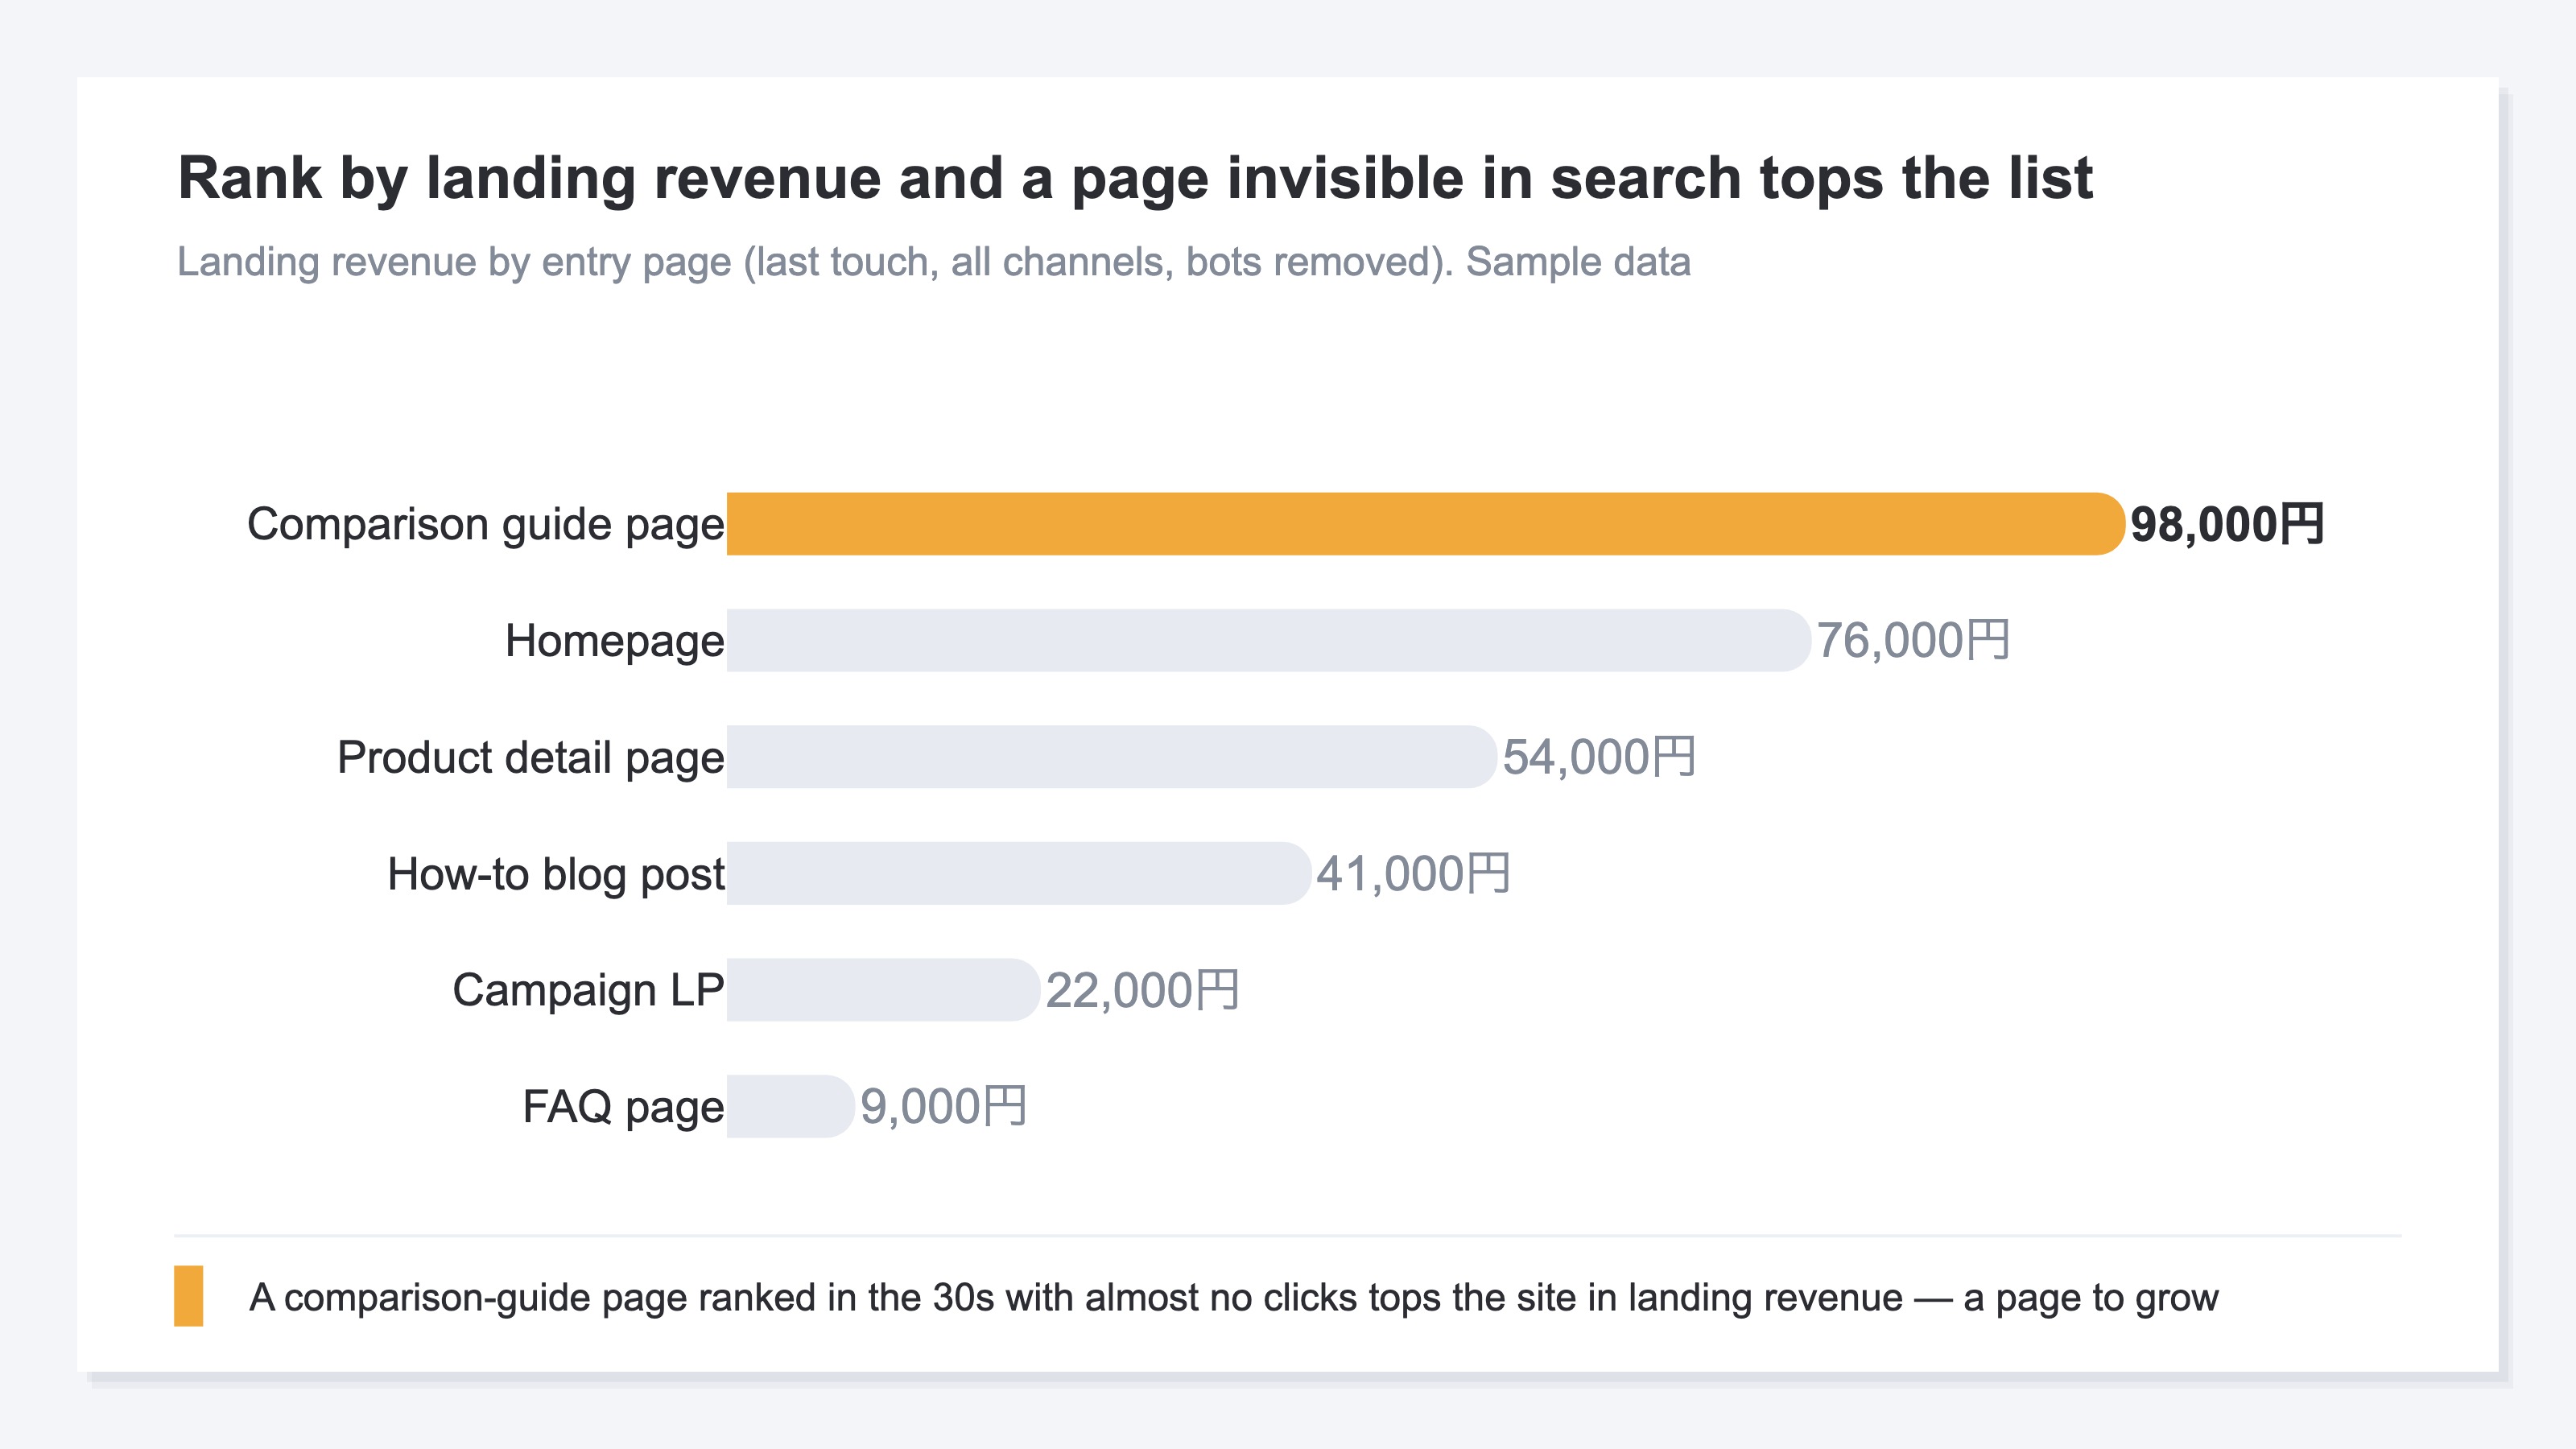
The value of looking at landing is that facts surface that you can't see without narrowing this far. For example, a page that ranks low in search and gets almost zero clicks from search can, in fact, earn the most in landing revenue. That page stands out nowhere in the search or session rankings. Only with the metric of landing revenue does it appear as an entry point worth growing. Conversely, an entry point with many visits but almost no landing revenue is a candidate to cut or rebuild.
What to watch here is that if you aggregate with dirty attribution, the whole decision goes wrong. Optimize without connecting which entry point produced how much revenue, and the work looks productive while it quietly steers the whole thing in the wrong direction. That's why landing attribution isn't something to clean up in one pass at the end of aggregation — it's something to keep clean from the start. Even so, you need to attribute the purchase to the last entry page, across channels, on a clean base with bots removed, and rebuild it every month. This third layer is exactly the point where the standard analytics screen gets structurally heavy. Whether a page is actually being read and landing — the quality of reach — sharpens the picture when you look at it too (Reading acquisition quality through read-through rate).
RevenueScope solution
Bottom line: RevenueScope puts the three layers — real, quality, landing — on one screen. The human numbers after bot removal, RPS by channel, landing revenue by entry page — instead of rebuilding these three filters by hand every month, it's a foundation to compare them on the same yardstick.
The three-layer idea is simple, but executing it is repetitive work spanning channels. RevenueScope measures revenue with its own tracking; at layer 1 it judges bots from behavior and excludes them, and it discloses how many sessions were removed. At layer 2 it shows sessions, revenue, and RPS by channel — as a separate tab from RPS by new vs. returning. At layer 3 it re-sorts pages by landing revenue (all channels, bots removed), attributing the purchase to the last entry page.
Below is the actual return when you ask the sample-data fiction site (a demo ecommerce store) to "show me the numbers by channel." You can see directly that visit volume and revenue efficiency don't line up.
| Channel | Visits | Revenue | RPS |
|---|---|---|---|
| Direct | 226 | ~¥137K | ¥607 |
| Google Search | 378 | ~¥128K | ¥339 |
| Meta Ads | 190 | ~¥16K | ¥82 |
| Google Ads | 166 | ~¥28K | ¥167 |
Actual output for the sample-data fiction site (a demo ecommerce store), last 30 days. Meta Ads carries about half the visits of Google Search, yet its RPS is under a quarter of Search's.
Re-sort the same site by layer-3 landing revenue and another face appears. A page ranked in the 30s with almost no clicks comes out at the very top in landing revenue — an entry point you'd never notice chasing visits or rankings. Because layer 2 and layer 3 are separate lenses, channel efficiency and page landing revenue aren't multiplied together; each is compared independently.
Note that RevenueScope doesn't handle gross margin or LTV; it centers on revenue itself. AI-referred traffic is visible on its own row, but it also honestly discloses that AI assistants don't always pass the referrer, so under- or missed counts can happen. Stating that up front, it replaces the monthly manual work of rebuilding the three layers by hand with a single yardstick you compare on one screen.
FAQ#
Q1. Traffic went up but revenue didn't — is my site the problem?#
Not necessarily just the site. The first move is to doubt what the added traffic is made of. If non-human bots or no-intent browsers are mixed in, no amount of traffic growth will move revenue. Split into the three layers — real, quality, landing — pinpoint which layer is leaking, and then move to site-side improvements; you'll have less rework.
Q2. Is chasing session counts meaningless?#
It has meaning, but on its own it misleads. Sessions are the base; they don't tell you whether the traffic moves revenue. Especially now that AI answers on the spot, low-intent traffic tends to fall. Rather than raw session counts, looking at how much intentful human traffic landed on a sale gets you closer to the truth of the business.
Q3. Does installing RevenueScope automatically improve traffic quality?#
It doesn't. RevenueScope is not a tool for raising quality — it's a tool for showing, on one screen, which layer is leaking revenue. It puts the numbers after bot removal, RPS by channel, and landing revenue by entry page on the same yardstick, as the material to decide which entry points to cut and which to grow. The improvement itself is made by people.
Q4. Can't ordinary analytics tools see layer 3's "landing revenue"?#
They can get partially close, but it gets structurally heavy. You have to attribute the purchase to the last entry page, across channels, on a clean base with bots removed, and rebuild it every month. RevenueScope re-sorts as landing revenue by entry page with that attribution cleaned from the start. That said, landing revenue is attributed to the last touch (the entry page), and it discloses that purchases made on another page after browsing lean toward the entry point.
Wrap-up: chase revenue that landed, not sessions#
When traffic goes up but revenue doesn't move, many managers try to grow traffic even more. But as this article showed, the cause is mostly in what the added visits are made of. That single number called "sessions" houses non-human traffic, traffic that doesn't move revenue, and traffic that never lands on a sale.
So what to look at isn't the height of the bar; it's the contents of the bar. Remove bots and casual browsers with "real," tell apart the revenue-moving traffic with "quality" (channel RPS), and narrow all the way to which entry point actually earned with "landing" (landing revenue by entry page). Where among the three filters it was cut most tells you the layer that's leaking revenue. Only when you see that far can you decide which entry points to cut and which to grow.
RevenueScope is the foundation for comparing these three layers — real, quality, landing — on one screen. It puts the numbers after bot removal, channel RPS, and landing revenue by entry page on the same yardstick, freeing you from the monthly ritual of rebuilding the three layers by hand across channels. What you chase isn't visit count — it's the real traffic that landed on revenue.
See which ads actually drive revenue, at a glance
Free up to 5,000 sessions/month, AI connection included. No credit card required. Up and running in 5 minutes.