On the sales analysis screen of MakeShop — an online store service widely used in Japan — choosing a period from April 2026 onward displays sessions, cart abandonment rate and CVR for each traffic source[1]. Revenue is displayed in a different shape: as store-wide order value, and as sales amount for each product[1]. Joining a traffic source to an amount on one row means adding GA4, and now the same month carries two revenue figures. Which number goes to which decision gets settled here.
Contents
TL;DR#
-
What is displayed by traffic source runs from sessions through CVR
Revenue is displayed store-wide and for each product
-
Reviewing by traffic source reaches back only to April 2026
Choose an earlier period and the section reads "no data"
-
Don't make the two numbers match — assign each of them a role
The confirmed amount is read in MakeShop, the allocation in GA4
1. MakeShop's Acquisition Analysis Goes as Far as CVR by Traffic Source#
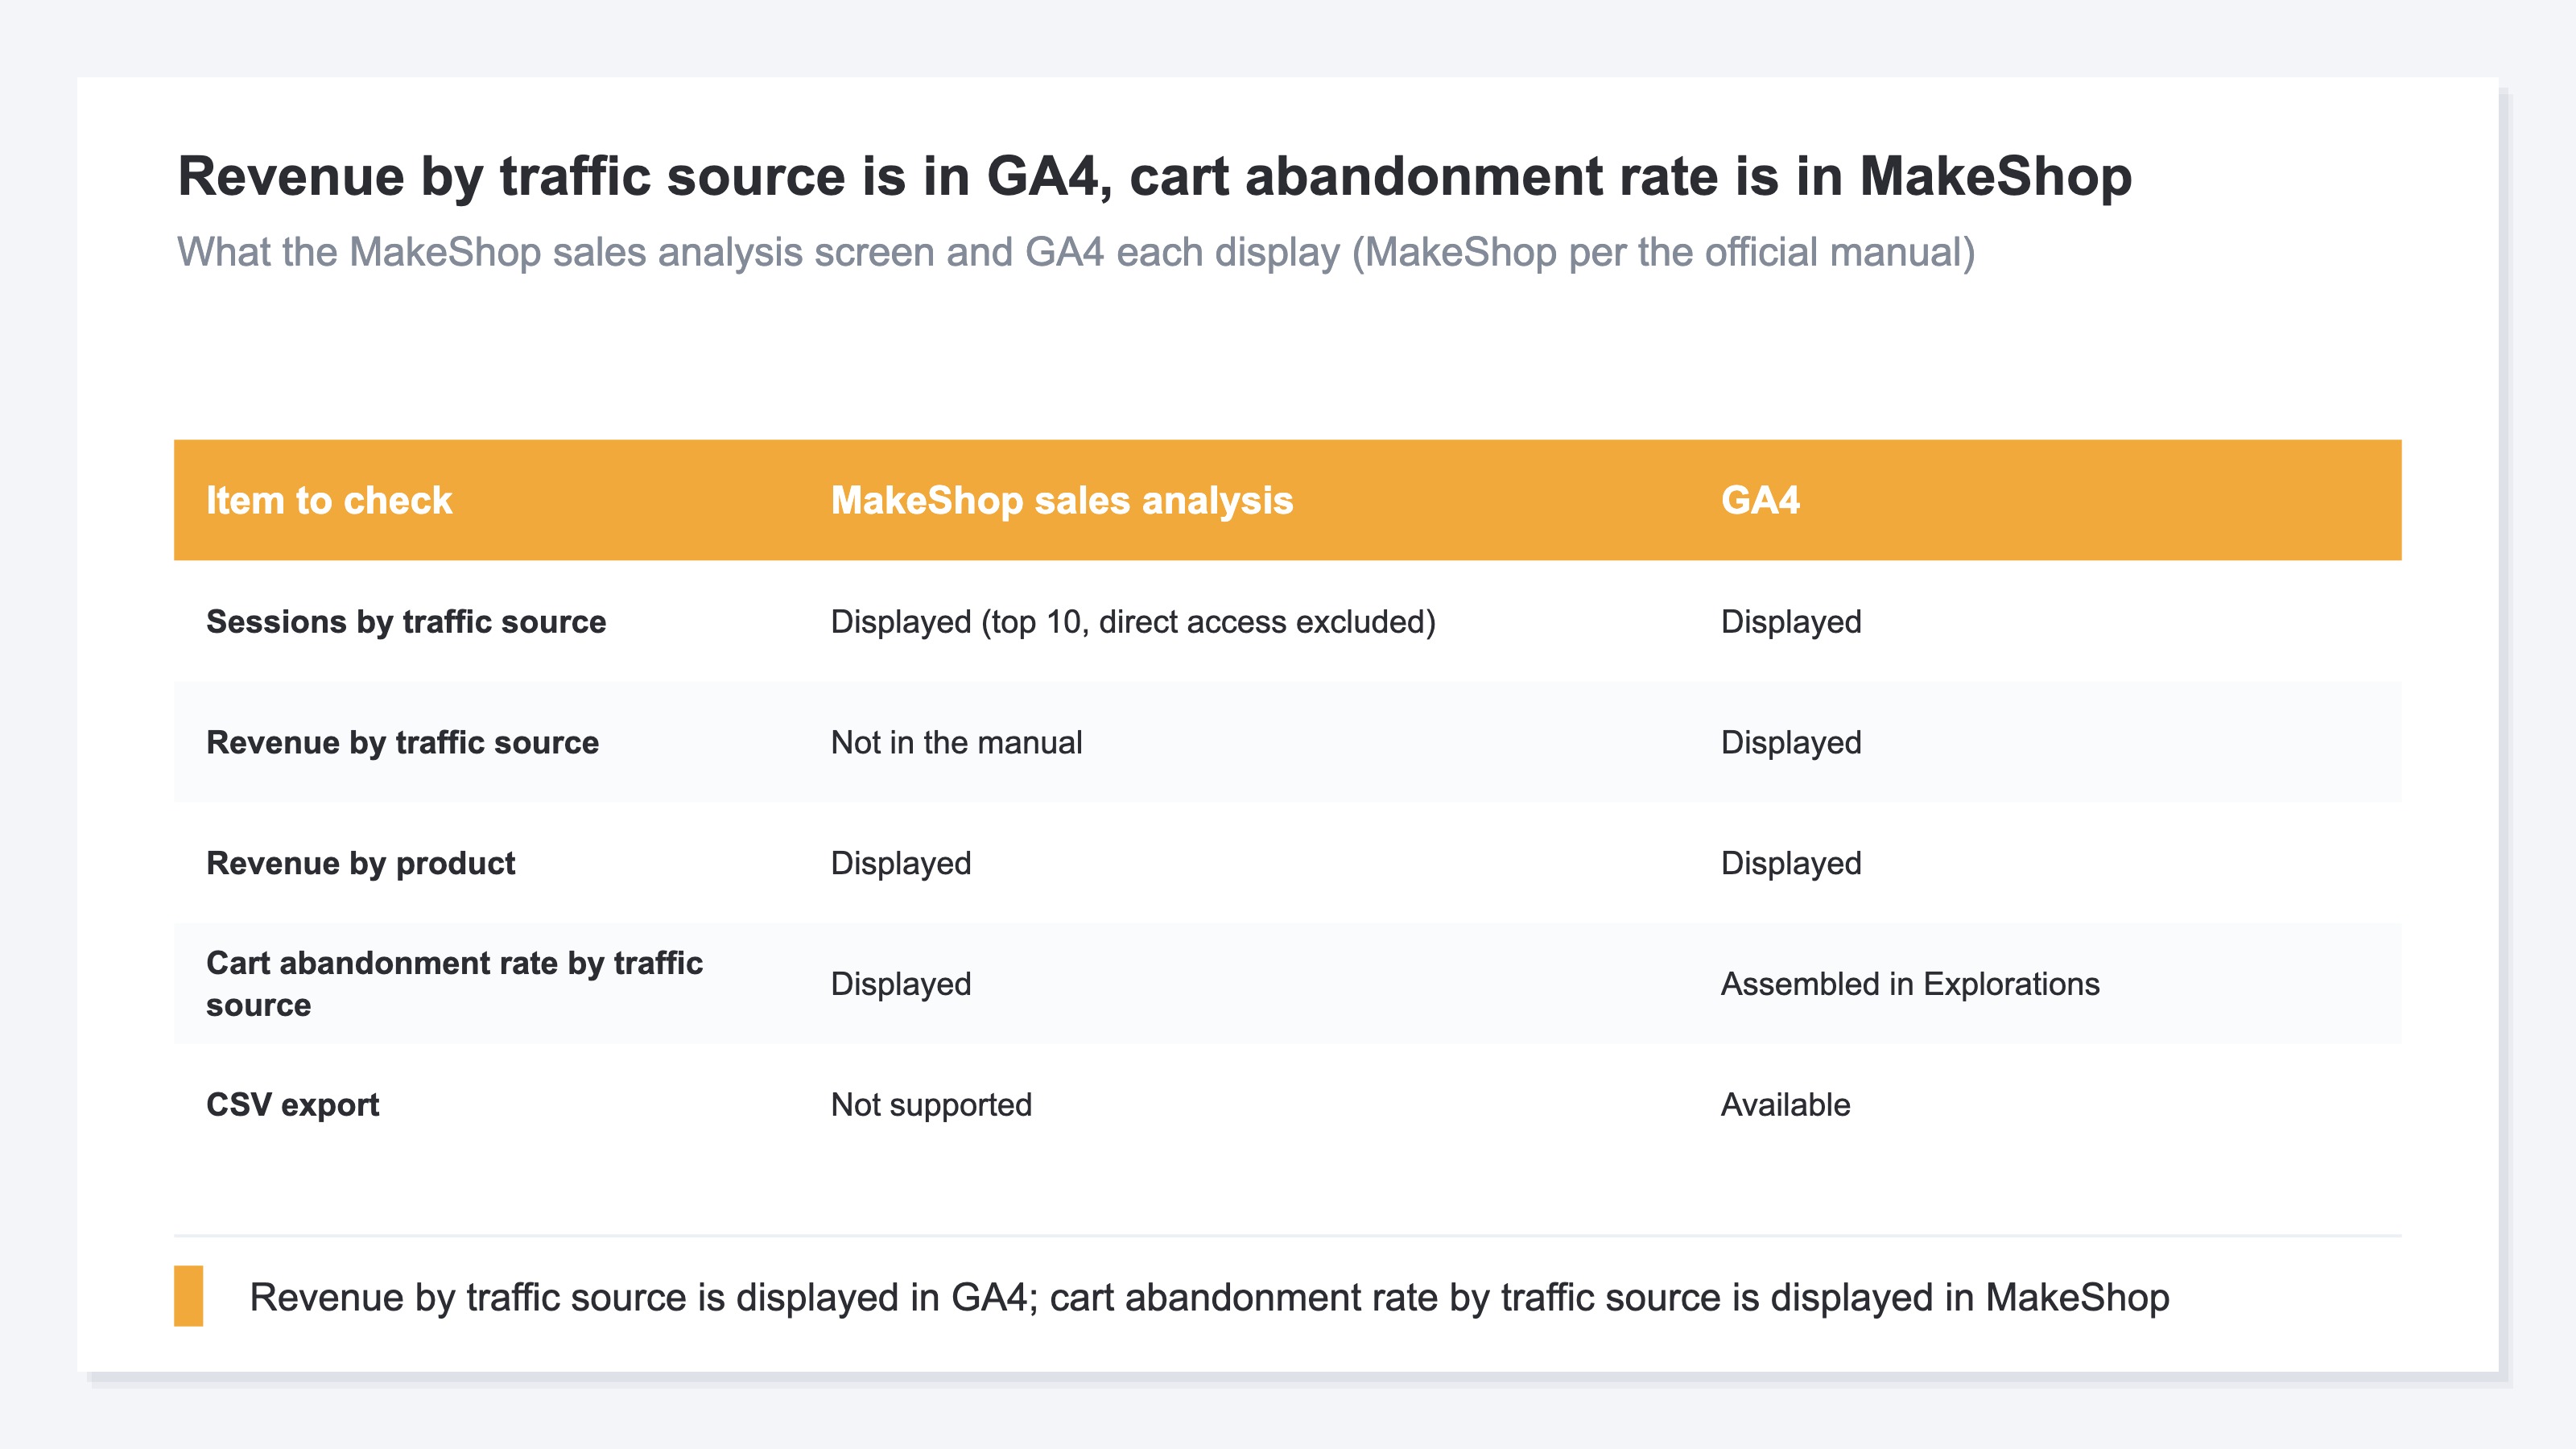
The MakeShop sales analysis screen is split into six sections: sales analysis, acquisition analysis, order analysis, member analysis, coupon analysis and product analysis[1]. Of these, the one that handles traffic sources is acquisition analysis, and viewing it requires the order management permission[1].
The sales analysis section at the top displays a sales summary card holding the order value (cancellations excluded, tax included) for "previous day", "last 7 days" and "this month" regardless of the period selected, together with a cumulative revenue graph stacking the order value for the selected period by day and by month[1]. How much the store sold as a whole reads from here.
Acquisition analysis displays the share of sessions by referring domain[1]. Sessions, pageviews, cart abandonment rate and CVR are also available for each domain[1]. Both are limited to the top ten, excluding direct access[1]. "Direct access" is MakeShop's on-screen wording for a visit with an empty referrer[1]. Those visits fall outside all three of the traffic-source rankings[1].
Getting cart abandonment rate for each traffic source is on the thick side for default analytics. How to read cart abandonment rate itself is covered in cart abandonment rate and revenue.
The same admin also carries the older "access statistics". What its access by domain shows is the visitor count and the ratio against all visitors[4]. It is supported in basic mode only[4]. As a traffic-source metric, the acquisition analysis on the sales analysis screen sits closer at hand.
Whether default analytics joins traffic source to revenue splits by online store service. For STORES, STORES analytics covers it.
2. Revenue Shows in Two Places: Store-Wide and Per Product#
The periods you can review by traffic source start from April 2026. Sales, coupon, product and member data goes back as far as 2024, but choose an earlier period and the acquisition and order data reads "no data"[1]. That date is the line at which the metrics readable per traffic source widened out from sessions through CVR. Revenue stayed where it was, in two other places.
The second place revenue is displayed is product analysis. Order count, units sold, sales amount, accesses, CV and CVR are displayed for each product[1]. The axis that breaks revenue apart is the product. Which route the visits that made the revenue came from isn't settled by holding the store-wide order value up against the sales amount per product.
There are other constraints. The data is updated by a nightly batch and displayed through the previous day[1]. Amounts are tax- and shipping-inclusive with cancellations excluded[1]. Output is limited to viewing on screen, and the aggregation granularity is daily and monthly[1].
The thinking behind reading revenue by traffic source in GA4 is covered in GA4 revenue by source and campaign.
3. Add GA4 and the Same Month Has Two Revenue Figures#
To take the conclusion first: put GA4 in and revenue by traffic source does come out. Two revenue figures for the same month come out with it.
The MakeShop admin has a field for entering the GA4 measurement ID[2]. The events it covers are five: purchase, begin_checkout, add_to_cart, view_cart and sign_up[2]. For shops that have registered a measurement ID, an integration that sends the purchase completion event to GA4 directly from MakeShop's server is also provided[2]. Holding this as a concept is enough here. The procedure is in the official manual.
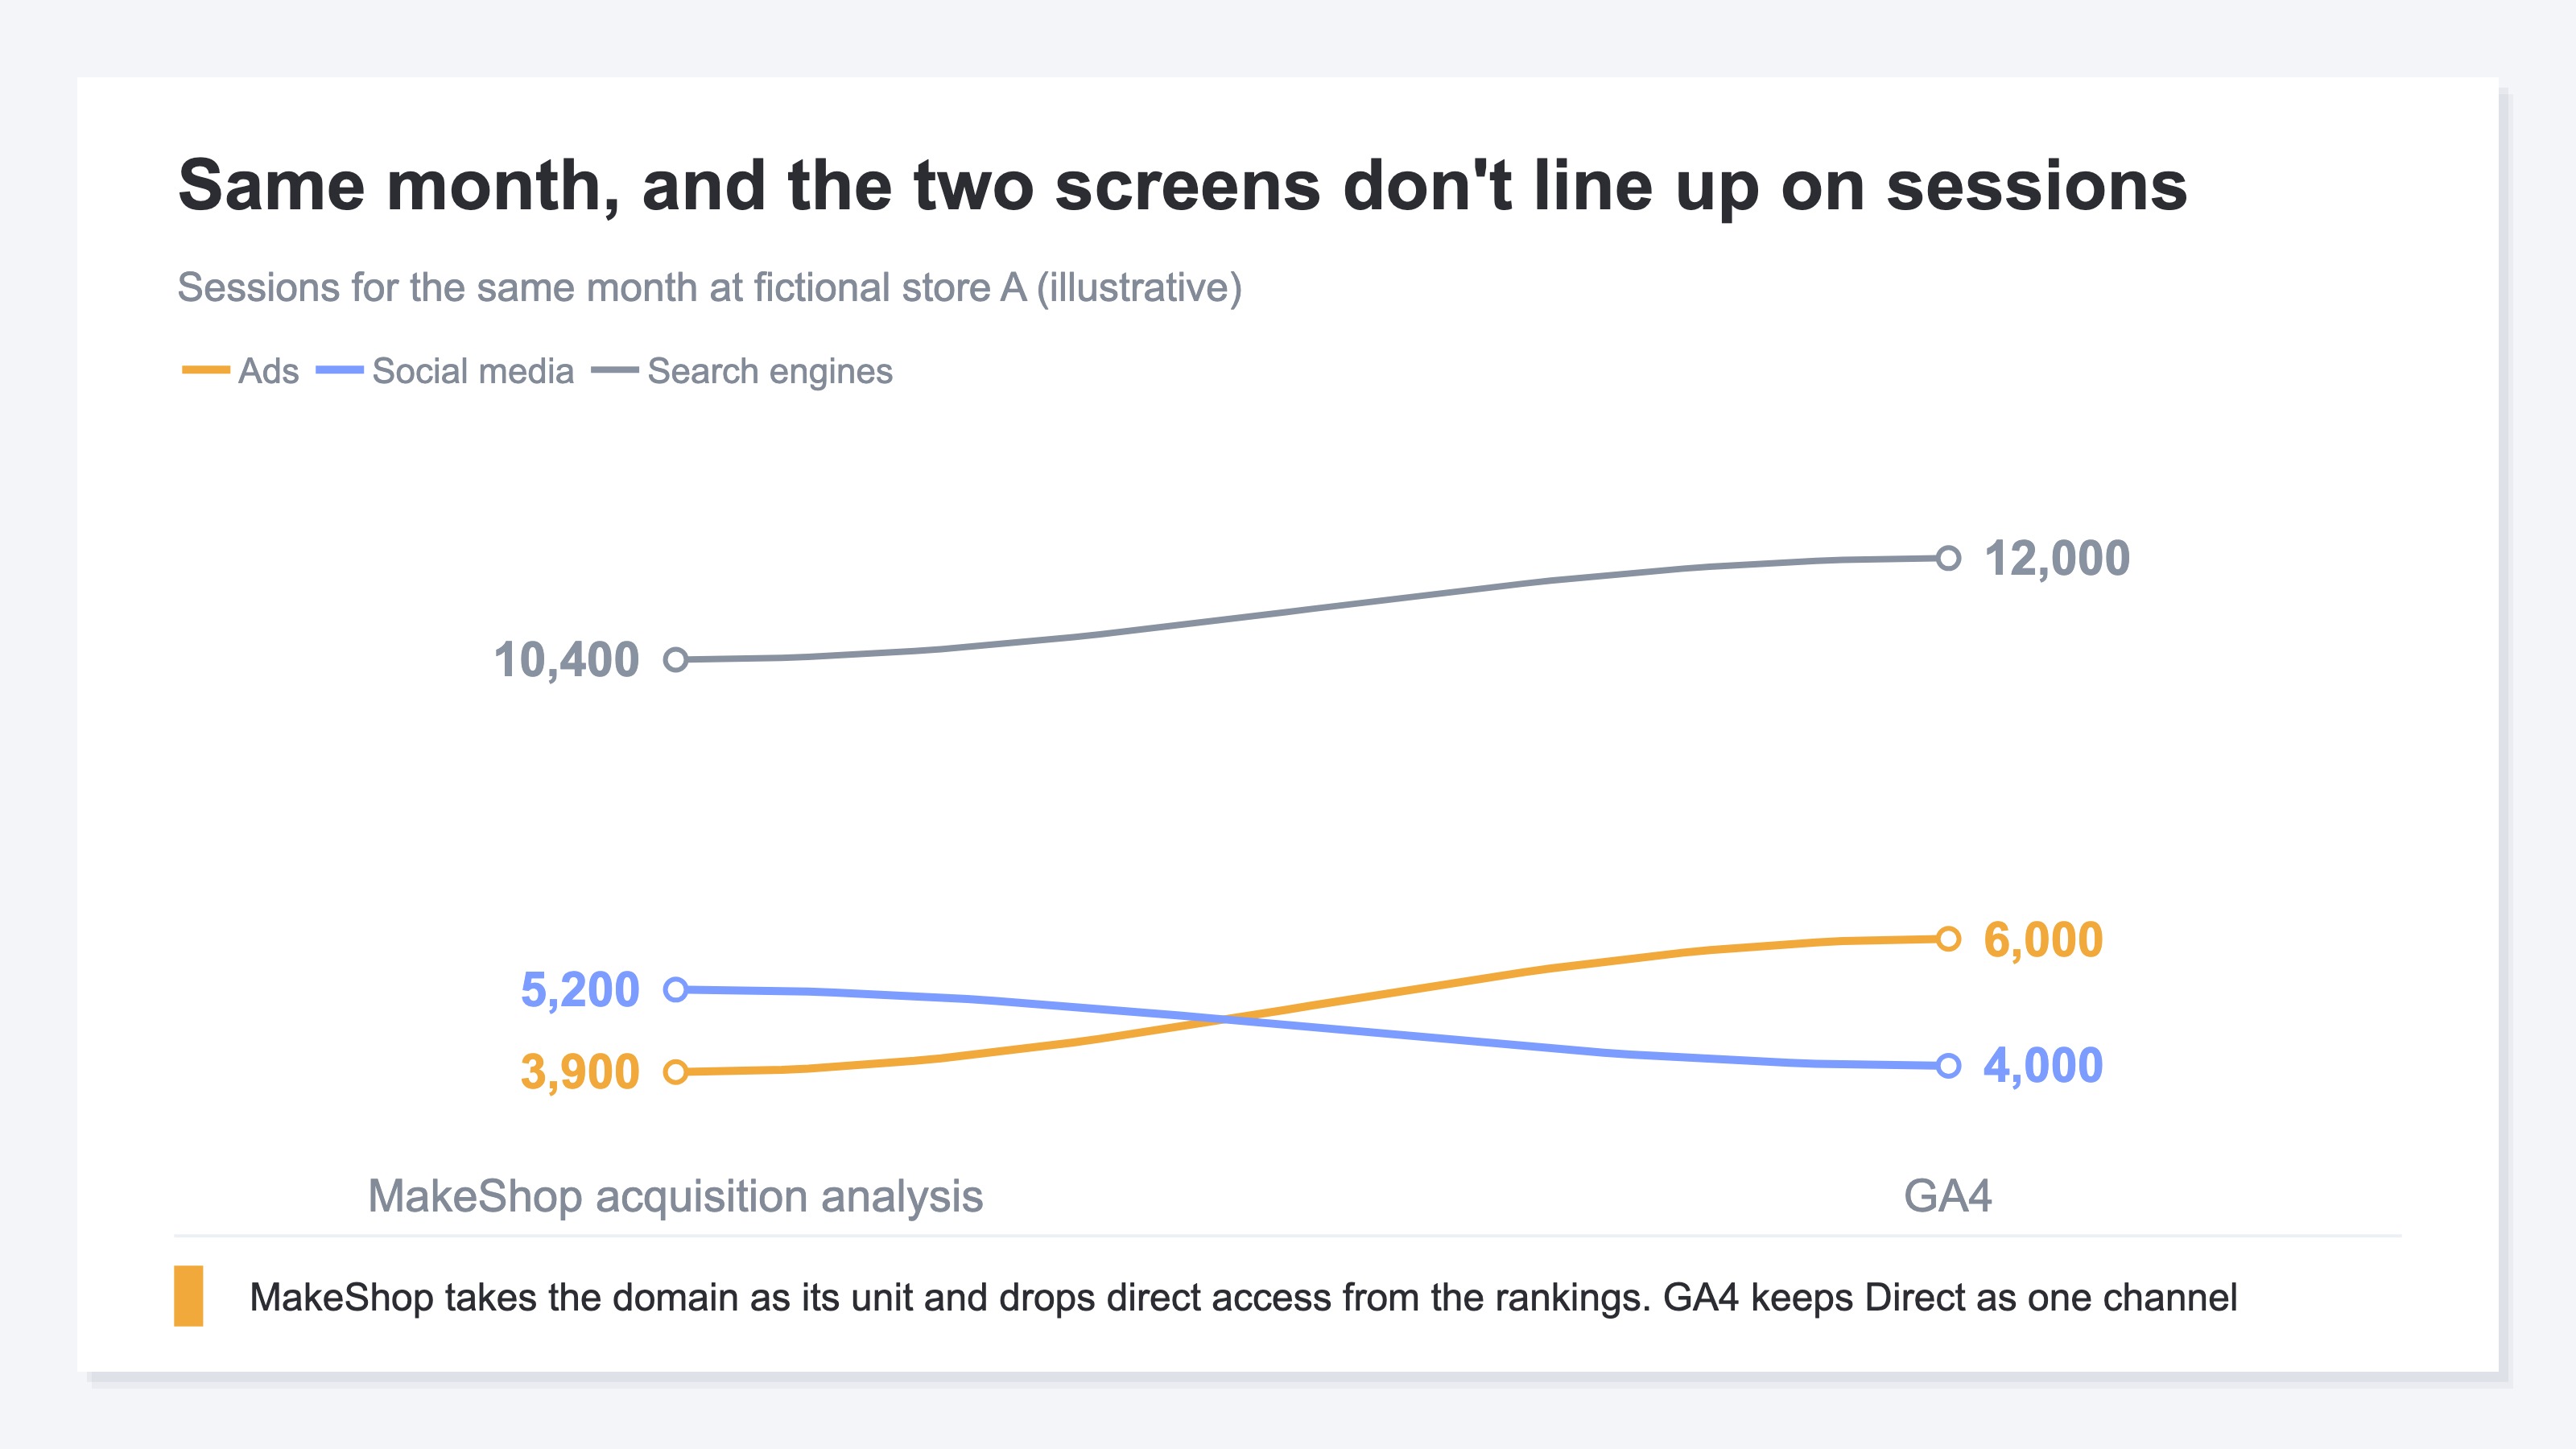
Where it trips you is after the measurement ID is registered. GA4 shows revenue by traffic source too, but look at the same month as the MakeShop sales analysis and the amounts don't match. The cause isn't precision, it's what is being aggregated. MakeShop aggregates through the previous day in a batch, tax- and shipping-inclusive with cancellations excluded[1]. A GA4 purchase event is recorded at the moment the tag fires, and it stays there after a cancellation. The argument over which number is correct is covered in GA4 purchase count higher than orders.
The unit of classification isn't lined up either. MakeShop's acquisition analysis takes the domain as its unit and drops direct access out of the rankings[1]. GA4 keeps Direct as one channel. What sits inside Direct is laid out in why GA4 Direct/(none) grows. With the domain as the unit, an ad click and an organic post land together as the same social domain.
The payment route overlaps as well. With credit card payments that carry 3-D Secure, the shopper can be moved to the card company's authentication screen partway through the payment[2]. This covers GMO-PG, Epsilon and Kuroneko Web Collect payments[2]. When it happens, the cross-domain tracking parameters aren't carried over, and the referrer can no longer be measured[2]. Without paid SSL and a custom domain setting, the domain of the payment screen becomes makeshop.jp[2]. That calls for an operation of registering the shop's own domain and makeshop.jp in the GA4 referral exclusion list[2]. If Amazon Pay is in use, the domain of its payment screen goes in as well[2].
Under the same name "CVR" there are two ways of arriving at the figure. In MakeShop, the sales analysis screen is CV divided by accesses, and the product detail analysis screen is CV divided by pageviews[1].
Before holding the two numbers up against each other, check the unit. MakeShop's acquisition analysis takes sessions as its denominator and closes orders on the confirmed portion with cancellations excluded[1]. GA4 takes the sessions where the tag fired as its denominator, and purchase events stay after a cancellation. The denominator differs, and so does the moment the aggregation closes. Compare a divided value month by month while the units differ, and whether what rose was revenue or what was counted stays unsettled.
4. GA4 Revenue for Allocation, MakeShop Revenue for the Confirmed Amount#
What MakeShop's sales analysis answers is the confirmed amount. Revenue with cancellations excluded, tax and shipping included, is displayed store-wide and for each product[1]. The monthly close, and deciding which product to hold more stock of, look here.
What GA4 answers is which route the visits that made the revenue came from. It is a projected amount that includes what was later cancelled, but GA4 is what breaks the figure apart by traffic source. Which channel to put next month's budget on reads from this number. Note that an item for entering ad spend isn't listed among the analytics features in the official manual[3]. The order completion screen can output a conversion tag that hands the order amount and other values to an external tool[5]. That is a mechanism for sending values out, and what receives them is the external tool.
Here is one month at fictional store A, read the way GA4 shows it. RPS means revenue per session, the figure you get by dividing revenue by sessions.
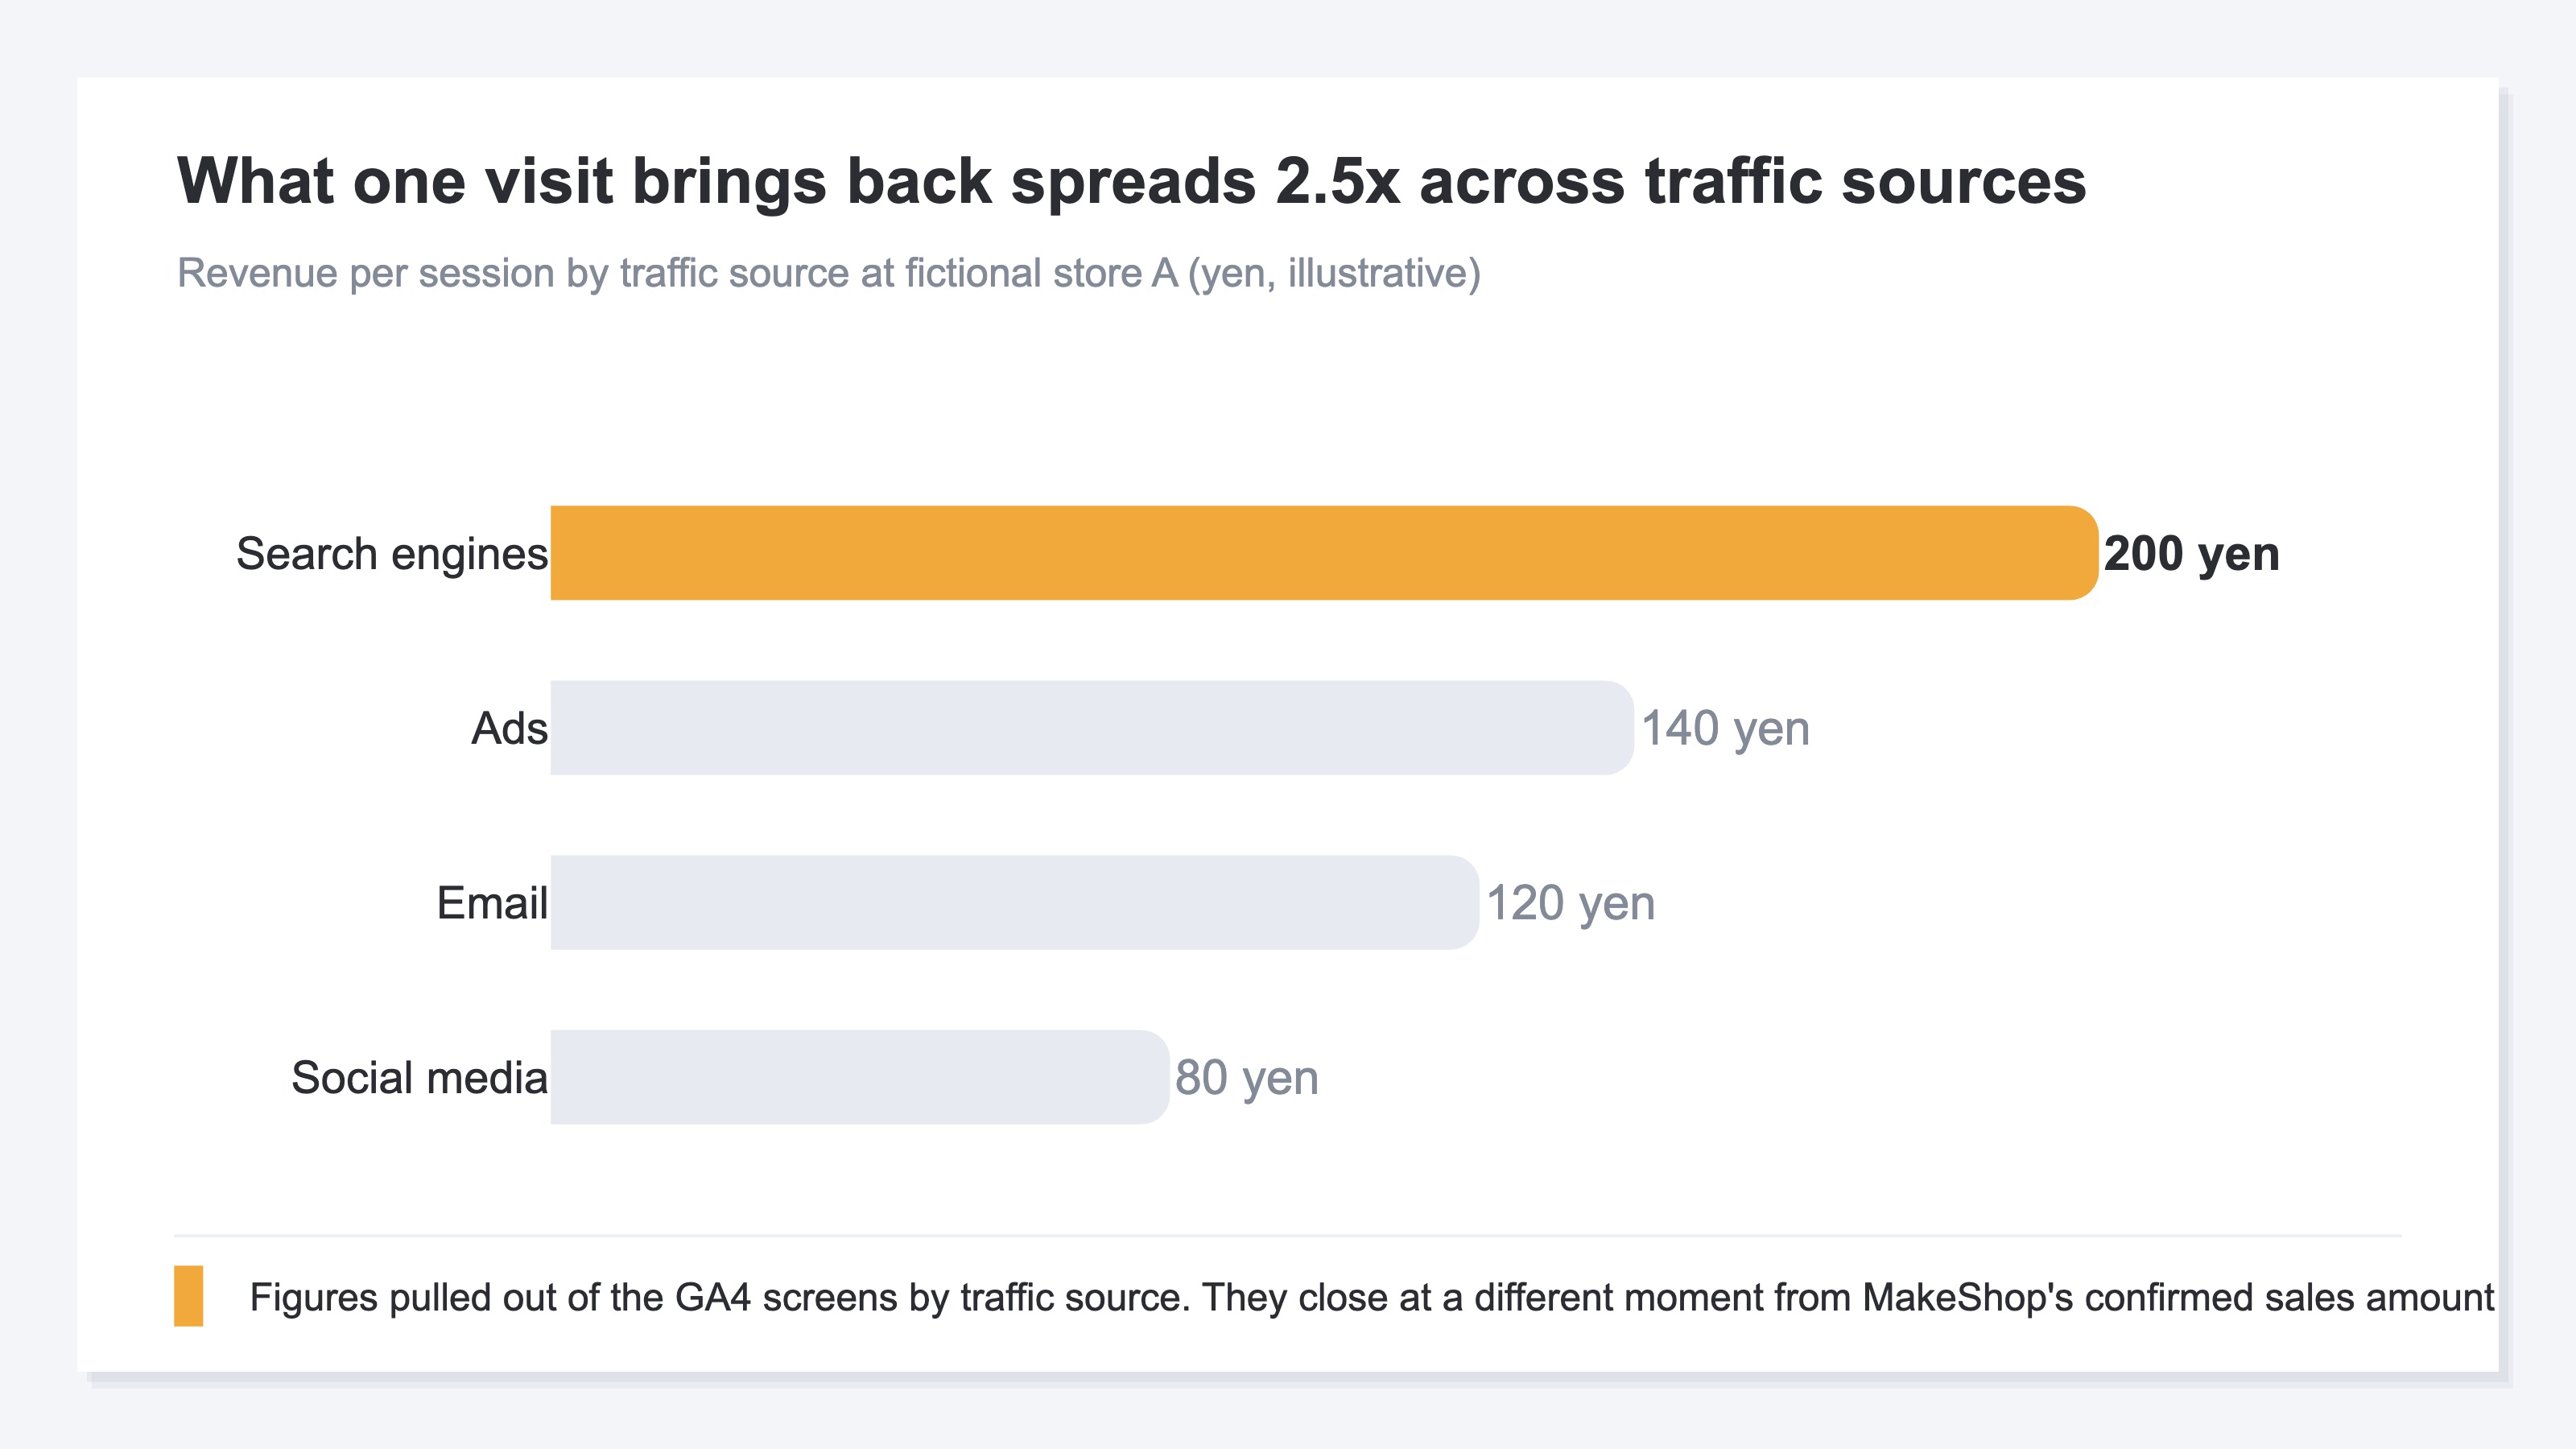
What a single visit brings back runs from ¥80 to ¥200 depending on the traffic source. The figures follow.
Fictional store A's RPS by channel (one month read in GA4, illustrative)
| Channel | Sessions | Revenue | RPS |
|---|---|---|---|
| Search engines | 12,000 | ¥2,400,000 | ¥200 |
| Ads | 6,000 | ¥840,000 | ¥140 |
| Social media | 4,000 | ¥320,000 | ¥80 |
| 1,500 | ¥180,000 | ¥120 |
This table was assembled by pulling each traffic source out of the GA4 screens. It closes at a different moment from the confirmed sales amount in MakeShop's product analysis. Cart abandonment rate sits in MakeShop's acquisition analysis, a value read on a screen separate from this table. Gather the three figures into one table and, with the denominators and the closing moments not lined up, what a divided value represents stays unsettled. And because the acquisition analysis doesn't support CSV export[1], this re-gathering stays manual work every month.
RevenueScope solution
MakeShop's acquisition analysis takes sessions as its denominator and closes on the confirmed portion, while GA4 stacks onto a denominator of fired tags with cancellations left in. RevenueScope fixes both the denominator and the closing moment to one each, and on that footing displays sessions, revenue and RPS for each traffic source in the same table.
Fictional store D's breakdown by channel (illustrative)
| Channel | Sessions | Revenue | RPS |
|---|---|---|---|
| Google search | 7,000 | ¥1,260,000 | ¥180 |
| Yahoo! Shopping | 2,500 | ¥300,000 | ¥120 |
| LINE | 1,800 | ¥270,000 | ¥150 |
| Price comparison sites | 900 | ¥90,000 | ¥100 |
Note: fictional store D is a set of figures put together for this article. The demo screen that opens from the CTA reads the sample store's sample data (refreshed daily), so neither the line-up of channels nor the amounts match the table above.
Google search, first by sessions, is top on RPS as well at ¥180. The only swap is between Yahoo! Shopping and LINE, and the leader doesn't change. What gets settled here is one thing: the route that comes off the list of candidates to cut in next month's allocation is Google search, and only that.
It is an ordinary table. Even so, deciding the allocation from a state where the leader is known not to change is a different thing from the stage of holding figures gathered from three screens up against each other. Revenue is aggregated by RevenueScope's own tracking, so it won't land on the same value as GA4's revenue, but sessions, revenue and RPS are displayed on one basis. The attribution model can be switched too, so the per-channel amounts that follow from changing which touchpoint revenue is assigned to read from that same table.
FAQ#
Frequently asked questions#
Q. Can I check revenue by traffic source with MakeShop's default features alone?
A. What acquisition analysis displays runs as far as sessions, pageviews, cart abandonment rate and CVR, with no entry for revenue[1]. Revenue is displayed store-wide and for each product, and product analysis breaks it apart on the product as its axis[1]. If an amount per traffic source is what you need, that means running an external tool such as GA4 alongside.
Q. MakeShop revenue and GA4 revenue don't agree. Should I go back over the settings?
A. It isn't necessarily a settings problem. MakeShop aggregates through the previous day in a batch with cancellations excluded[1], and a GA4 purchase event stays after a cancellation. With payments that pass through 3-D Secure, the referrer can also stop being measurable[2]. Deciding which one goes to which decision moves you forward faster than getting them to agree.
Q. I want to compare against the same month last year in acquisition analysis, but nothing shows. Why?
A. Because the acquisition and order data can only be checked from April 2026 onward[1]. Choose an earlier period and the section in question reads "no data"[1]. Sales, product and member data goes back as far as 2024[1].
Summary#
MakeShop's acquisition analysis displays sessions, pageviews, cart abandonment rate and CVR for each traffic source[1]. Revenue is displayed as store-wide order value and as sales amount per product, and a breakdown by traffic source isn't listed in the official manual[1].
Add GA4 and revenue by traffic source comes out, but the amounts don't agree even for the same month. MakeShop counts the confirmed portion with cancellations excluded[1], while GA4 records at the moment the tag fires. With payments that pass through 3-D Secure, the referrer itself doesn't survive[2].
Even with the roles assigned, the work of gathering sessions, revenue and cart abandonment rate from a separate screen each month remains. Because acquisition analysis doesn't support CSV export[1], that re-gathering stays manual. Before you start building the monthly report, decide which comes first: the confirmed amount, or the allocation by channel.
See which ads actually drive revenue, at a glance
Free up to 2,000 sessions/month, AI connection included. No credit card required. Up and running in 5 minutes.