
Say you sit down at the end of the month to review the split between ads and social. Orders don't rise on the side you increased, revenue doesn't fall on the side you cut, and revenue across the period lands where it did last period. If the screen you had open the day you decided the split was the Referrer URL screen, what sits there is a ranking by pageviews and nothing more. In Color Me Analytics — the default analytics app for Color Me Shop, an e-commerce platform widely used in Japan — order value appears on Basic aggregation and on Product analysis, while the metric the official help lists for the Referrer URL screen is pageviews. This article checks which screens show revenue, then goes as far as what it takes to tie that revenue to a traffic source.
Contents
TL;DR#
-
Order value shows on two screens: Basic aggregation and Product analysis
Store-wide and per product page, everything from order count through AOV is there
-
The only metric on the Referrer URL screen is pageviews
From the metrics the official help lists, revenue by traffic source doesn't follow
-
GA4 ecommerce setup is limited by plan, and what it measures is three events
Cart pages other than the purchase confirmation page can't hold a tag
1. Order Value Appears on Basic Aggregation and Product Analysis#
Color Me Shop's access analytics has moved from the earlier Access Plus to an app called Color Me Analytics. The menus you can analyze with are four — Basic aggregation, Product analysis, Referrer URL and Time of day — and a per-page access list has no announced release date[4]. It costs nothing on the Small, Regular, Large, Platinum and Premium plans. On the Free, Combined-use and Economy plans it is ¥880 a month[4].
Basic aggregation totals the store as a whole by week, month and year. What it displays is pageviews, visitors, order count, ordered items, order value, purchase rate and AOV[1]. Product analysis displays the same set per product page, adding product ID and product name to everything from pageviews through AOV[2]. It isn't that the revenue information is missing.
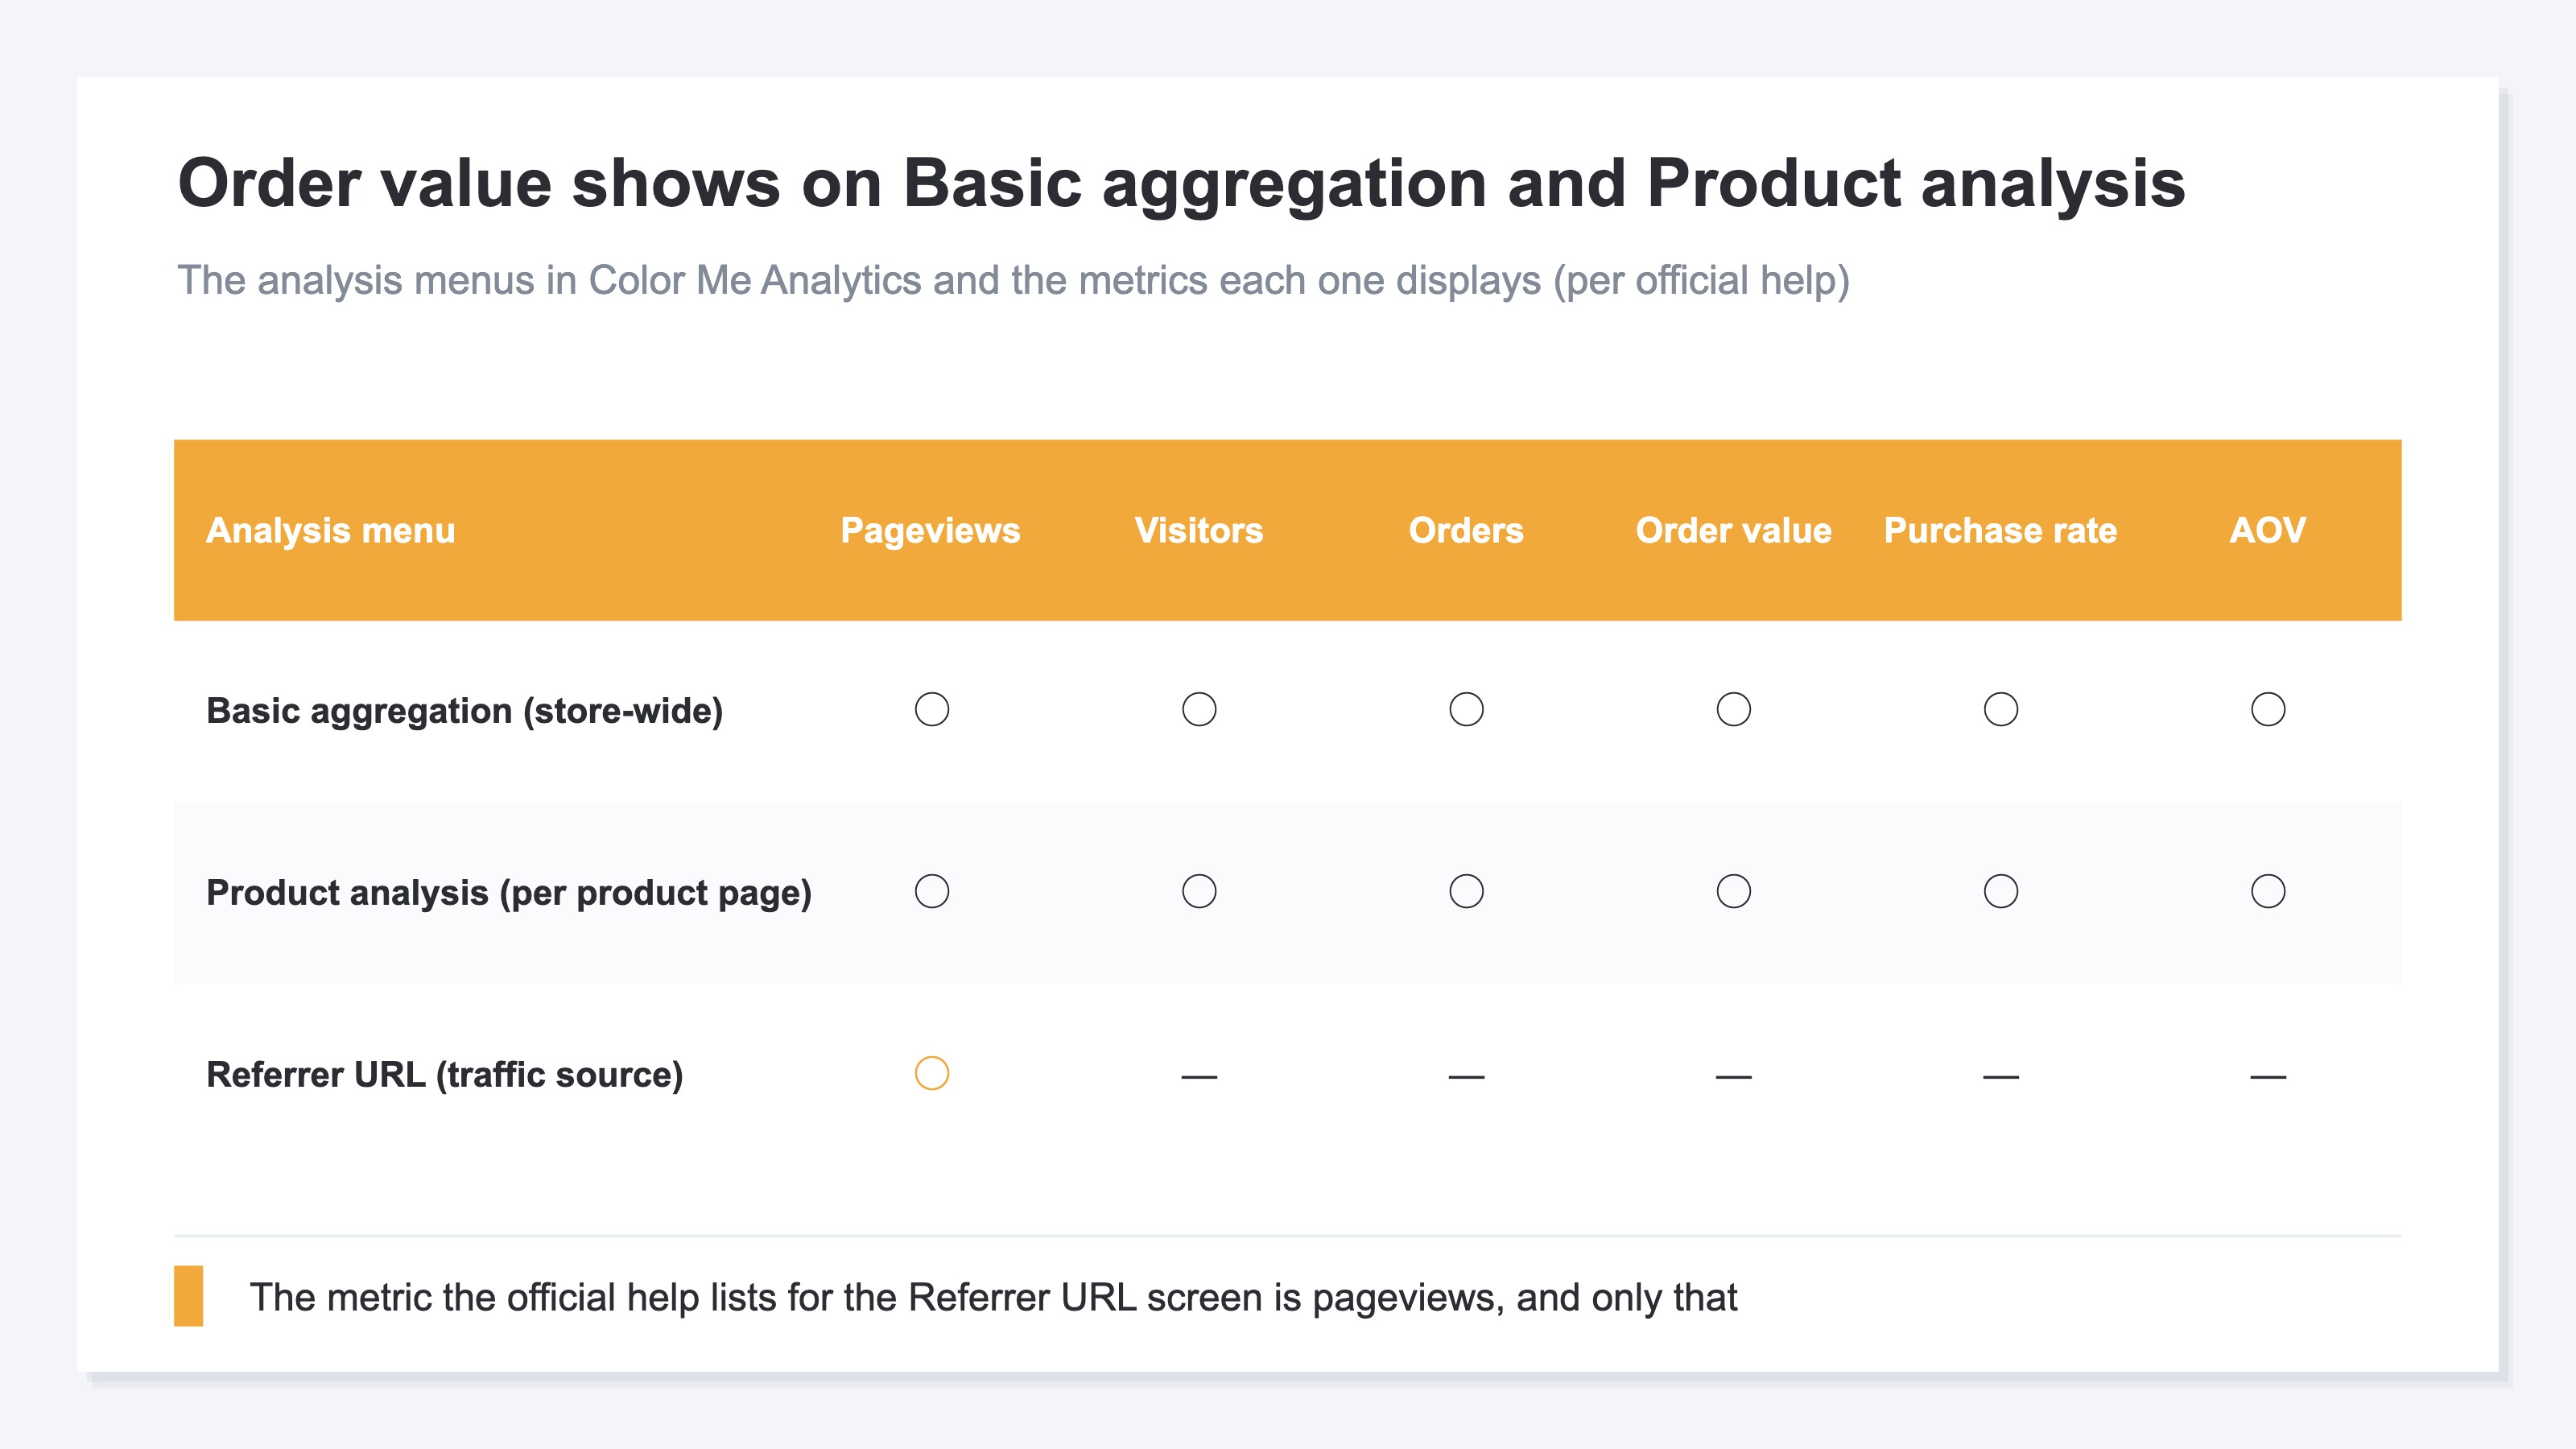
In the opening scene too, the order value itself sits inside the same admin. Open Basic aggregation and the order value for each period comes out; open Product analysis and the order value for each product page comes out. It still can't carry the allocation decision, because that revenue isn't in a form that ties to a traffic source.
What each online store displays by default differs. To weigh several services side by side, see channel analysis of four online stores.
2. The Referrer URL Screen Shows Pageviews Only#
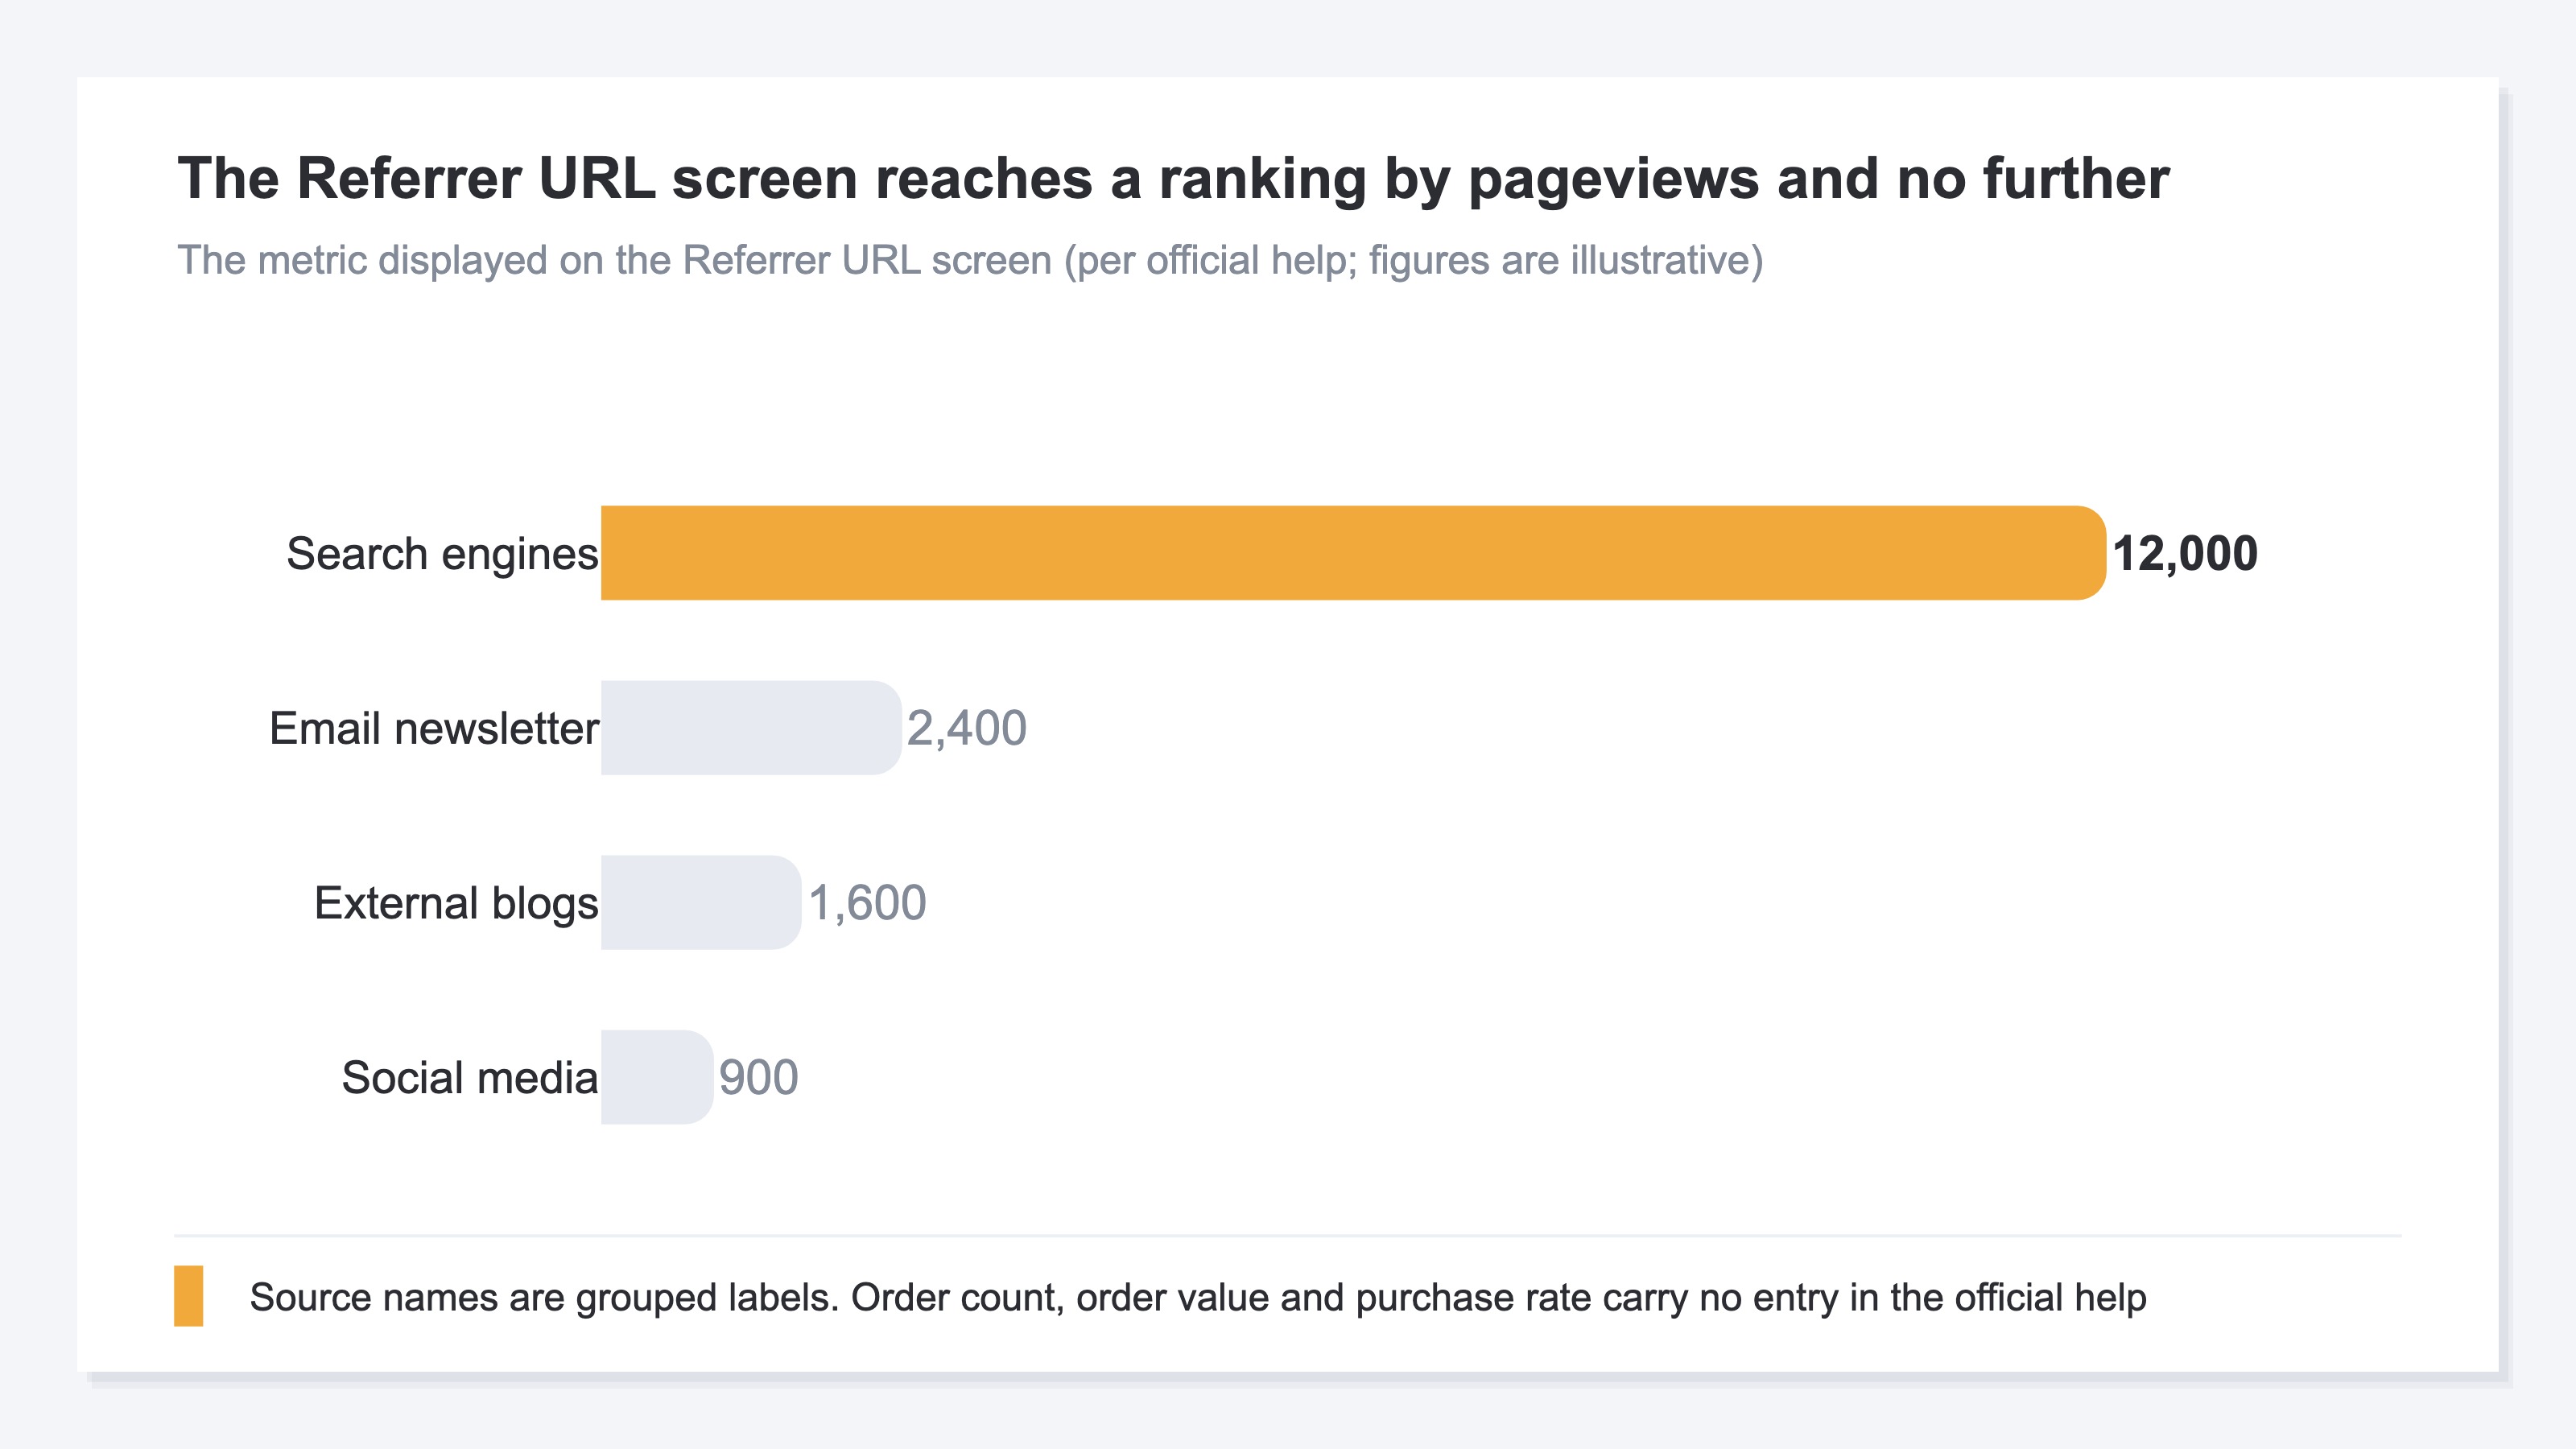
The metric the official help lists for the Referrer URL screen is pageviews, and only that[3].
Referrer URL is the menu for checking which site held the URL someone reached the store from[3]. URLs matching google.com, bing.com, search.yahoo.co.jp and goo.ne.jp are grouped into a form that drops the path[3]. Everything else is counted individually as a separate source[3]. Order count, order value and purchase rate carry no entry on the Referrer URL help page[3].
The per-product Referrer URL you open from the detail view in Product analysis works the same way. You can check sources at the level of a product page, but the metric displayed there is pageviews again[2].
Try to match the revenue up yourself and something has to be settled before you start. The order count, ordered items and order value in Color Me Analytics are the figures as of the moment the access totals were compiled[1]. The official help states plainly that they will not match the daily sales count, sales units and sales amount displayed in the admin[1]. Neither one is broken — they were compiled at different moments. Still, the moment you set out to produce revenue by traffic source, you begin by deciding which revenue figure to use.
The same shape of gap sits in other Japan-built online stores. With STORES analytics as well, the source is visible while revenue efficiency isn't what the default screens lead with. The thinking behind tying referrers to revenue is covered in what referral traffic is.
3. Adding GA4 Is Limited by Plan and by Which Pages Take a Tag#
For analyzing the process leading up to a purchase and the order details in depth, the official help points to the Google Analytics ecommerce setup[4].
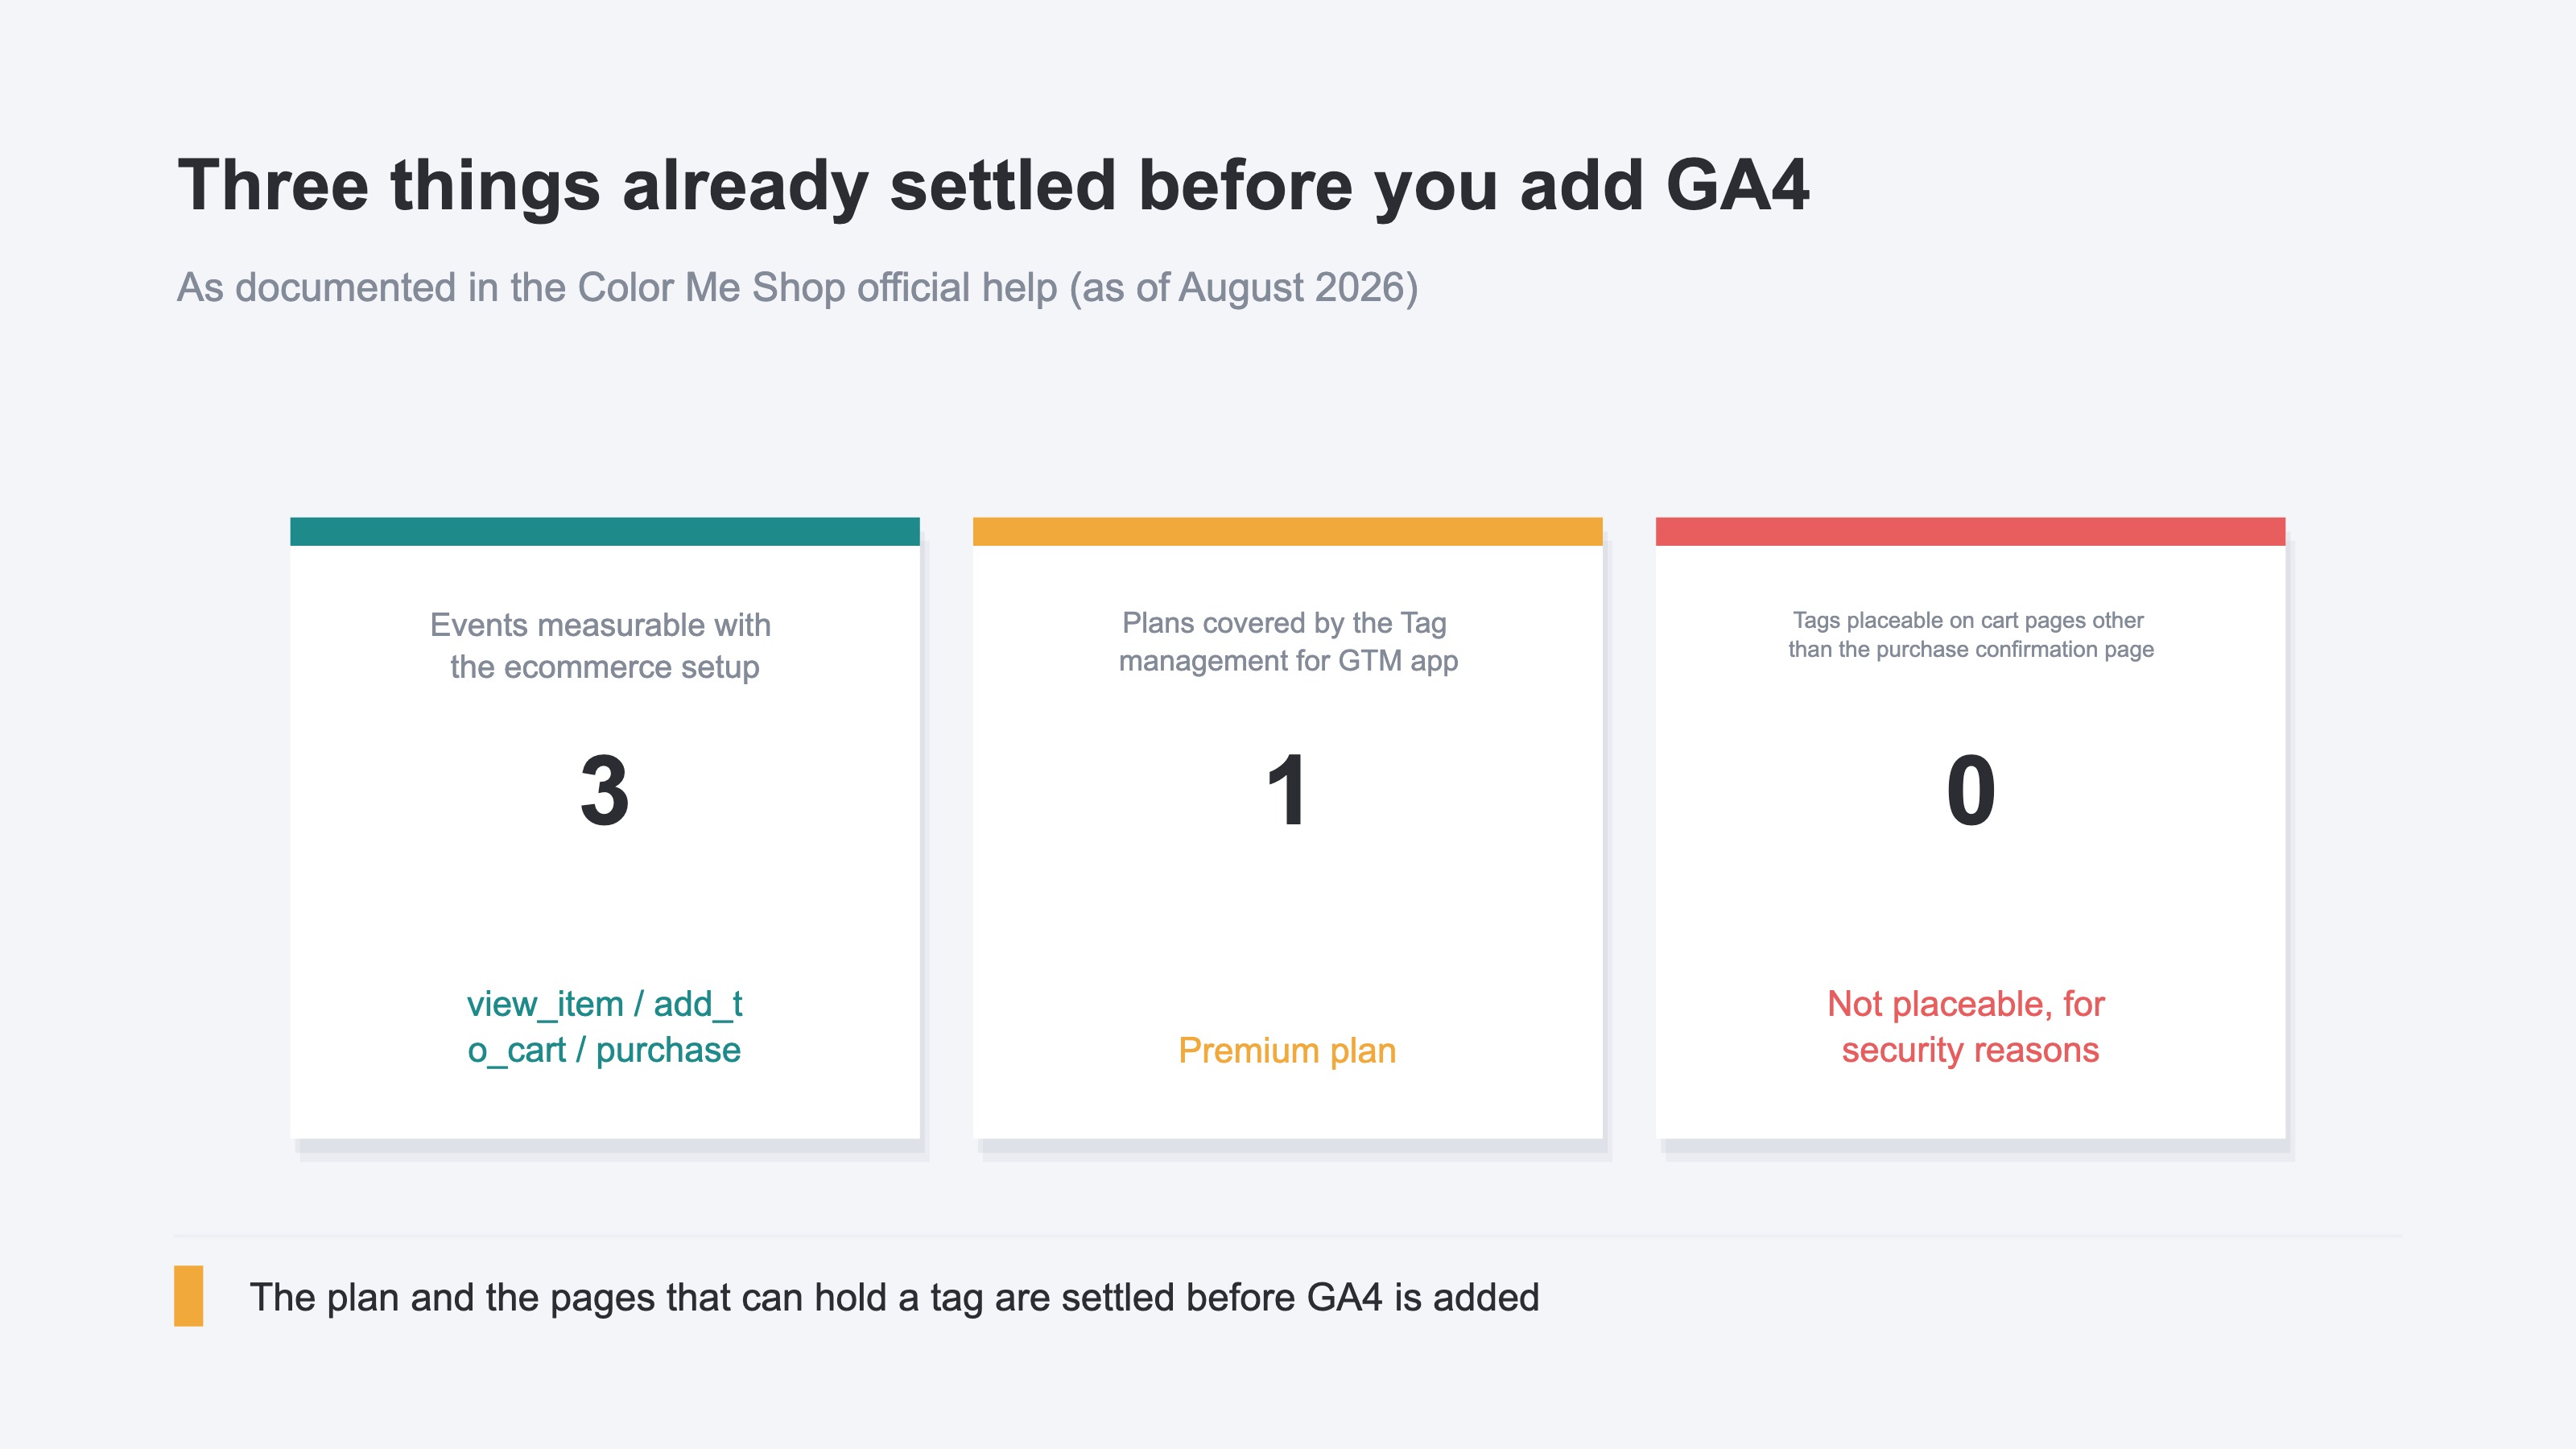
That ecommerce setup is available on the Regular, Large, Platinum and Premium plans[5]. What can be measured at present is three: view_item (a product view), add_to_cart and purchase[5]. Where someone left between adding to the cart and completing the purchase isn't something those three alone will tell you.
There are conditions on where tags go, too. Google Tag Manager is available through the Tag management for GTM app, and the plan it covers is Premium[6]. On the other plans there are two places a tag can go: the shared HTML/CSS editor, and the conversion tag slot on the purchase confirmation page[6]. And cart pages other than the purchase confirmation page can't hold a tag at all, for security reasons[6].
How far measurement reaches splits by online store service. Which carts support what is laid out in EC cart measurement compared.
So the means to step outside the defaults are provided, but the plan and the pages that can hold a tag are settled in advance. Even with the three events sending, checking revenue efficiency by traffic source takes separate assembly on the GA4 side. If you're at the stage of working out how far you need to go in the first place, choosing an EC analytics tool is worth a read.
4. Deciding by Pageviews Drops the Source With the Highest Revenue per Visit#
Take the moment you decide the ads and social split once more. What the Referrer URL screen lets you check is how many views came from which source, and no further. Shifting toward the sources with the most pageviews looks correct for as long as that screen is what you're looking at.
The order by pageviews and the order by revenue don't have to be the same, though. How much revenue a single visit turns into has a spread across sources. The source with the fewest pageviews carrying the highest revenue per visit is an ordinary occurrence. Watch pageviews alone and that relationship never surfaces.
On top of that, it's shaped so that the sense of not having checked never arrives. Revenue itself is displayed on Basic aggregation and on Product analysis both[1][2]. What's missing is neither revenue nor the traffic source, but the one screen where the two are multiplied together.
Come the moment of deciding the split, the question that needs answering shifts by one step. "Which source do we increase" is answered by pageviews. Answering "which source, increased, increases revenue" takes something separate from pageviews on the same screen: how much that source sold.
RevenueScope solution
In Color Me Analytics, Referrer URL and order value are split across separate menus. RevenueScope puts the two on one screen and takes each traffic source as far as revenue per visit (RPS). RPS is revenue divided by sessions, and it expresses how much revenue a single visit turned into. Revenue that tied to no channel is displayed as Unattributed.
Fictional Store L's breakdown by traffic source (illustrative)
| Channel | Sessions | Revenue | RPS |
|---|---|---|---|
| Search engines | 6,000 | ¥720,000 | ¥120 |
| Email newsletter | 1,400 | ¥210,000 | ¥150 |
| External blogs | 900 | ¥90,000 | ¥100 |
| Social media | 500 | ¥150,000 | ¥300 |
| Unattributed | — | ¥130,000 | — |
The table above is one example built for explanation. The demo screen uses the sample store's sample data (refreshed daily), so the figures there when you open it won't match these.
Social media, last of the four by pageviews, leads on RPS at ¥300. Set against search engines at ¥120, that is 2.5x. Revenue itself is ¥150,000, third overall, so following the size of revenue alone leaves it unnoticed. If the next place to add ad spend is being settled, social media is the candidate. It reaches ¥150,000 on 500 sessions, so doubling the visits brings revenue close to double at the same efficiency.
Search engines, for its part, is the source carrying the ¥720,000 of revenue itself. A low RPS doesn't turn it into something to cut. What changes here is the decision of which way to send the additional ad spend.
FAQ#
Frequently asked questions#
Q. Is there a way to check revenue by traffic source in Color Me Analytics?
A. The metric the official help lists for the default Referrer URL screen is pageviews[3]. The per-product Referrer URL you open from Product analysis is the same, listing pageviews[2]. Tying traffic source to revenue takes a means outside the defaults, such as the Google Analytics ecommerce setup the official help points to[4].
Q. The order value in Color Me Analytics doesn't match the sales amount in the admin. Which one is correct?
A. This discrepancy does not mean that either Color Me Analytics or the admin report is broken. The order count, ordered items and order value in Color Me Analytics are the figures as of the moment the access totals were compiled[1]. The official help states plainly that they will not match the daily sales count, sales units and sales amount displayed in the admin[1]. They were compiled at different moments.
Q. If we put in the GA4 ecommerce setup, can we see where inside the cart people left?
A. What can be measured at present is three: view_item, add_to_cart and purchase[5]. Where someone left after adding to the cart isn't something those three alone will tell you. On top of that, the Google Tag Manager app covers the Premium plan, and cart pages other than the purchase confirmation page can't hold a tag[6].
Summary#
In Color Me Analytics, order value is displayed on two screens: Basic aggregation and Product analysis[1][2]. For Referrer URL, the metric the official help lists for the screen is pageviews, with no entry for order count or order value[3]. It isn't that the revenue information is absent — it's that it isn't in a form that ties to a traffic source.
The official help points to the Google Analytics ecommerce setup for analyzing the process up to purchase in depth[4]. It is available on Regular and above, and what it measures is three: view_item, add_to_cart and purchase[5]. The Google Tag Manager app covers the Premium plan, and cart pages other than the purchase confirmation page can't hold a tag[6].
Whether a screen can carry the basis for an allocation decision comes down to whether it answers "which source, increased, increases revenue." On a screen where that answer comes out, ad spend goes first to the sources with the highest revenue per visit.
See which ads actually drive revenue, at a glance
Free up to 2,000 sessions/month, AI connection included. No credit card required. Up and running in 5 minutes.
References#
- [1] Color Me Shop "Color Me Analytics (app): Basic aggregation" (2026)
- [2] Color Me Shop "Color Me Analytics (app): Product analysis" (2026)
- [3] Color Me Shop "Color Me Analytics (app): Referrer URL" (2026)
- [4] Color Me Shop "Color Me Analytics (app)" (2026)
- [5] Color Me Shop "How to set up Google Analytics (GA4) ecommerce" (2026)
- [6] Color Me Shop "Can I use Google Tag Manager (GTM)?" (2026)