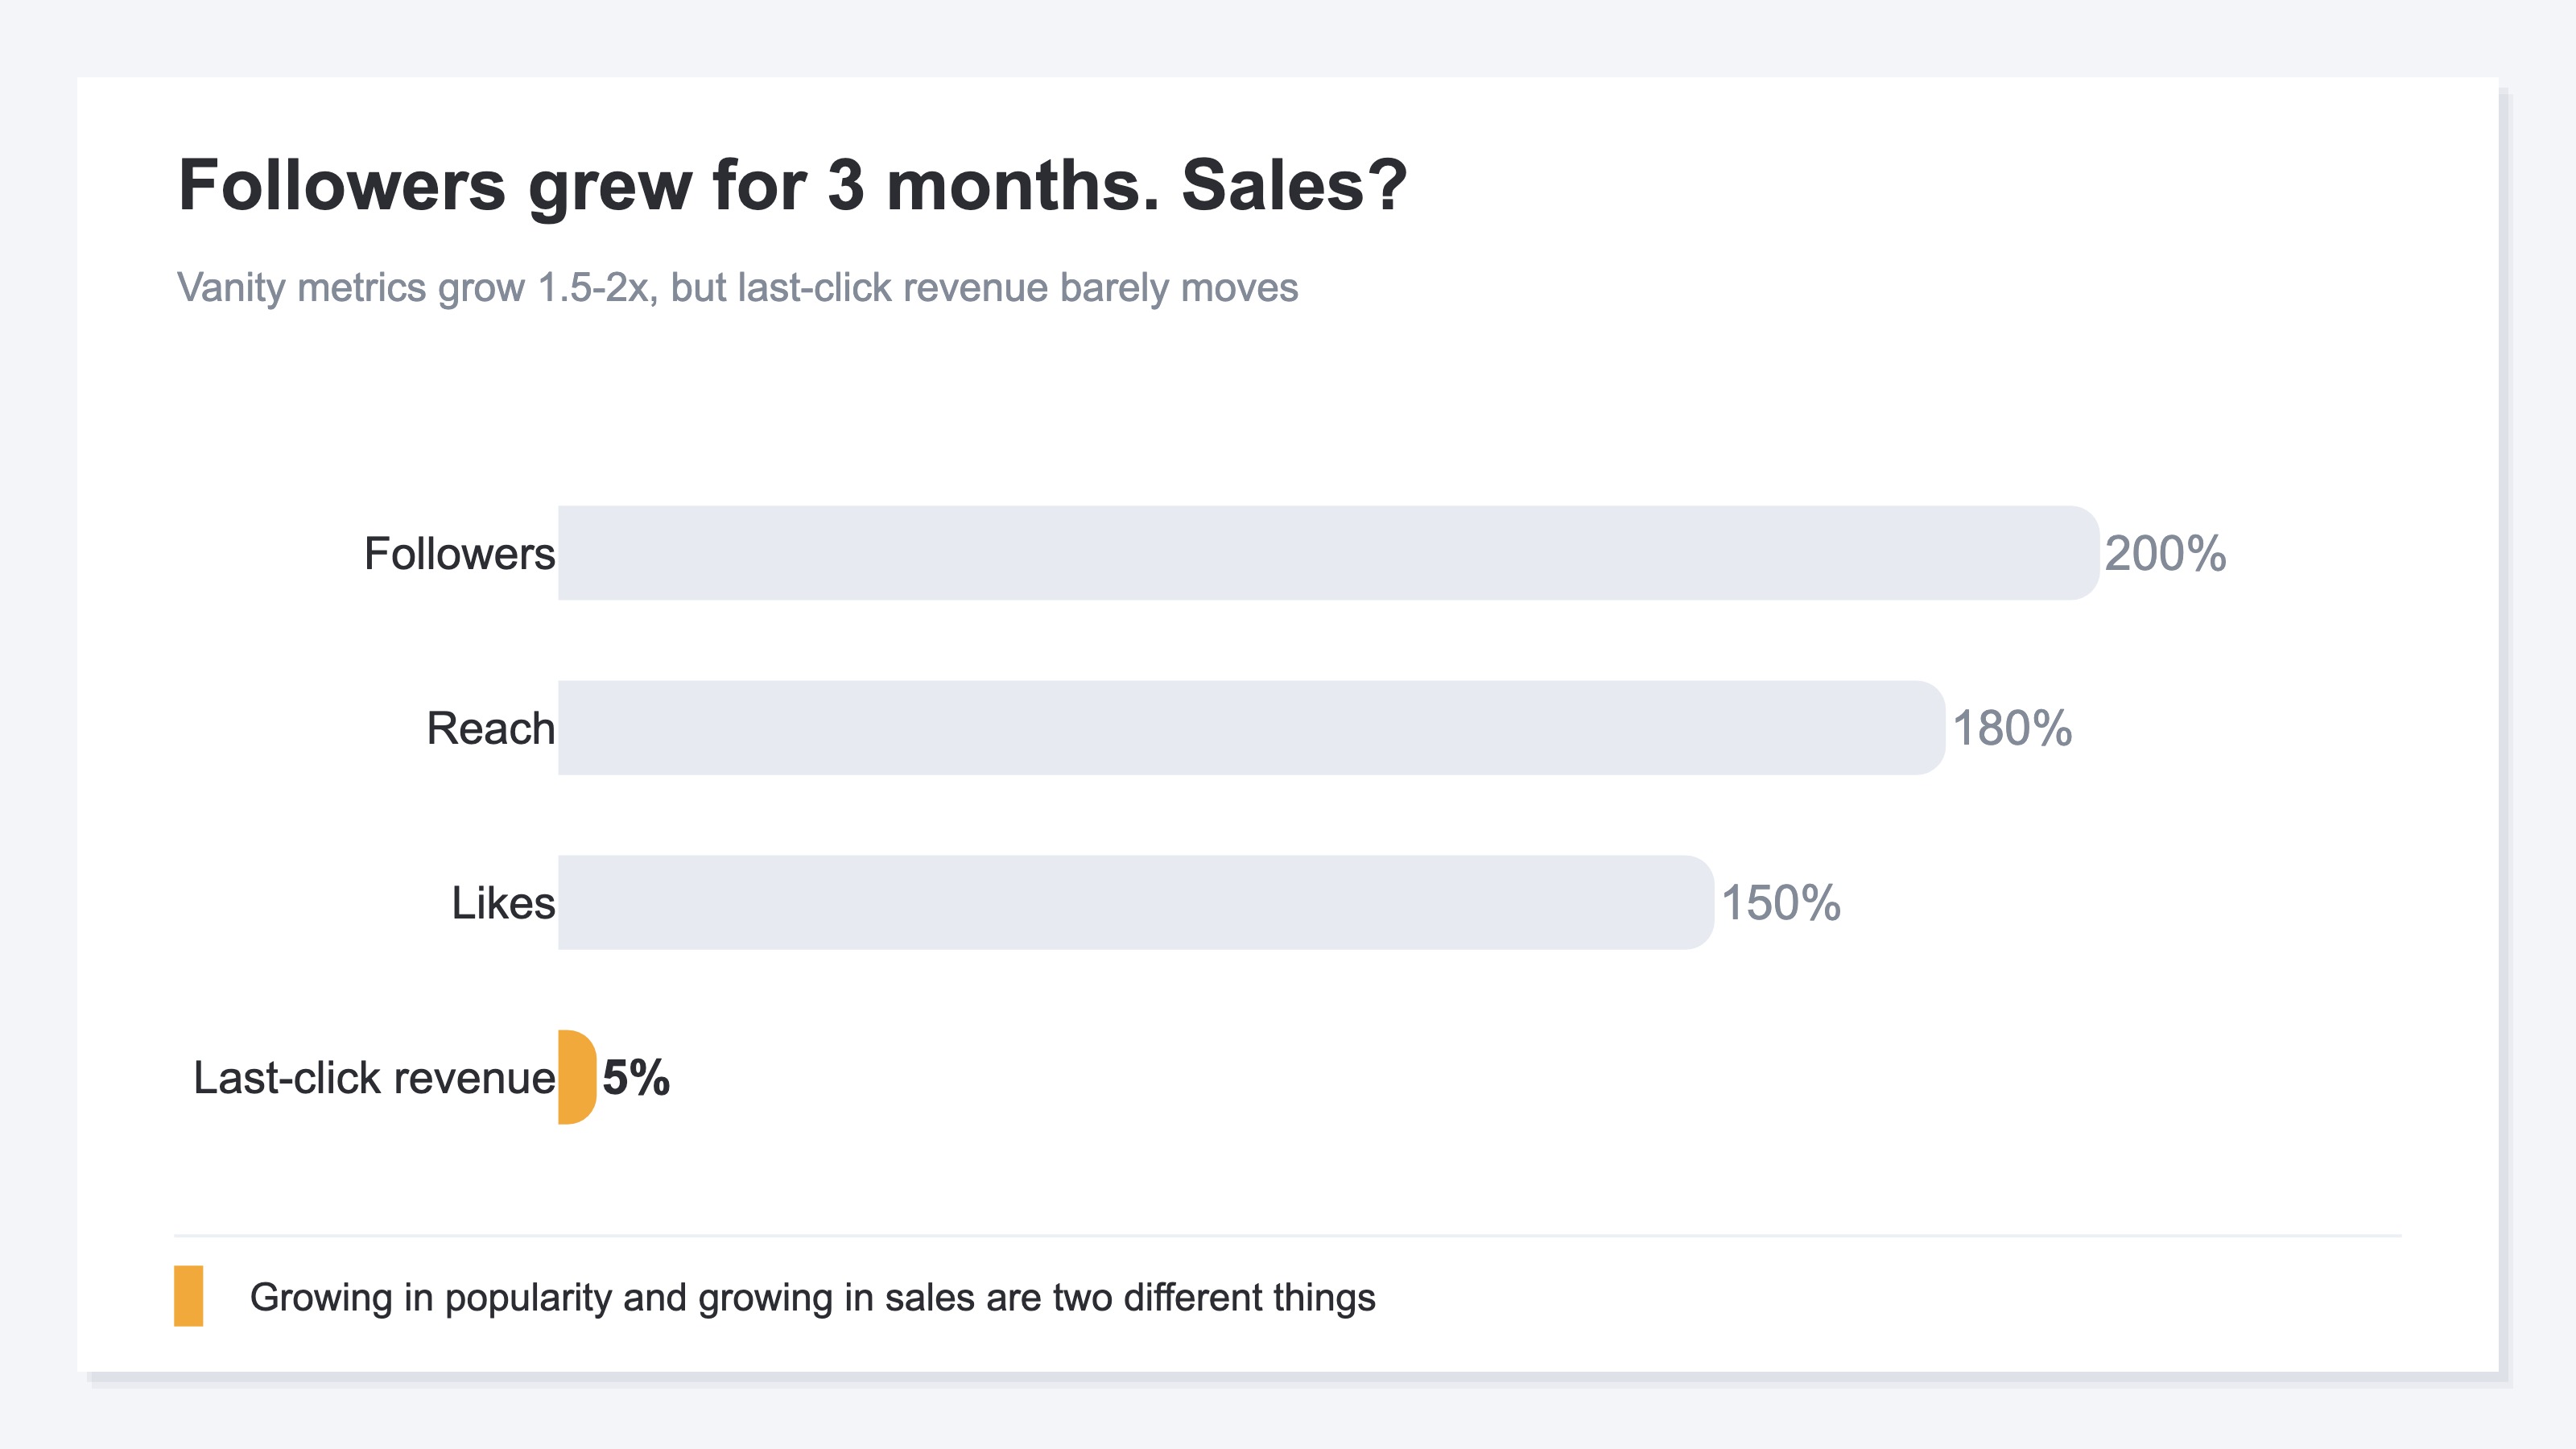
"My Instagram passed 10,000 followers and the likes keep coming — but online sales have barely moved." It's one of the most common frustrations in ecommerce. Posts perform, saves climb, yet the register stays quiet. So owners start to wonder whether Instagram marketing is worthless.
Before jumping to that conclusion, there's one thing to check: whether you're measuring Instagram's effect with the right numbers at all. Followers and likes have almost nothing to do with whether Instagram drives revenue. This article explains why Instagram looks "ineffective," and how to measure its real contribution — by the new visitors it brings and what they buy later, not by followers.
Table of Contents
TL;DR#
-
Followers, likes, and reach are popularity metrics, not sales metrics
When the numbers grow but sales don't, you're measuring something that isn't tied to revenue
-
Instagram's job is getting discovered by people who don't know you yet
Different work from search, which catches ready buyers — and it pays off on a time lag
-
So judged on last-click revenue alone, Instagram looks "ineffective" forever
What to watch: how much the new visitors it brought buy later
-
Split new from returning, and capture the time-lagged contribution
Cut the new-visitor entry point, and you cut off your future returning customers
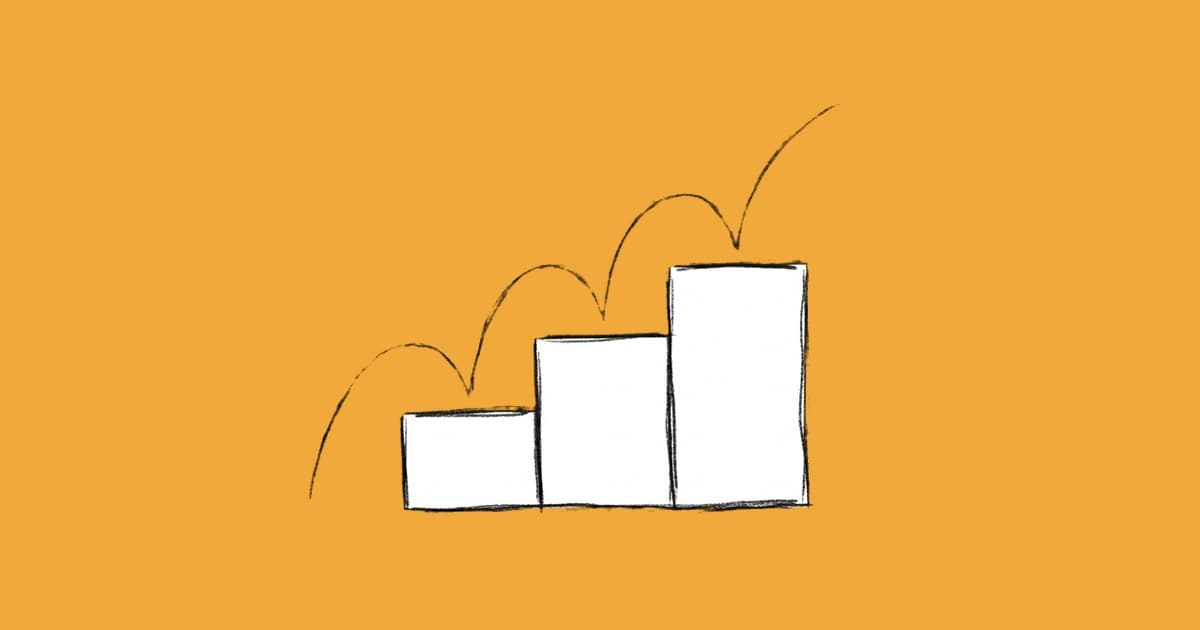
1. Why followers grow but sales don't#
Bottom line: followers, likes, and reach measure how popular you are, not how much you sell.
The metrics Instagram puts front and center — follower count, likes, reach — all describe how many people saw and enjoyed a post. None of them tell you whether those people bought. It's easy for "grow this number" to quietly become the goal. But popularity and revenue are different things, measured with different numbers.
Posts with high view counts are often just watched and scrolled past, which doesn't translate to intent. Instagram ads also appear while people are relaxing and browsing, so many "just tapped out of mild curiosity." Social traffic also tends to convert at a lower rate than search, as ad benchmark data shows[3].
So there's no guaranteed link between "followers went up" and "revenue went up." Popularity and revenue have to be measured with different numbers.
2. Instagram's real job is getting discovered#
Bottom line: Instagram isn't where you catch people ready to buy now — it's where people who don't know your store yet first discover it. Different role, different way it pays off.
Acquisition channels play two roles. One is catching people who already want to buy — search ads catching someone typing "leather tote bag commute," for instance. The other is getting discovered by people who don't know you yet. Instagram posts and ads are built for the second.
This is the key point. A channel whose job is getting discovered isn't meant to close a sale on the spot. Someone meets your store on Instagram, then comes back days later via search or a bookmark to buy. Paying off on a time lag is exactly how this kind of channel is supposed to work.
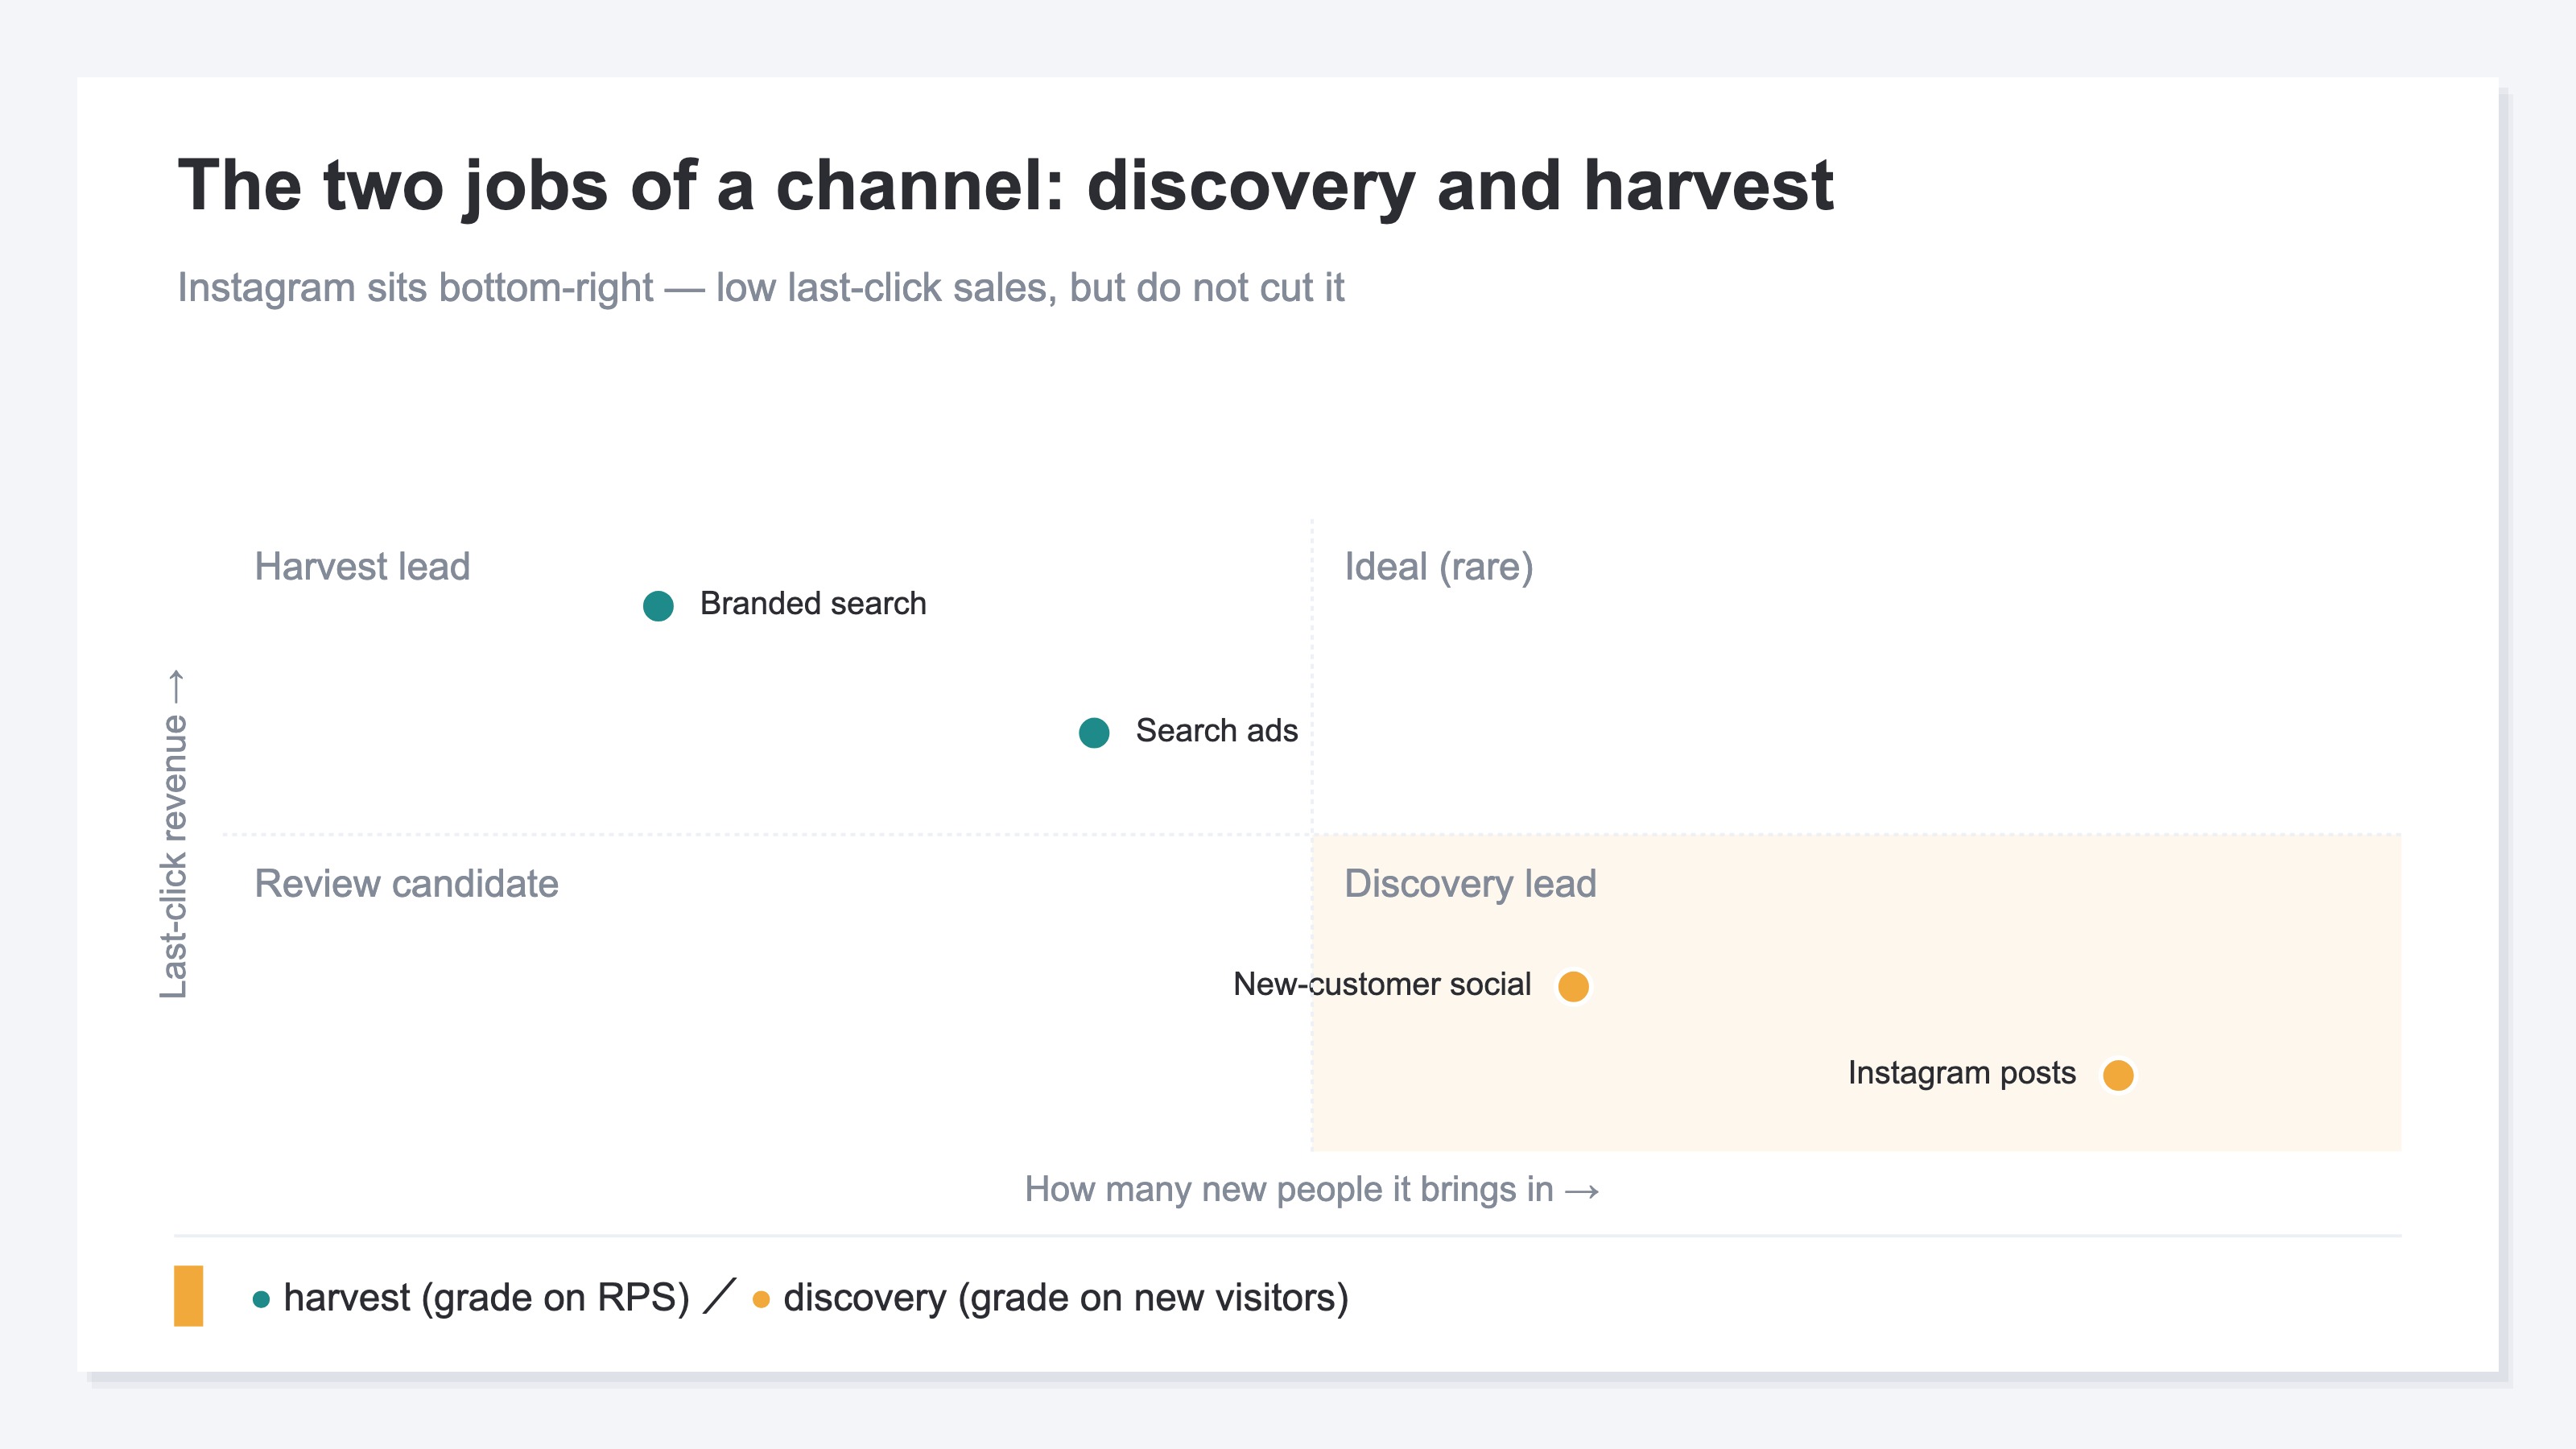
Search catches people who already want to buy, so revenue per session is the right way to grade it. New-customer social is there to get discovered — judging it on last-click revenue makes it look terrible forever. That's not the channel failing; it's grading an entry-point channel on an exit-point number.
3. Measure new-visitor purchases, not followers#
Bottom line: judge Instagram by "how many new visitors it brings, and how much they buy later" — not by followers or last-click revenue.
Once you know Instagram's job is getting discovered, the numbers to watch are clear — three of them:
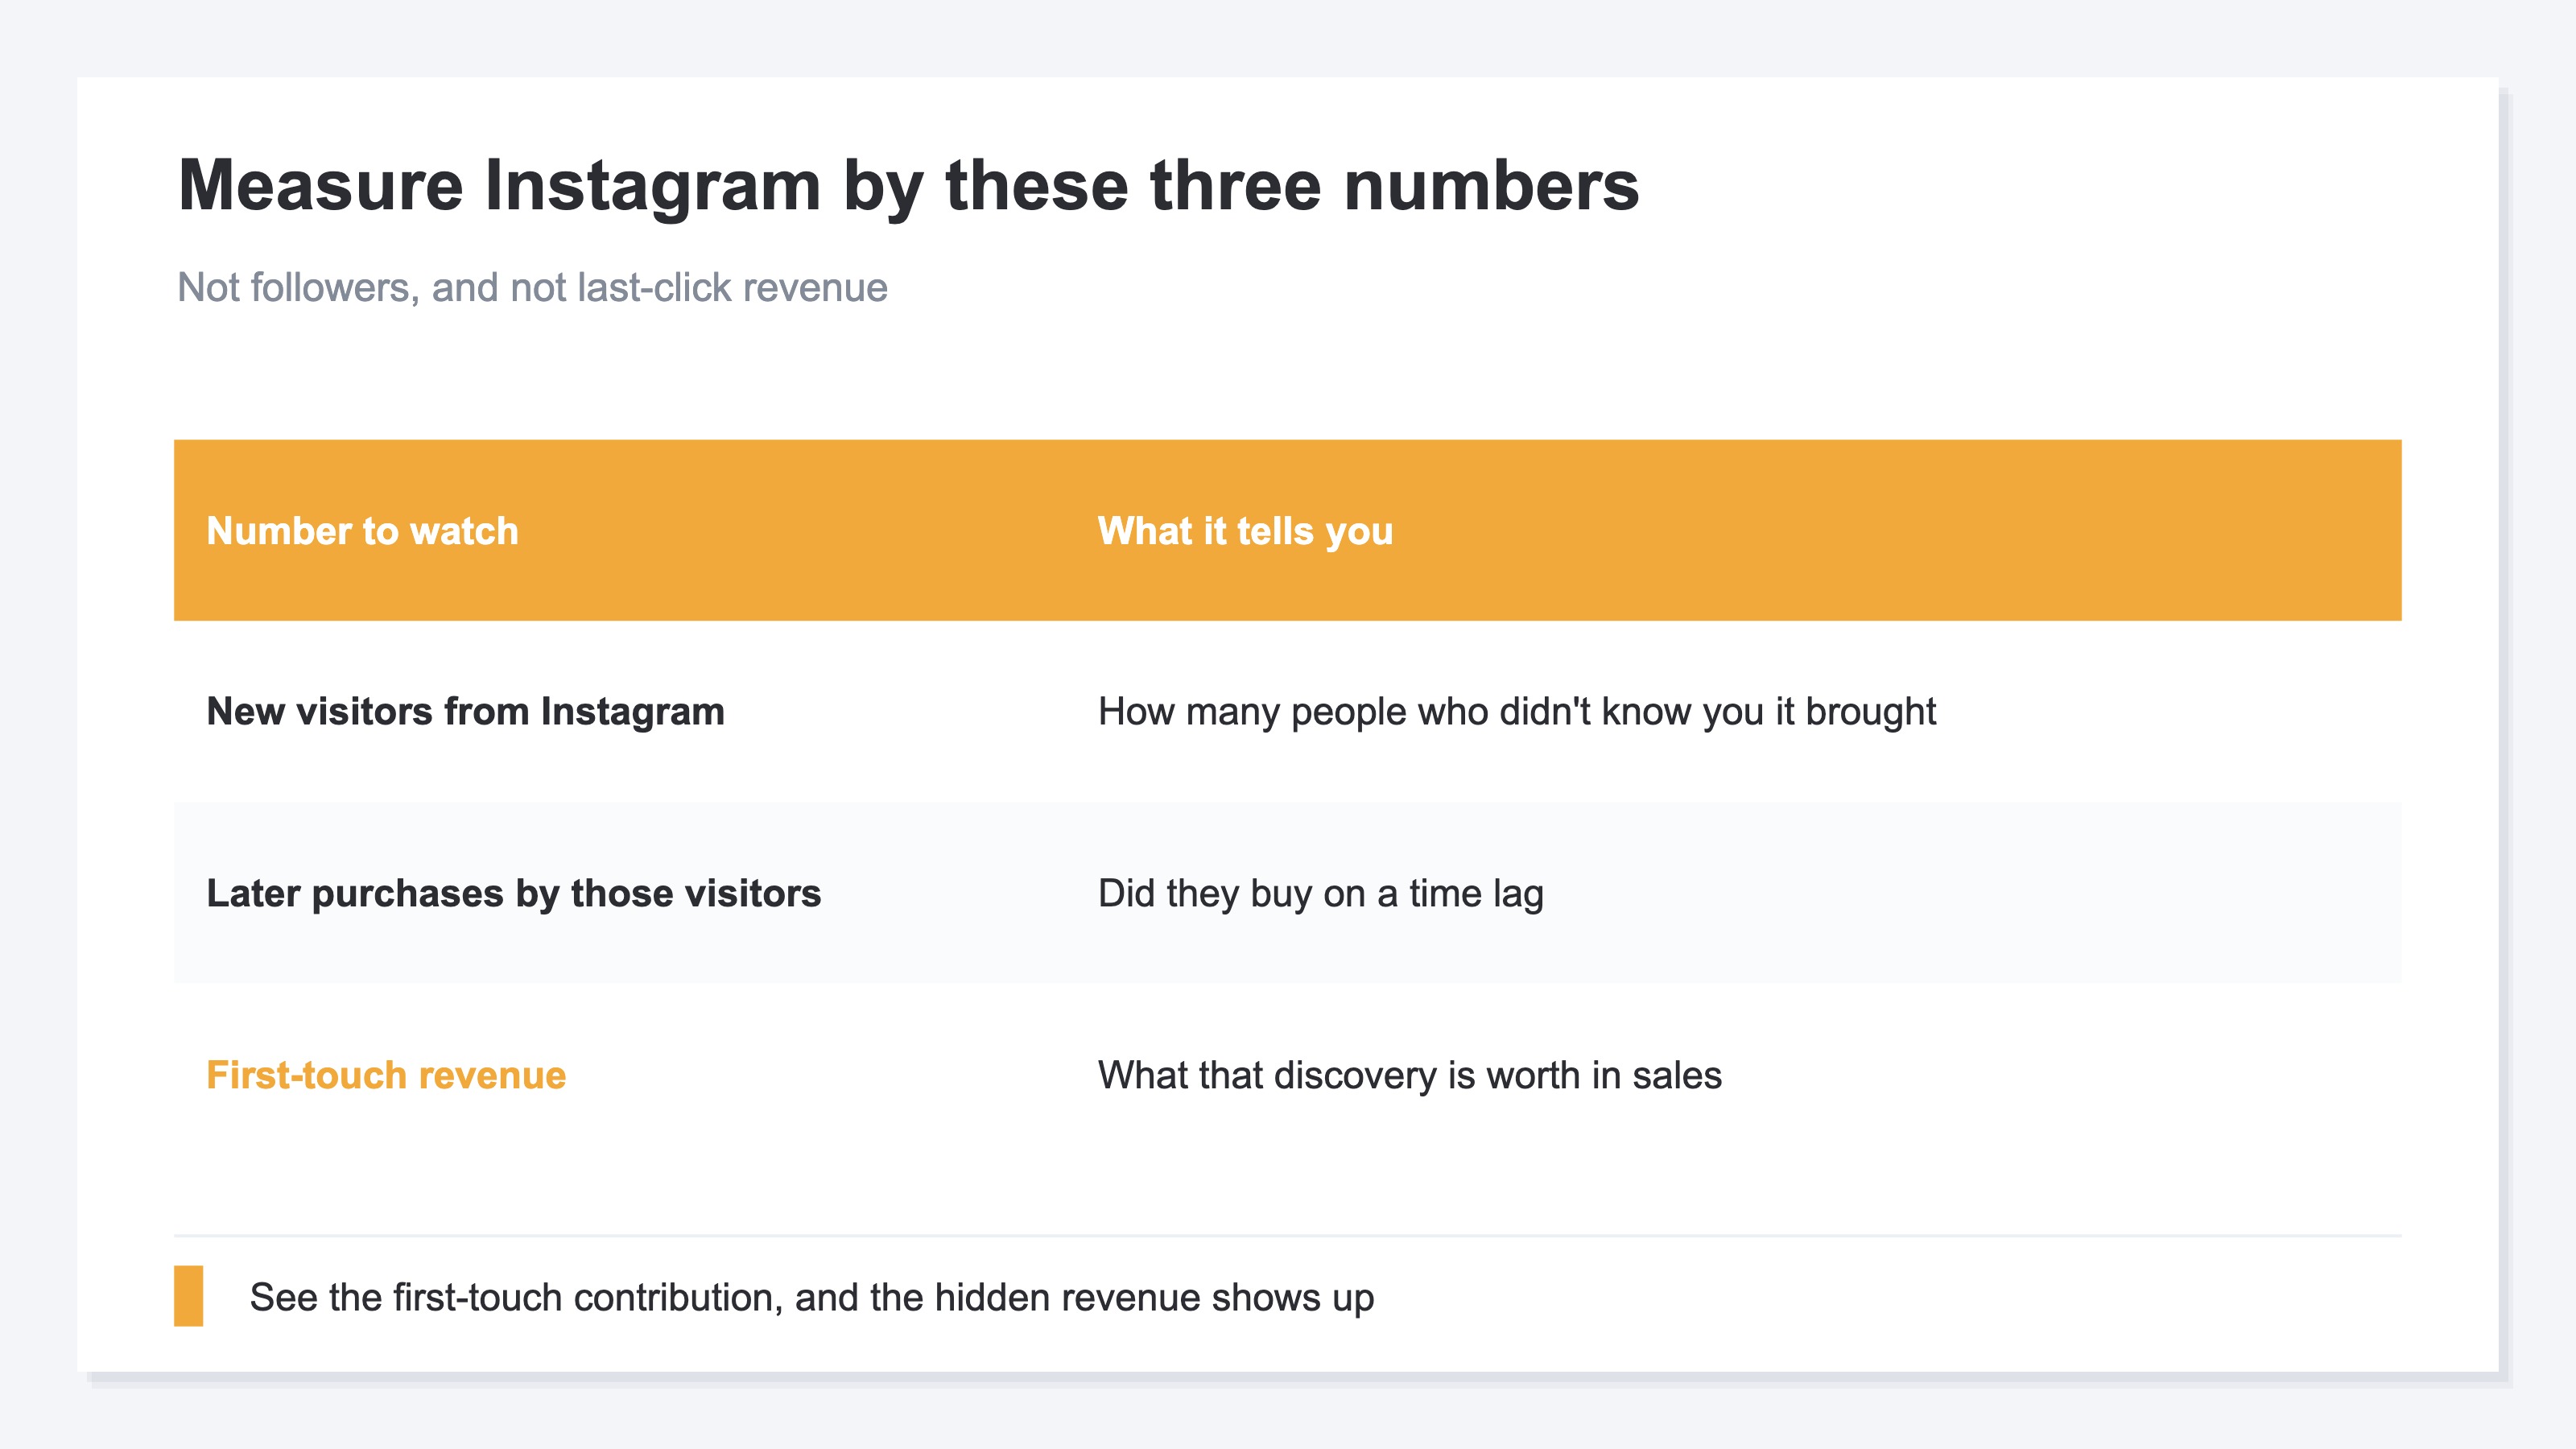
"First touch" means the very first point at which someone discovered your store. If they first met you on Instagram and bought later via search, the last-click revenue is recorded for search — but Instagram created the discovery. Miss that contribution and Instagram looks like a "zero-revenue channel" forever. The bias of crediting only the last click is covered in "Why moving budget on last-click attribution costs you".
GA4 can show the count of new visitors by channel. But to convert what those new visitors buy later into first-touch revenue, and split efficiency by new versus returning on top of that, you have to rebuild exploration reports again and again — heavy to repeat every week. The idea is simple, but it gets heavier the more you do it by hand. Note that channels that catch ready buyers, like search ads, can be graded directly on revenue per session (RPS) — see "RPS (Revenue Per Session): the complete guide".
RevenueScope solution
Bottom line: how differently new and returning visitors convert can sit on one screen, without operating GA4 every week.
Instagram's contribution being hard to see, and the diagnosis being heavy, share one root: GA4 is optimized for last-click revenue and on-site behavior, and isn't designed to put new-vs-returning efficiency or first-touch revenue on one screen.
RevenueScope precomputes the aggregations ecommerce decisions actually need. Alongside per-channel revenue, sessions, and RPS (revenue per session), it splits efficiency by new versus returning visitors. So instead of chasing followers, you start from "new visitors don't buy on the spot — but how efficiently do they buy later?"
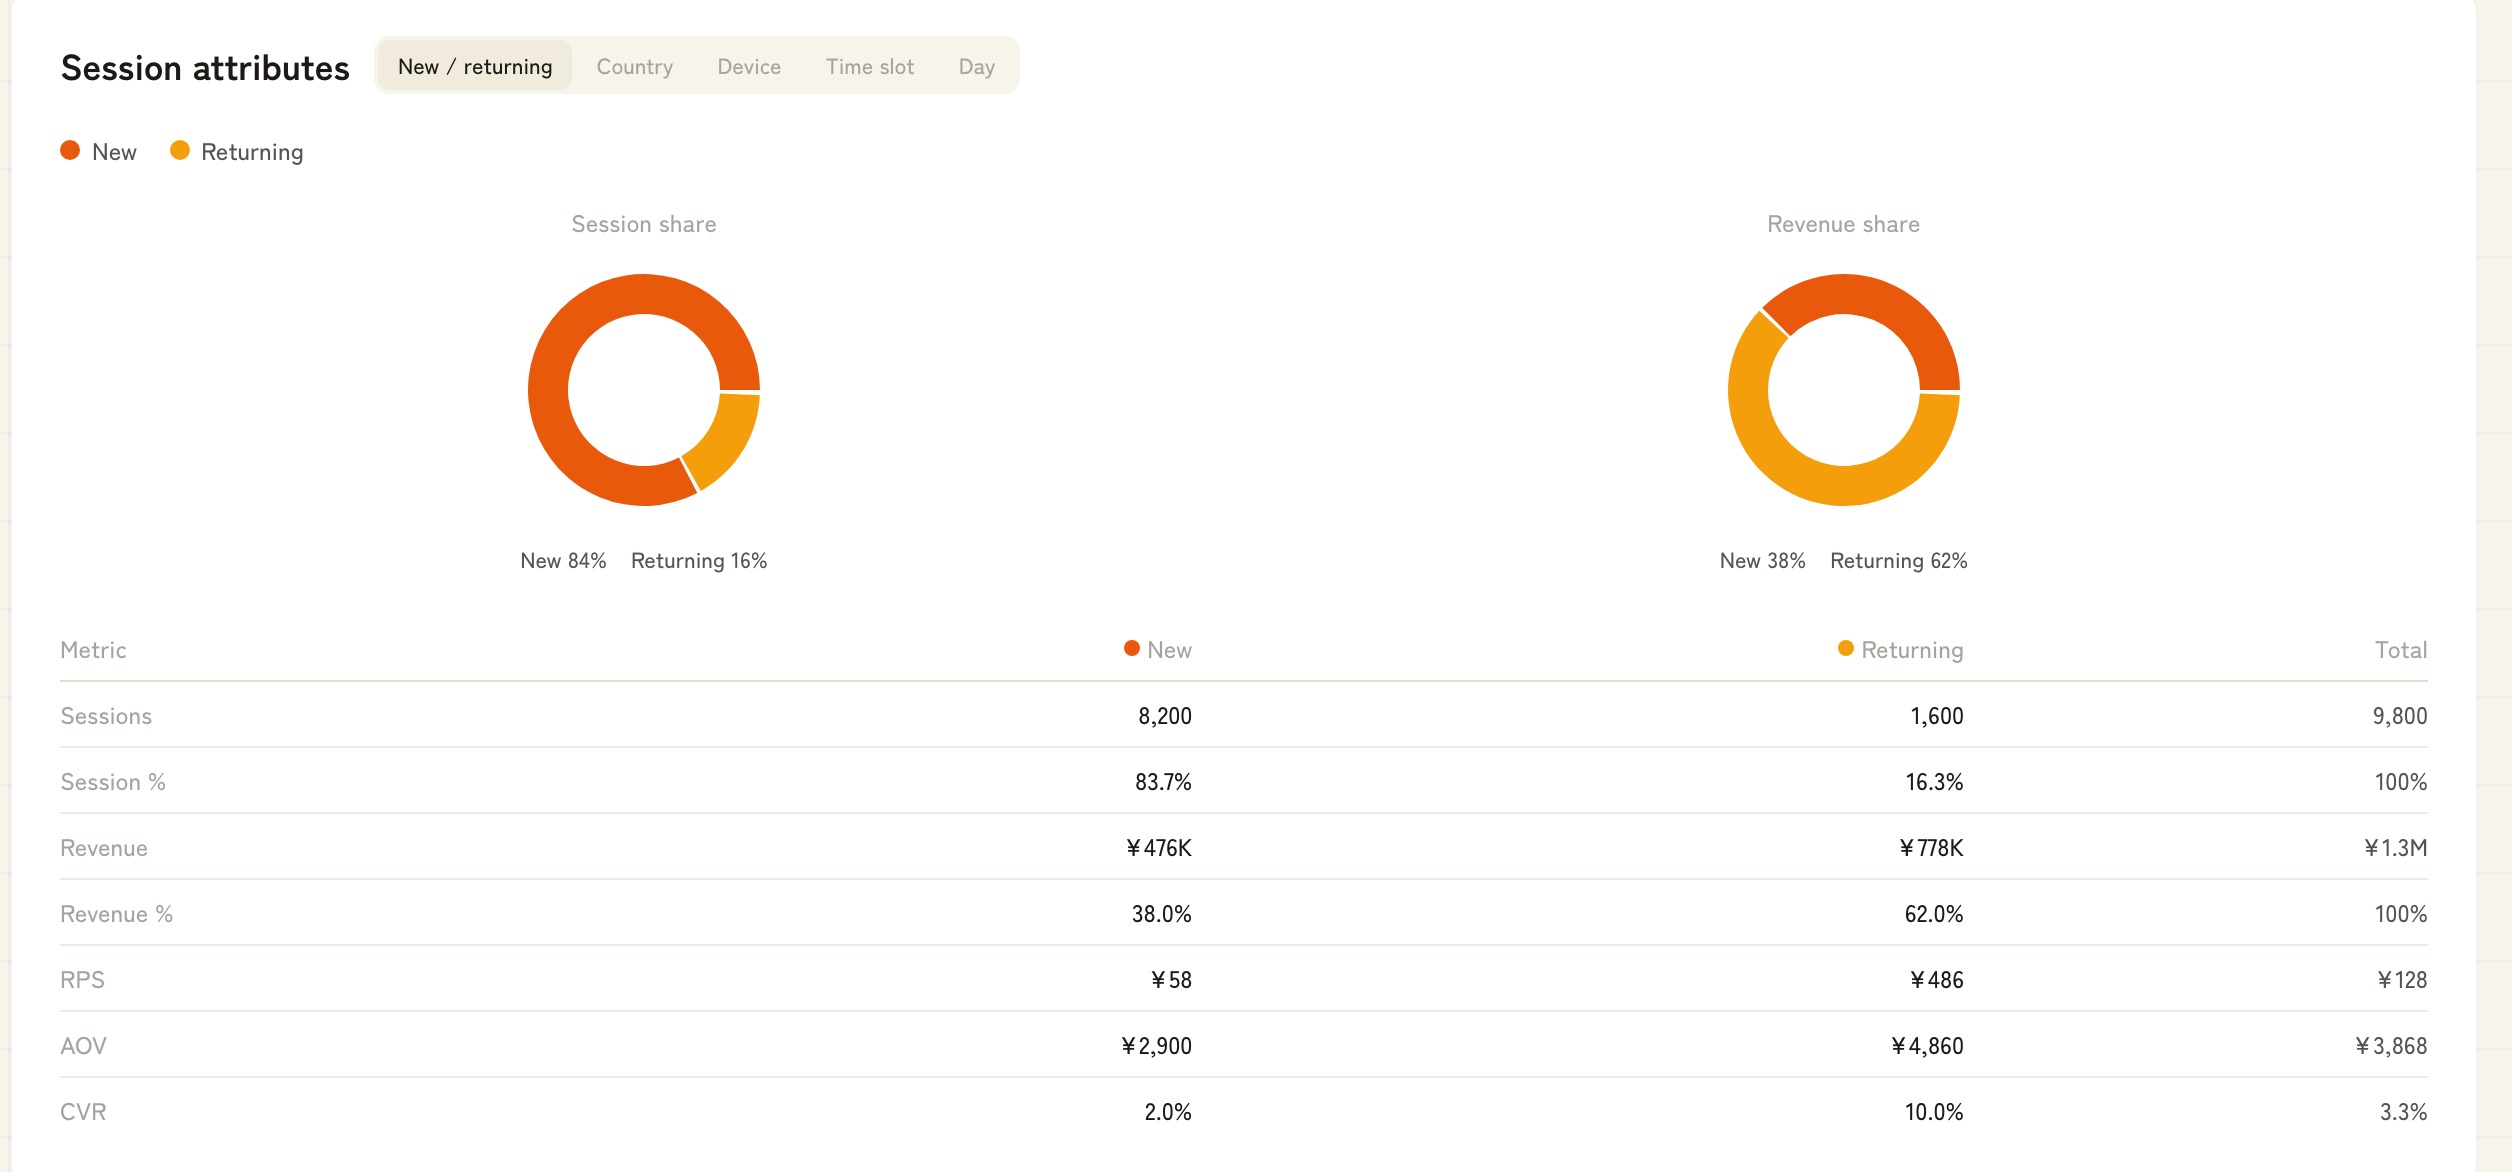
Reading the screen above (demo data): new visitors have an RPS of just ¥58, while returning visitors reach ¥486. The new customers Instagram brings rarely buy on their first visit — but once they return, revenue per session jumps more than 8x. Instagram's low last-click revenue isn't failure; it's the cost of owning the entry point. Cut the entry point, and you cut off your future returning customers too. RevenueScope can also reattribute revenue to the first touch instead of the last, so Instagram's hidden contribution shows up as an actual number — far more decision-ready than chasing followers.
FAQ#
Frequently asked questions#
Q. Should I stop growing followers?
A. They're worth growing, but don't treat them as a result. Followers widen how many people can discover you, but they aren't a sales metric. If followers grow without new visits and purchases, it's time to rethink your content.
Q. Instagram's revenue always comes out low. Is that wrong?
A. No. Getting discovered means last-click revenue is structurally low. That's exactly why you pair "new-visitor count" with "first-touch revenue" to capture the time-lagged contribution.
Q. Should I stop Instagram if its RPS is low?
A. Not right away. If it brings neither new visitors nor first-touch value, rethink it — but if it brings many new visitors, it's filling the pool of future customers that search and returning visits convert cheaply later. Cutting on low RPS alone means losing the entry point itself.
Conclusion#
Followers, likes, and reach are popularity metrics, not sales metrics. Instagram's job is getting discovered by people who don't know you yet — different work from search, which catches ready buyers. So judged on last-click revenue alone, Instagram looks "ineffective" forever.
What to watch is how much the new visitors Instagram brought buy later. Split new from returning, and capture the first-touch contribution. As a first step, switch how you grade Instagram from "follower count" to "how much the new visitors it brought came back and bought." The entry point that looked like zero on last-click was quietly building your future revenue.
See which ads actually drive revenue, at a glance
Free up to 5,000 sessions/month, AI analyst included. No credit card required. Up and running in 5 minutes.