Open GA4's attribution report and it shows you which ads and paths earned the sale, split into credit. Attribution here means the way one sale is divided up — "which ad or path do we count this as the result of?" It's a useful view, but push toward "so where do I move budget next?" and it suddenly gets hard to lean on. Why? Because in October 2023, GA4 sharply cut the models you can use, and only two remain. This article sorts out what GA4's attribution report shows, what it leaves out, why it can't tell you where to invest next, and what GA4 can do today along with its limits. Up front: this is not about replacing GA4. GA4 is a genuinely useful tool — this is about knowing exactly where its job ends.
Table of contents
TL;DR#
- GA4's attribution report shows which ads and paths earned the sale, split into credit. That part is genuinely strong.
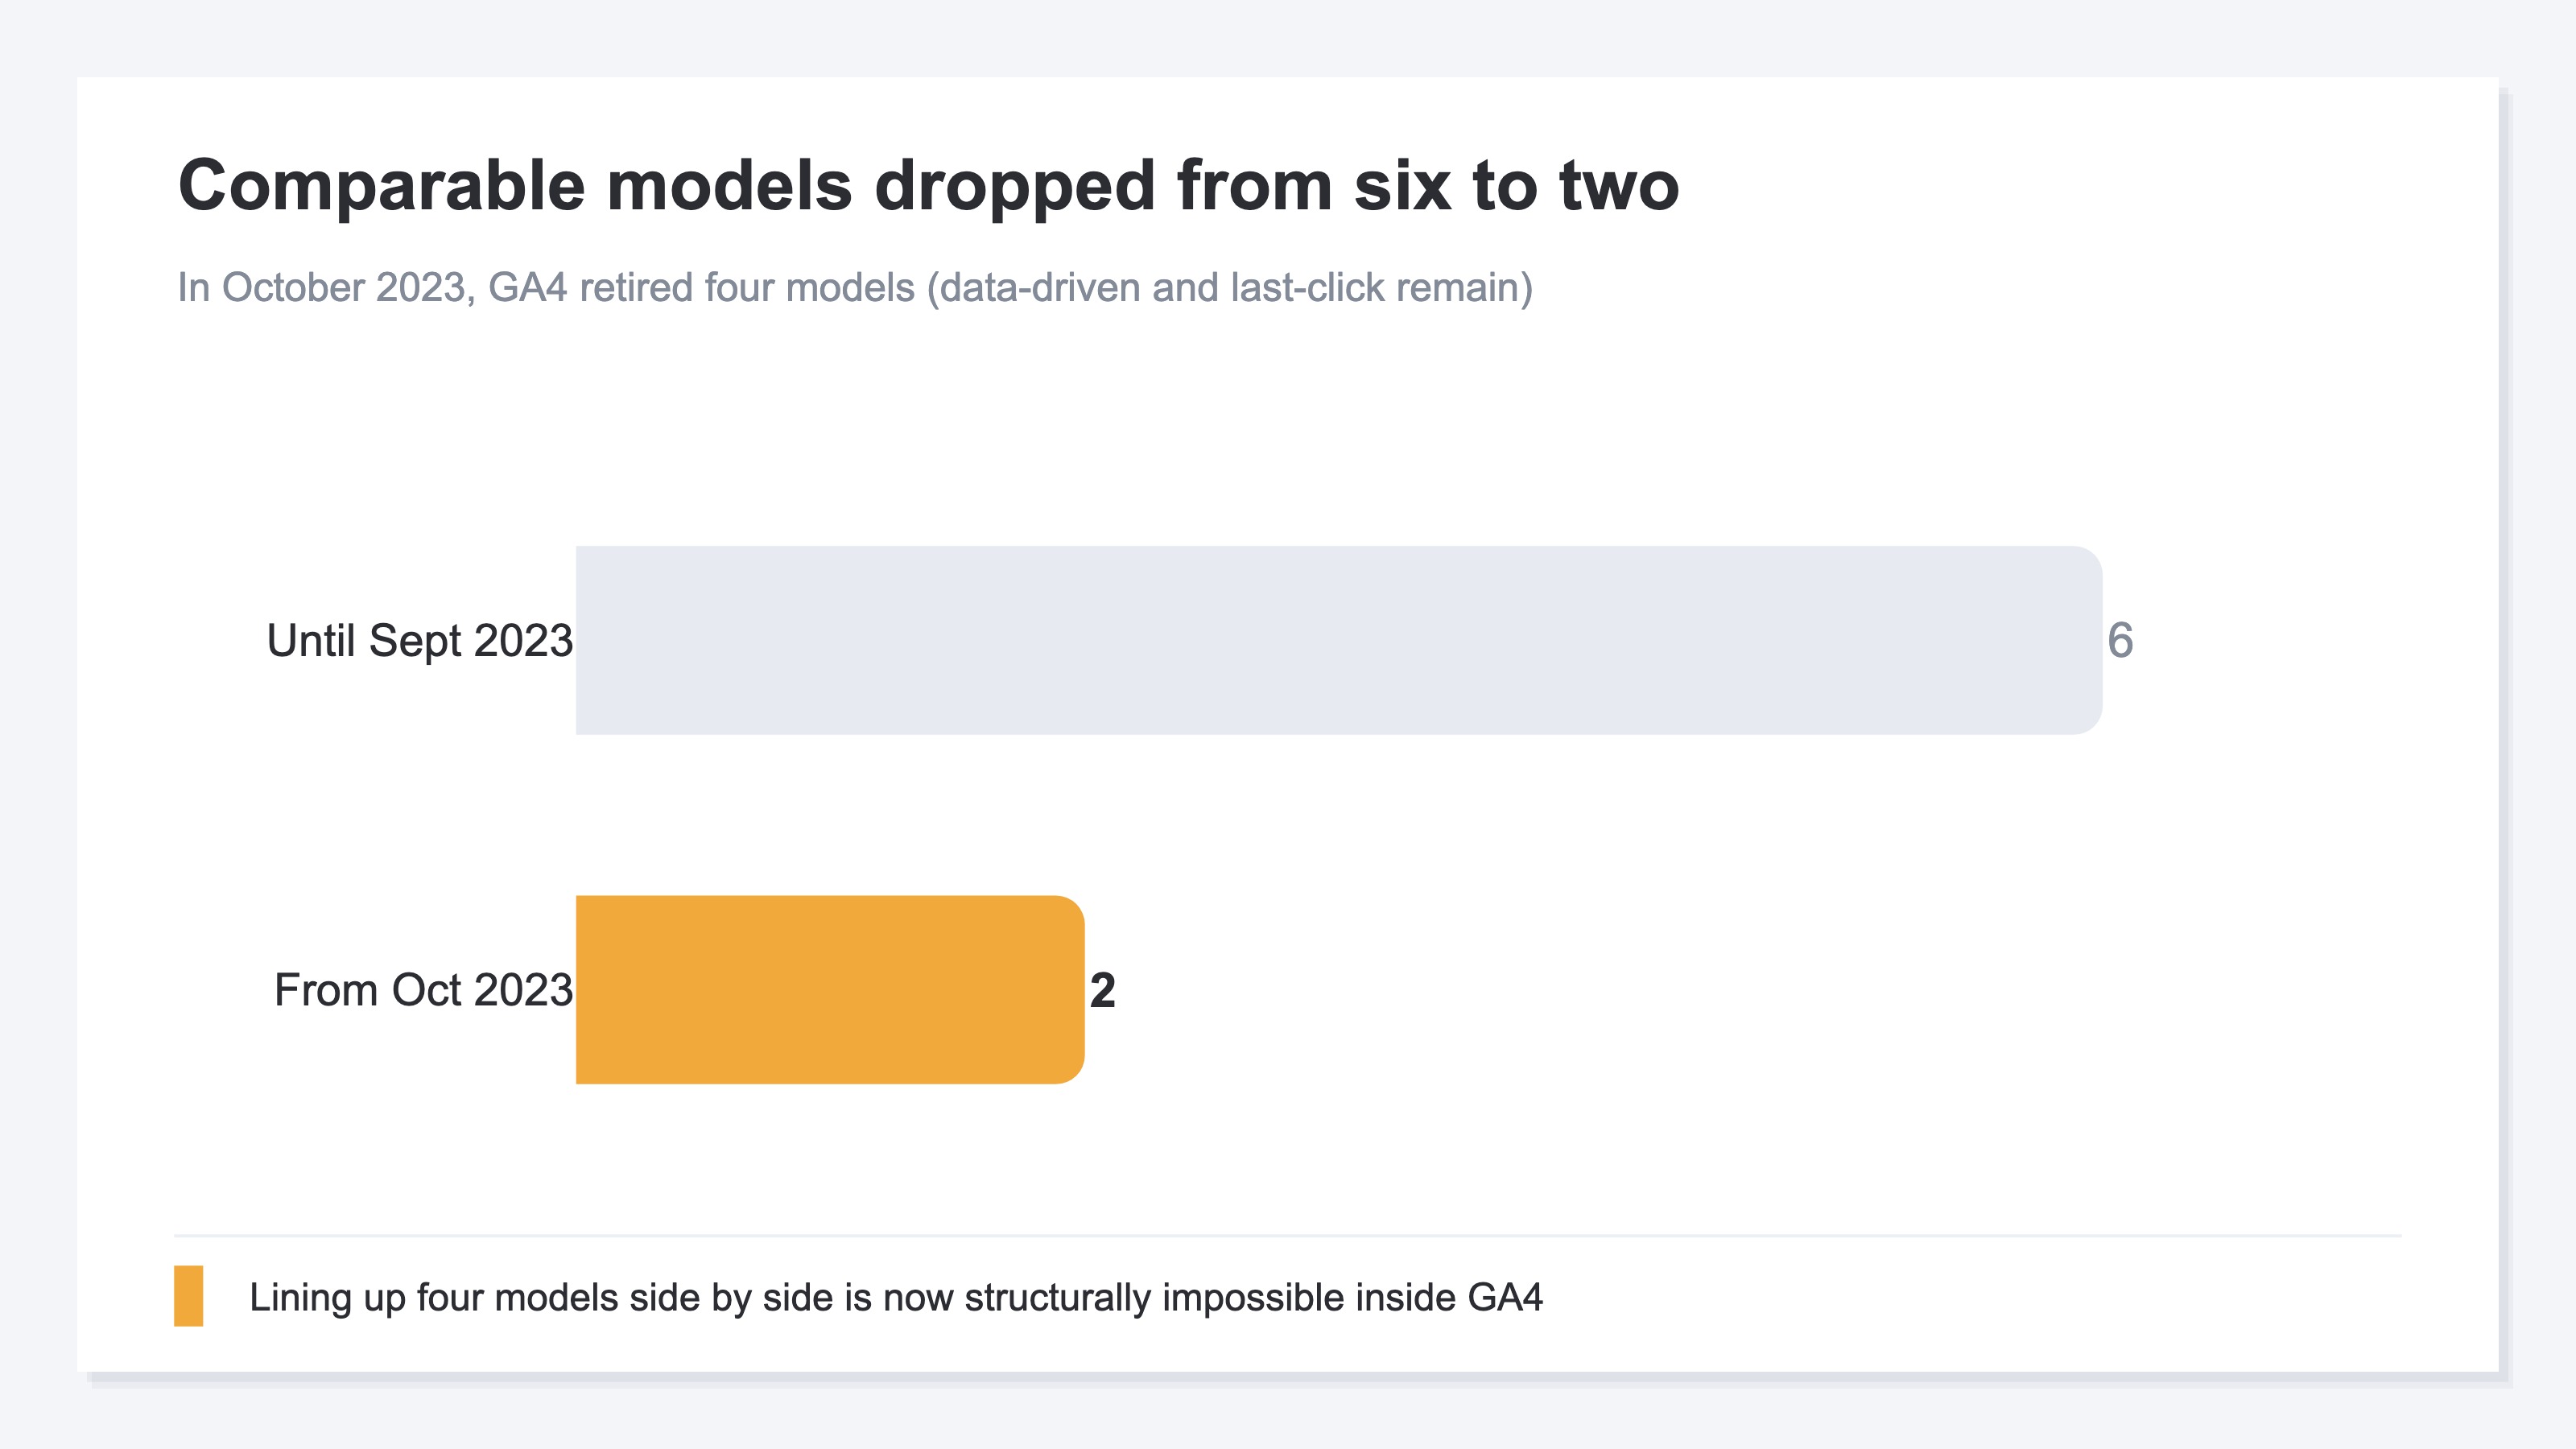
- But in October 2023, GA4 retired four models, leaving only data-driven and last-click — so you can't line up the same revenue across several models inside GA4.
- And the default view tends to under-credit "assist" paths like email and display that nudged the buyer along, as the research points out.
- So GA4 shows "what happened" well, but stops short of "where to invest next" — not a replacement story, but a story about filling in the views it misses.
1. What GA4 attribution reports show#
Bottom line: GA4's attribution report shows "which ad or path earned how much revenue," split into credit.
A customer rarely buys on a single visit. They see an ad, come back through search, return again from an email, and finally buy — touching several paths along the way. Attribution divides the credit for a sale across those touchpoints and shows "how much each path contributed." You can also check the path flow (the order they moved through).
The way credit is divided has types, called attribution models. GA4 gives you mainly two today. One is "data-driven (DDA)," where AI decides the split automatically from past data — this is the default. The other is "last-click," which assigns the entire sale to the path just before purchase. The types of models and when to use each are covered in Attribution Models Explained: Last / First / Linear / Time-Decay and When to Use Each.
The table below lines up what this report "shows" and what it "makes hard to see." The hard-to-see side is shaded. That part matters later.
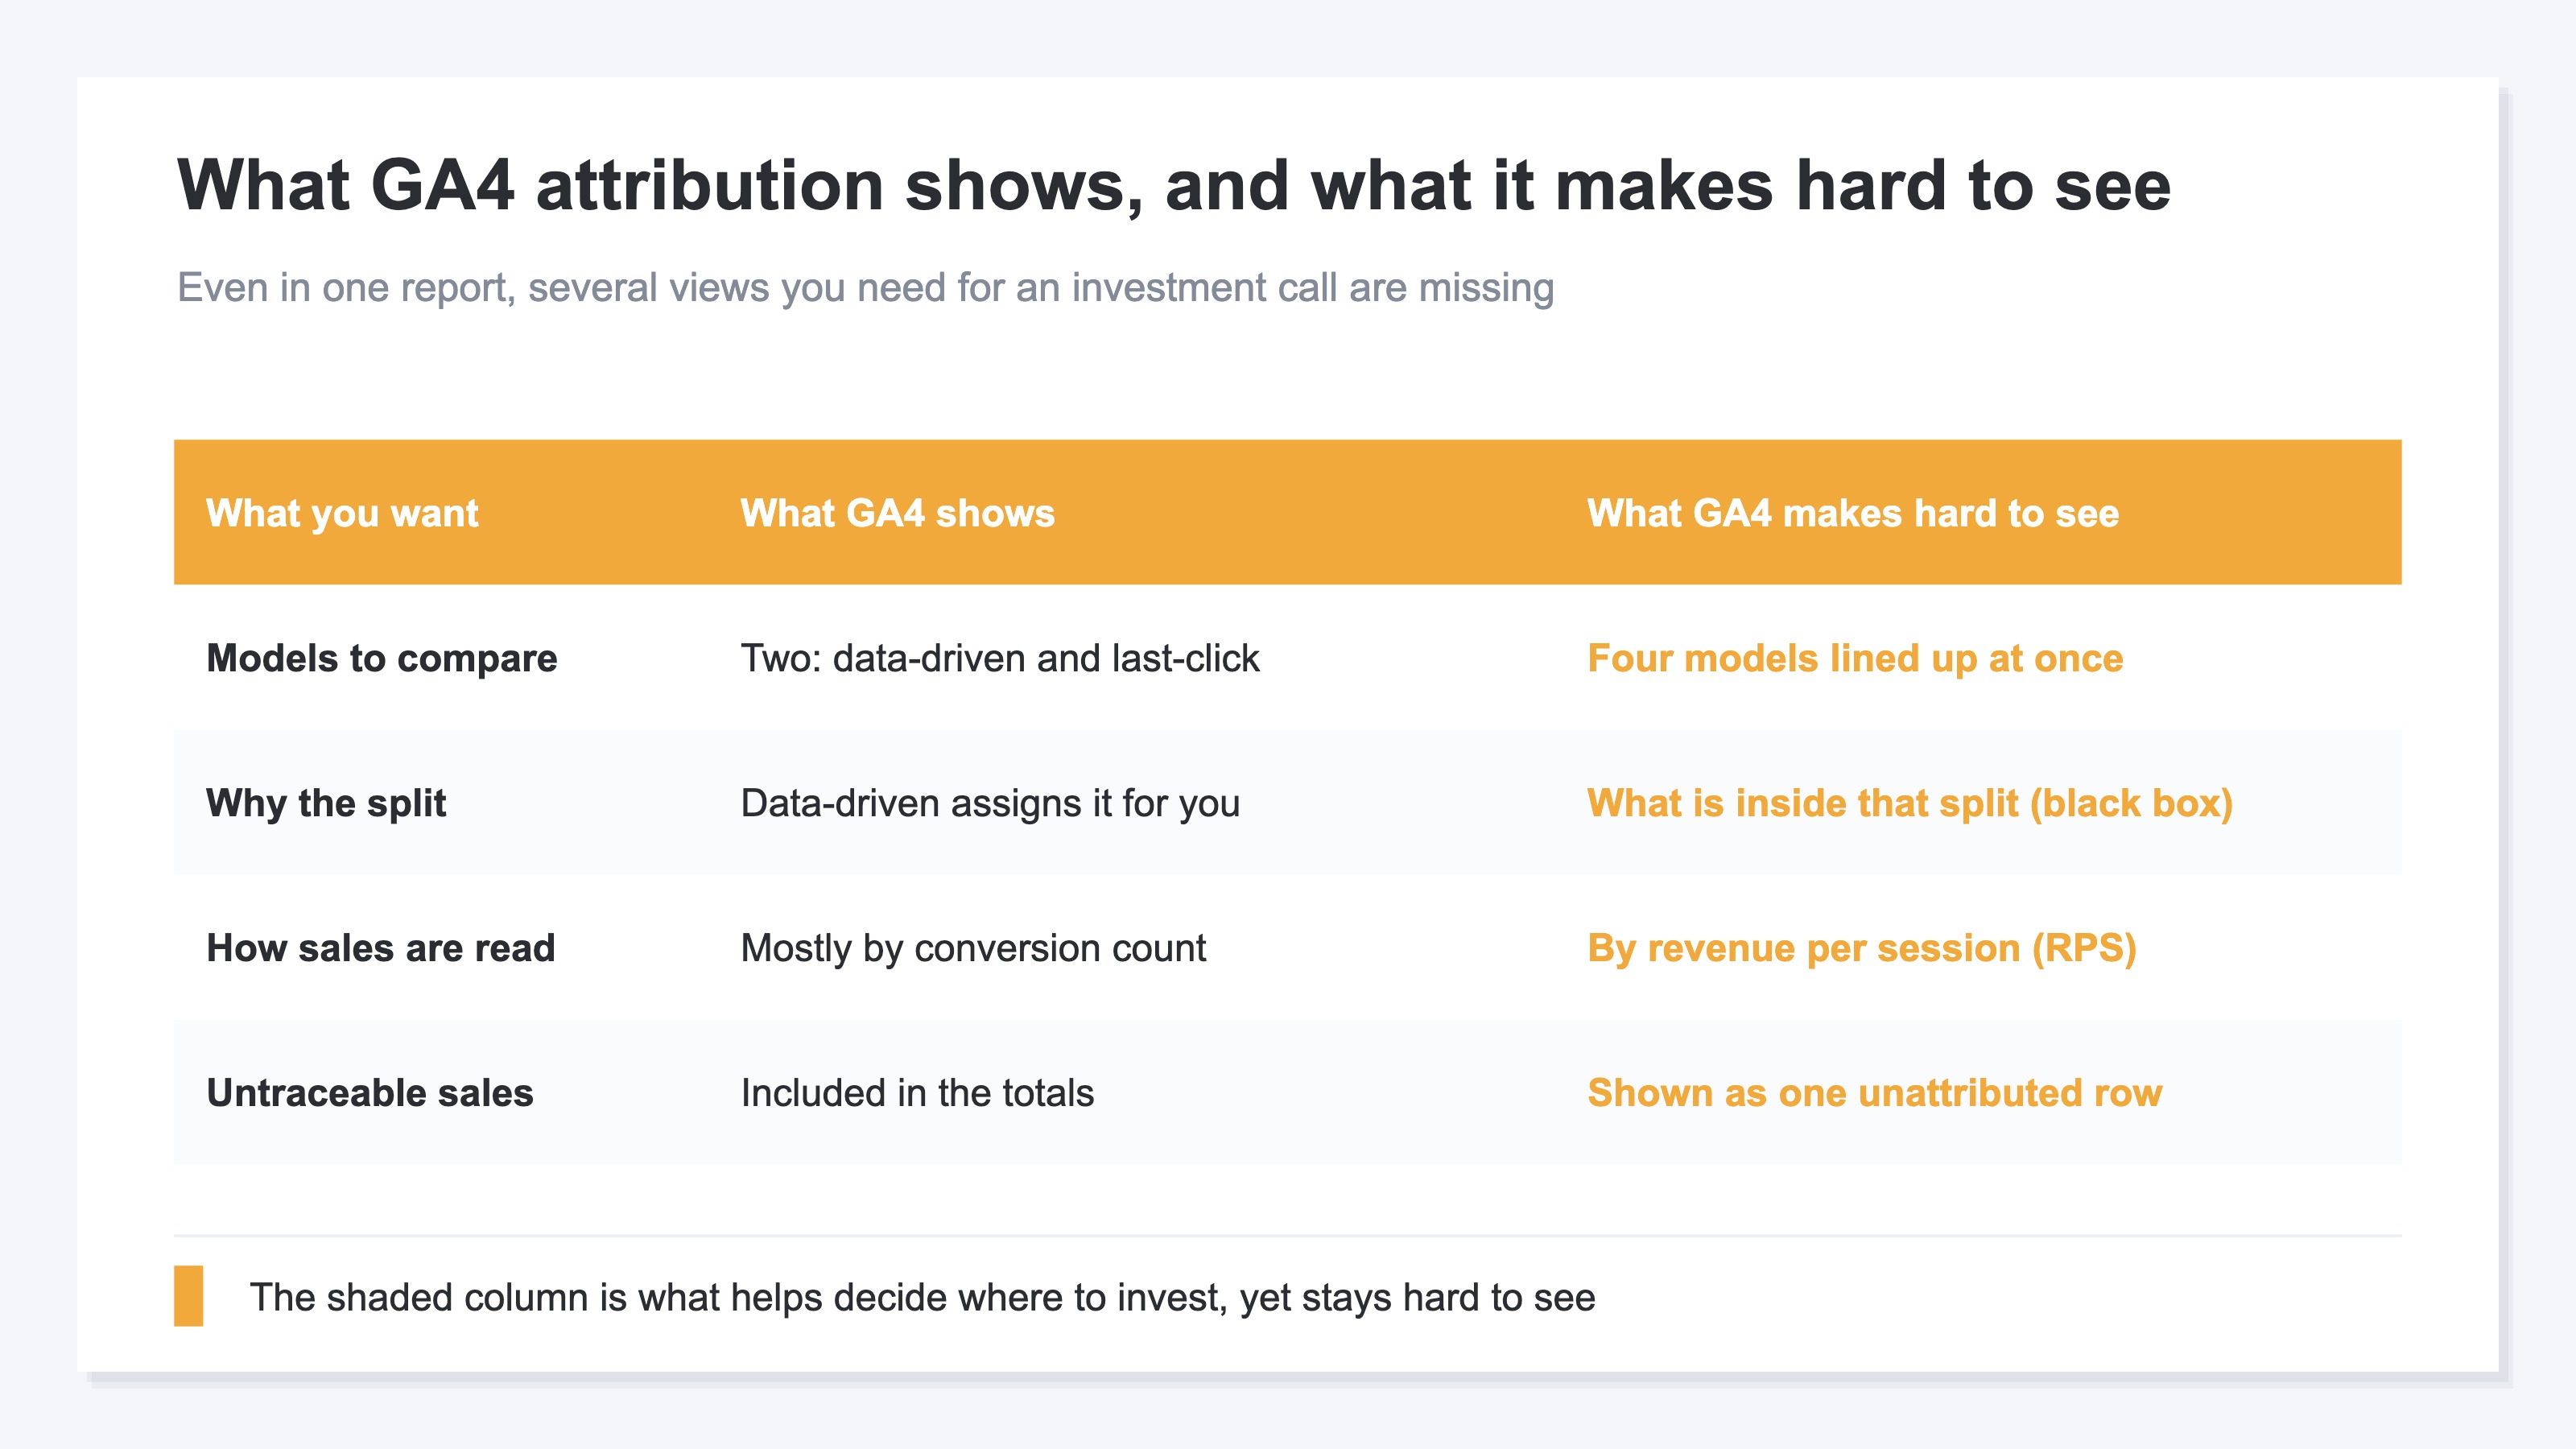
So GA4 is good at showing the "result of the split." The trouble starts when you try to read "where to move budget next" out of that result.
2. What attribution reports leave out#
Bottom line: GA4's attribution report is missing several views you need for an investment call — four big ones.
First, you can't line up models to compare. In October 2023, GA4 retired four models: "first-click," "linear," "time-decay," and "position-based" [1]. Only data-driven and last-click remain. Comparing the same revenue across several models — to see "how the credit shifts when you change the lens" — has become structurally impossible inside GA4.
Second, the default data-driven model makes "why this split happened" hard to see. Because AI assigns it automatically, accuracy is high, but the inside is like a black box, and the reasoning is hard to put in your own words. It's a shaky footing when an owner has to decide "this split is fine."
Third, conversion "counts" tend to take the lead, and the view that re-sorts by "revenue" or "revenue per session (RPS)" is weak. Even with many conversions, low order value means small revenue. You want to decide investment by revenue, not count, yet that re-sort is hard.
Fourth, it doesn't honestly show untraceable sales as "one row." Sales that slip into "source unknown (Direct)" from a measurement gap are included in the totals, but never appear as their own line. The nature of these untraceable sales is covered in Unattributed Revenue: Where Your Untraceable Sales Actually Come From. The larger the sales with no visible origin, the lower the trust in the split itself.
3. Why GA4 cannot tell you where to invest next#
Bottom line: of the two remaining models, the "last-click" most people lean on tends to under-credit the paths that nudged the buyer along the way.
Last-click assigns the whole sale to the path just before purchase. So branded search and direct visits — which tend to be the final step — look large, while the email, display ads, and referrals (mentions from other sites) that created awareness earlier look like zero contribution. The same goes for acquisition: even when organic search (SEO) nudged the buyer mid-journey, looking only at last-click makes its effect look small.
The research points to this too. A study titled "Data-Driven Multi-Touch Attribution Models" reports that assigning credit on last-click alone under-credits the contribution of "assist" paths like email, display, and referral [2]. Another study also shows that changing the credit model changes how contribution appears [3].
The chart below illustrates that gap. Seen on last-click (gray), the contribution of email and display sinks small. But reassigned on data-driven (green), those "mid-journey nudges" surface. With the same revenue, changing the lens swaps which paths look effective.
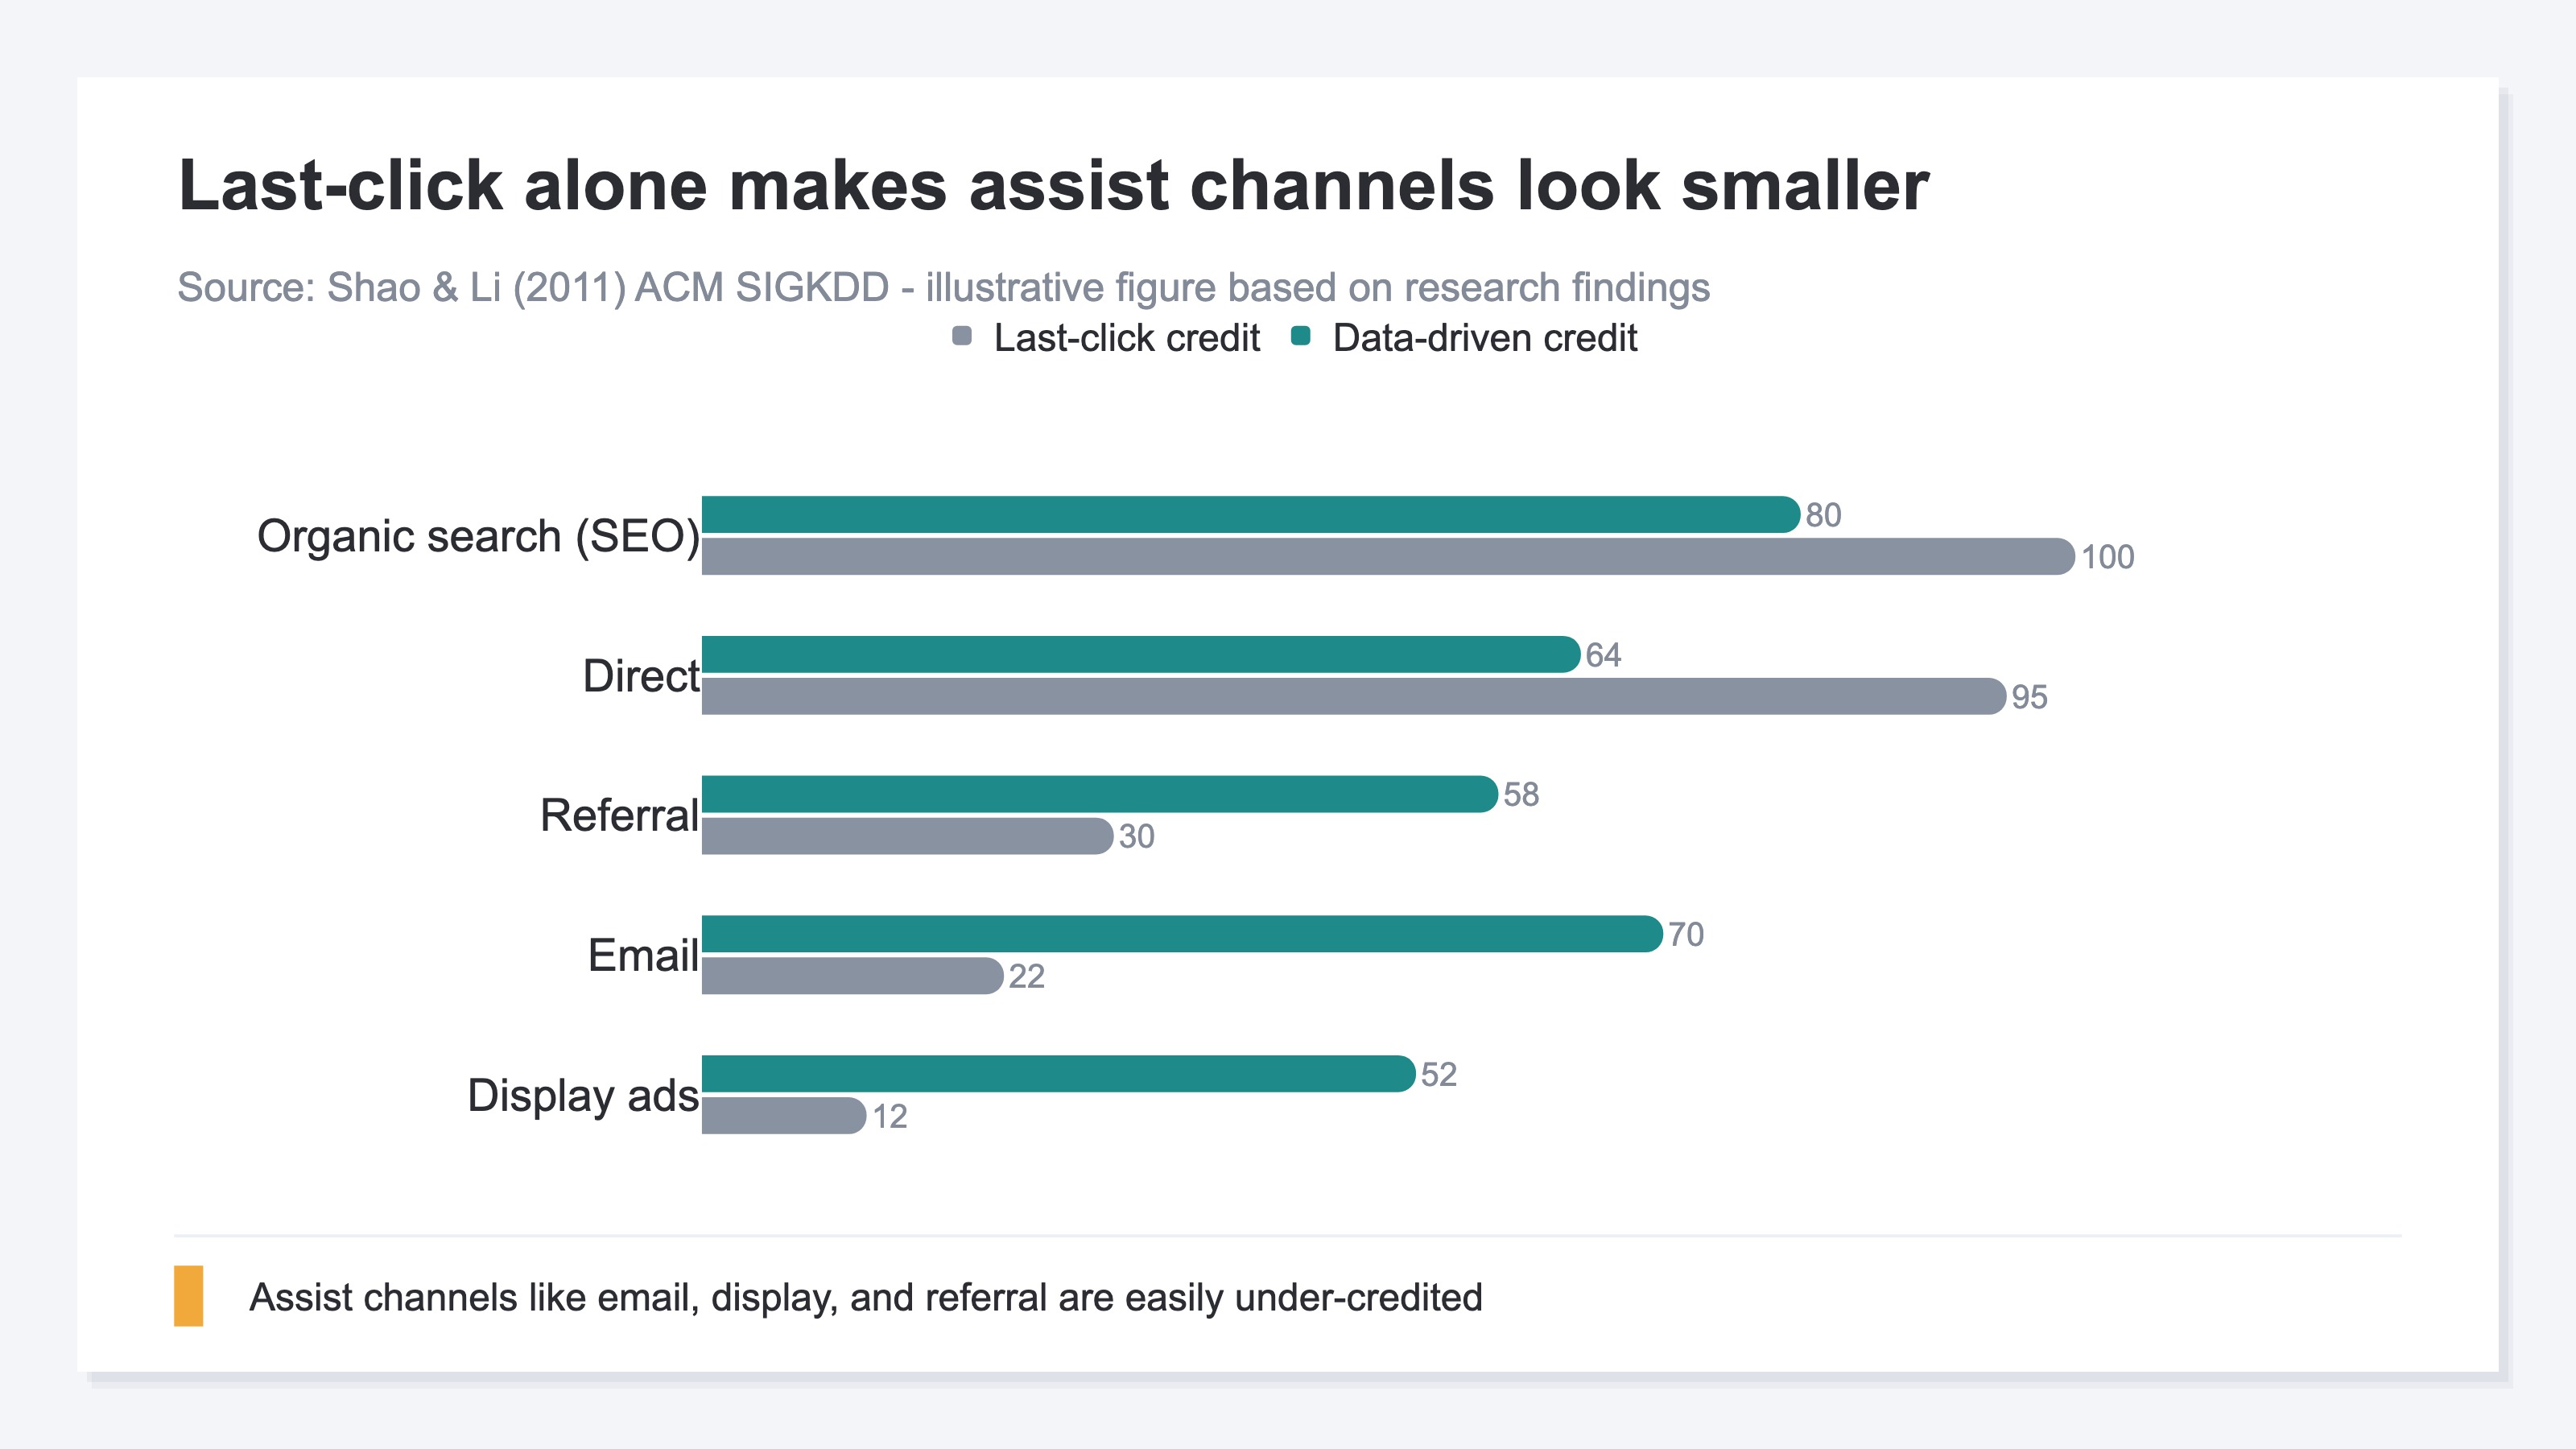
One thing to make clear: the numbers in that study are about its own context. Read the chart here as a relative guide (an index). The skeleton — "on last-click alone you tend to under-count the mid-journey assists" — likely applies broadly to e-commerce and service sites, though how strongly it applies varies by category. This is not a "proven universal law" but a "this kind of argument is emerging" reference. How it actually plays out is best confirmed with your own site's data.
This is the crux of why "where to invest next" can't come out. Last-click alone drops the assists, while the default data-driven hides its insides — and with only two models left, you can't even change the lens to compare. The risk of moving budget on last-click alone is covered concretely in Moving Budget on Last-Click Alone Costs You: How to Read Attribution Right.
4. What GA4 can do today and its limits#
Bottom line: GA4 is strong enough to see "what happened," but it stops just short of "where to invest next."
What it can do is far from small. For free, you can grasp the path flow and the rough trend of the split. If you just want to check once "roughly which paths seem to be working," GA4 is enough. Starting here is the realistic move.
The trouble is what comes after. Even when you grasp the idea, re-converting revenue across every channel × every model × every period each time is heavy by hand. And lining up four models side by side isn't possible inside GA4 at all. Checking once yourself is fine, but tracking it page by page and month by month is structurally laborious. That GA4 isn't a tool for seeing revenue is also covered in GA4 Isn't a Tool for Seeing Revenue: The Direct Metric EC Sellers Miss.
The chart below lines up the views by "can GA4 show it" and "how much it matters for the investment call." The top right — important yet heavy or impossible in GA4 — is exactly where the material for "where to invest next" drops out.
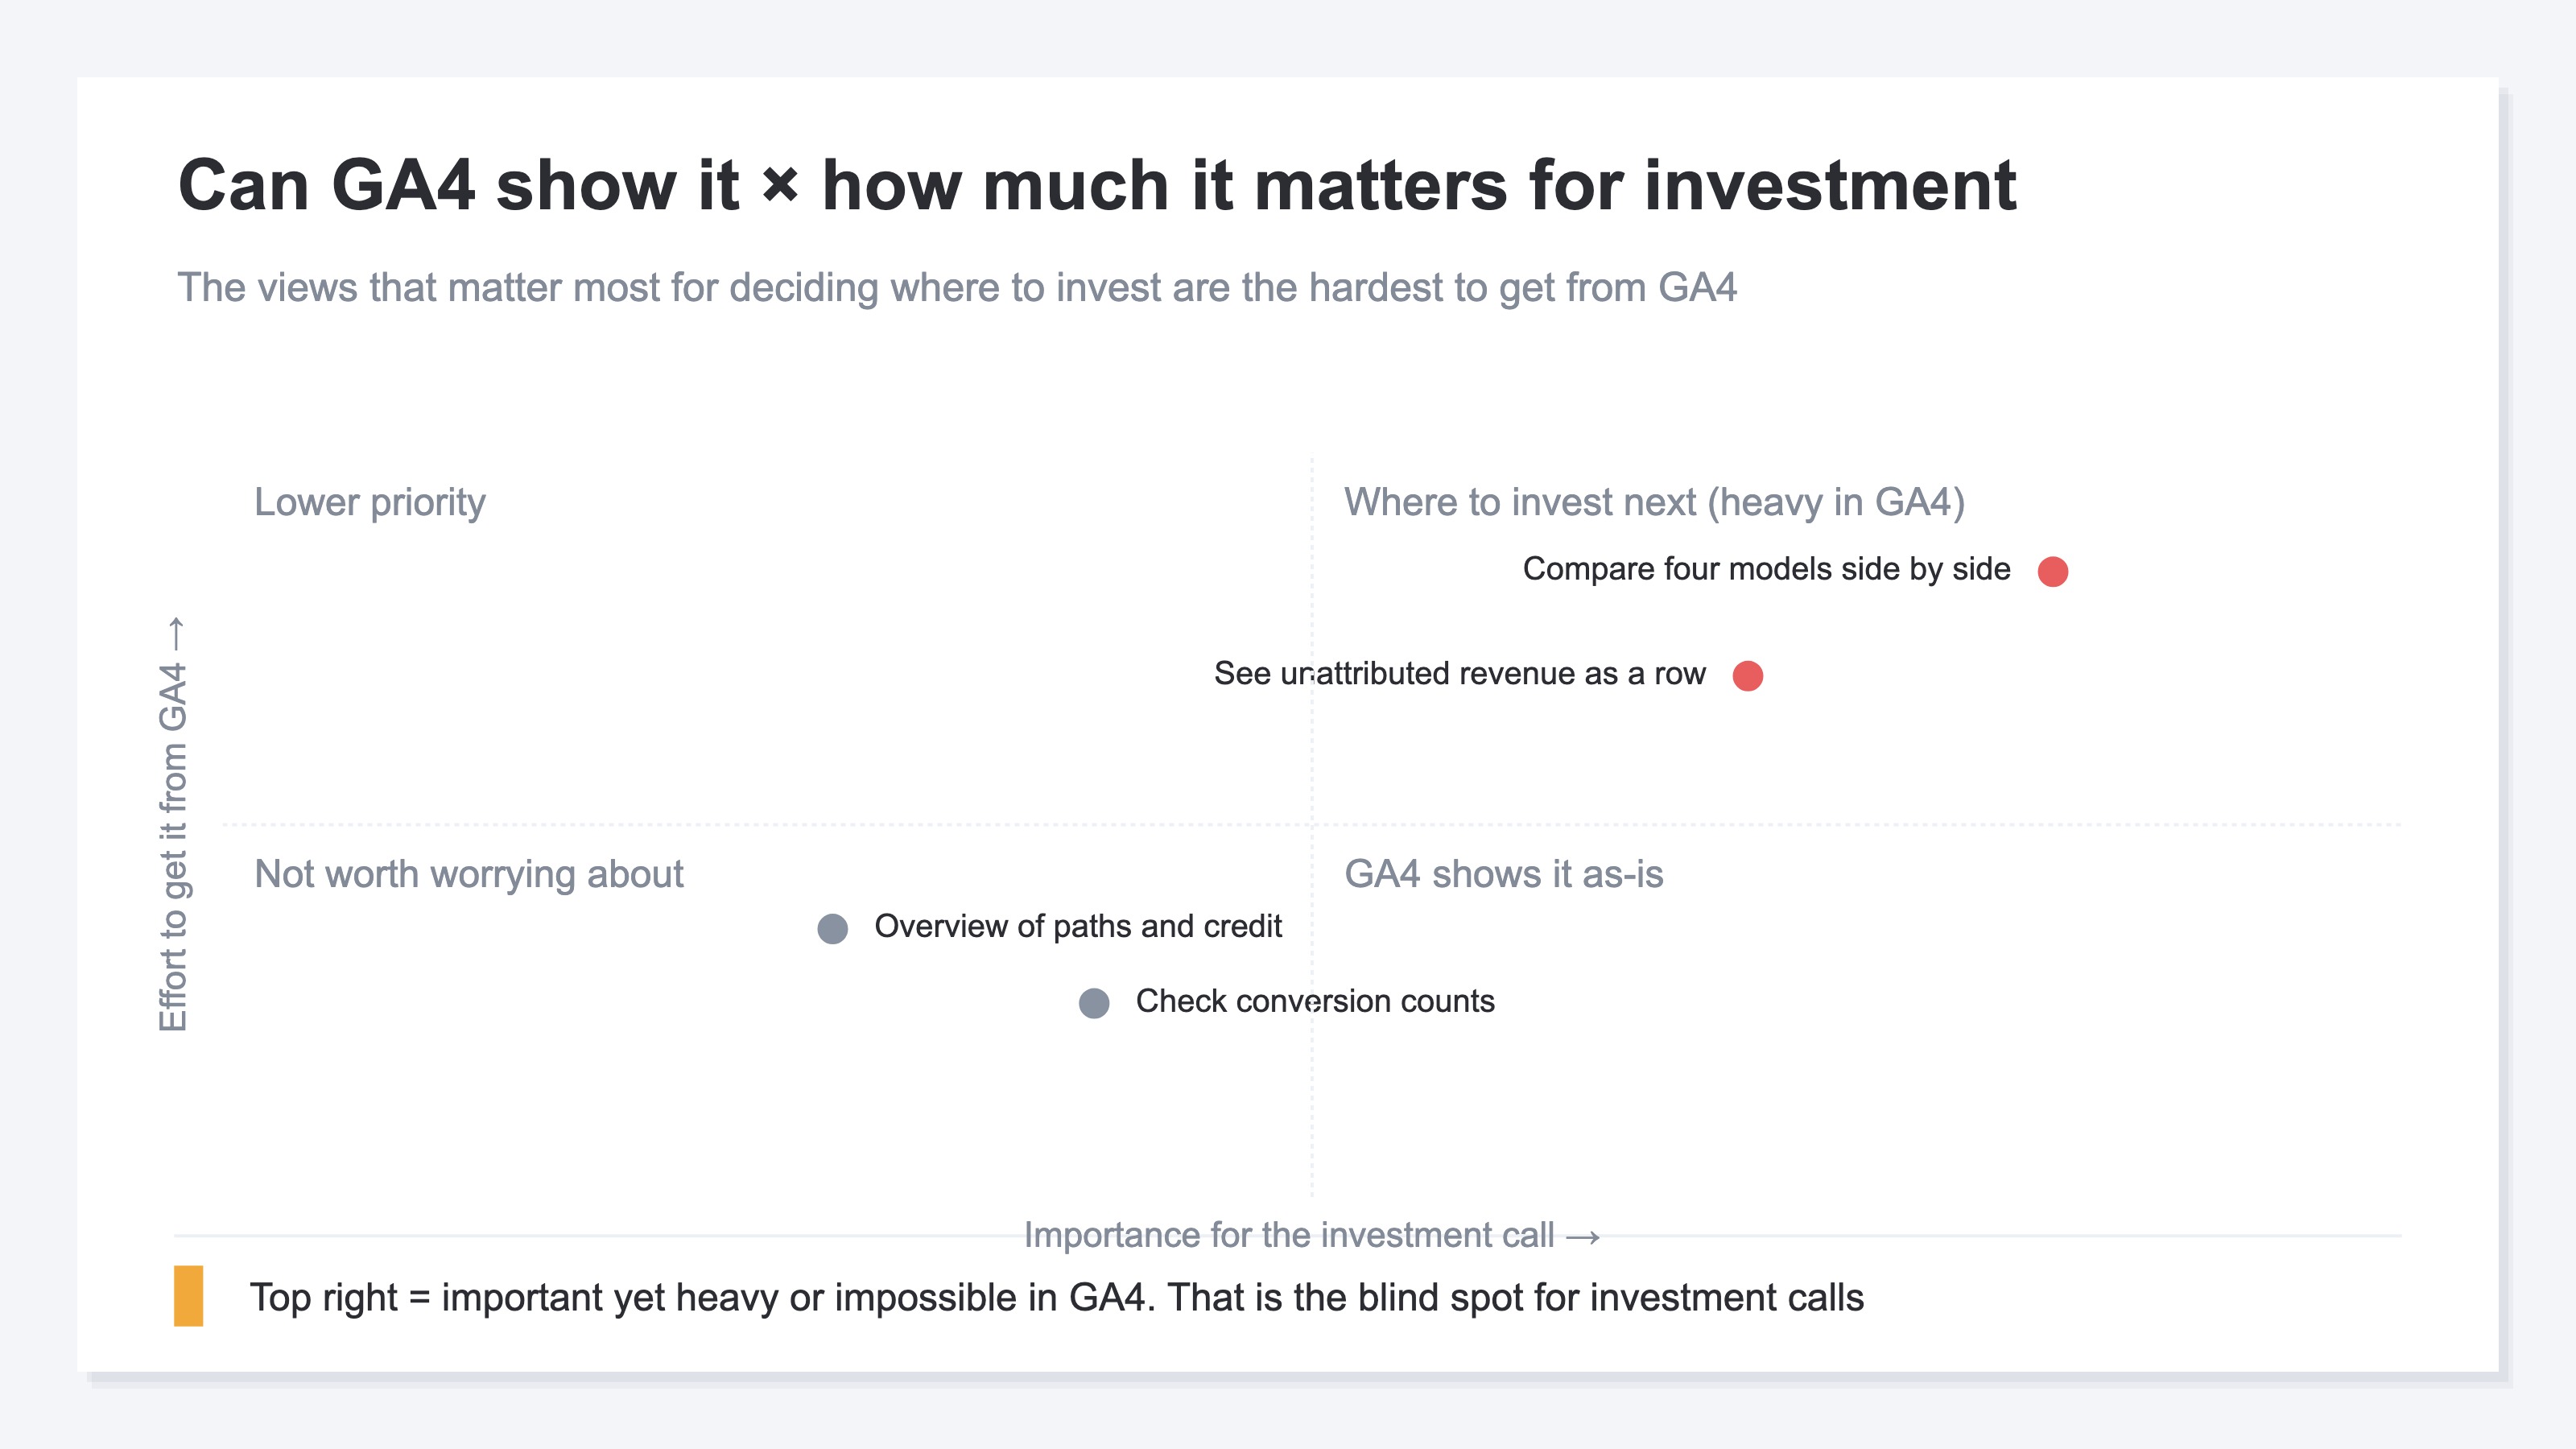
In other words, GA4 shows you "how things are right now," like a health check, but the prescription for "so where do I invest next" is structurally hard to get out of it.
RevenueScope helps
By now it's clear that GA4 is good at showing the result of the split, but tends to stop just short of the investment call — "line up the same revenue across several models, compare by revenue, and see the unattributed honestly." Yet doing that yourself is heavy. Only two models remain, and re-converting revenue across every channel and period is laborious to repeat each month.
RevenueScope takes over that comparison. It lines up the same revenue across four models — last-click, first-click, linear, and time-decay — and lets you compare, in one view, how each channel's revenue shifts as you change the model (figures shown are demo data). And it shows sales that tie to no channel honestly, as an "unattributed" row.
Ask "show me our revenue lined up across four models" and it comes back like this.
| Channel | Last-click | First-click | Linear | Time-decay |
|---|---|---|---|---|
| Organic search (SEO) | ¥420,000 | ¥310,000 | ¥350,000 | ¥390,000 |
| ¥80,000 | ¥190,000 | ¥150,000 | ¥110,000 | |
| Display ads | ¥40,000 | ¥160,000 | ¥120,000 | ¥70,000 |
| Via AI (ChatGPT, etc.) | ¥60,000 | ¥120,000 | ¥100,000 | ¥80,000 |
| Direct | ¥210,000 | ¥30,000 | ¥90,000 | ¥160,000 |
| Unattributed | ¥90,000 | ¥90,000 | ¥90,000 | ¥90,000 |
The point of this table is display ads. On last-click it gets only ¥40,000, but on first-click it's ¥160,000 — the same revenue looks four times different depending on the model. If you'd set budget on last-click alone, you might have written display off as "not working" and cut it. Only by lining up four models do the "paths working mid-journey" surface.
On top of that, RevenueScope lines up each channel's revenue per session (RPS) on the same screen. Switch the model and each channel's revenue and RPS move together (the visit counts themselves don't change). So you can even see quality differences like "low traffic, but the visitors who come buy well." The thinking behind revenue per session is explained in Revenue Per Session: Compare EC Ad Channels by Revenue (2026).
To be clear: what changes when you switch the model is revenue and RPS only. Visit counts and bot-excluded counts don't change. RevenueScope also doesn't calculate gross margin, inventory, or lifetime value (LTV). And while you're filtering by country or device, the unattributed row isn't shown. All it takes over is preparing the material to "line up the same revenue across several models, compare by revenue, and see the unattributed honestly." It doesn't replace GA4 — it complements the comparison that's structurally heavy in GA4. Where to move budget is up to you.
FAQ#
Frequently asked questions#
Q. Does this mean I no longer need GA4's attribution report?
A. No. GA4 is strong enough — and free — for seeing "what happened," meaning the path flow and the rough trend of the split. This article isn't about replacing GA4. It's a complement: grasp the whole picture in GA4, and bring in a different view only for the moment you compare "where to invest next" by revenue.
Q. Why can't GA4 line up four models to compare?
A. Because in October 2023, GA4 retired four models: "first-click," "linear," "time-decay," and "position-based." Only data-driven and last-click remain today. So comparing the same revenue across several models — to see "how the credit shifts when you change the lens" — became impossible inside GA4.
Q. What does it take to surface "where to invest next"?
A. Three things: lining up the same revenue across several models to compare, re-sorting by revenue per session (RPS) instead of count, and seeing untraceable sales (unattributed) without hiding them. With these three in place, the "paths working mid-journey" and the "paths whose visitors buy well" surface, and you can choose where to move budget by numbers, not gut.
Conclusion#
GA4's attribution report shows which ads and paths earned the sale, split into credit. That part is strong, and it's a genuinely useful tool you get for free.
But several views you need for an investment call are missing. Four models were retired in October 2023, leaving just two — so you can't line up the same revenue across several models inside GA4. And the default view tends to under-credit the mid-journey paths like email and display that nudged the buyer along, as the research points out.
So GA4 shows "what happened" well, but stops short of "where to invest next." This isn't about replacing GA4 — it's about filling in the views it misses. Line up the same revenue across several models, compare by revenue, and see the unattributed honestly: with these three in place, you can choose where to move budget by numbers, not gut.
See which ads actually drive revenue, at a glance
Free up to 5,000 sessions/month, AI analyst included. No credit card required. Up and running in 5 minutes.