
Shift next month's budget toward the acquisition source with the largest order value. futureshop's acquisition source report shows order value for each source, so that first move on its own can be made from a single screen. But how much you paid that source is not among the report's metrics, so where the budget goes swaps around the moment ad spend is joined to it. Here is what to line up before joining the two, and how the allocation changes once they are lined up.
Contents
TL;DR#
-
The futureshop acquisition source report shows order value for each acquisition source
Visits, CVR, order count, order value and average order value, readable separately for organic traffic and paid traffic
-
Next month's allocation changes the moment ad spend is joined to it
The ad platform with the largest order value is not necessarily first by ROAS
-
Three things do not line up before you can join them
The period a CSV export covers, the unit acquisition sources and ad spend are counted in, and the way order counts are tallied
1. The futureshop Acquisition Source Report Shows Order Value by Source#
futureshop is a SaaS platform for building EC sites, used by stores in Japan, and its official documentation is published in Japanese.
Open the [reports] menu, then Site reports, then Visits (by acquisition source). Acquisition sources are split into Google, Yahoo!, Bing, Facebook, Instagram, X (Twitter) and others. For each of them the report shows visits, CVR, order count, order value, average order value and that source's share of visits[1]. Acquisition sources are identified from UTM parameters and referrer values[1].
The report is further split into an acquisition-source organic traffic version and an acquisition-source paid traffic version, so the same metrics can be read separately for organic and paid[1][2]. Classification by member and non-member, and by new and repeat, is supported as well[1]. Site access data is available from April 1, 2023 onward[3].
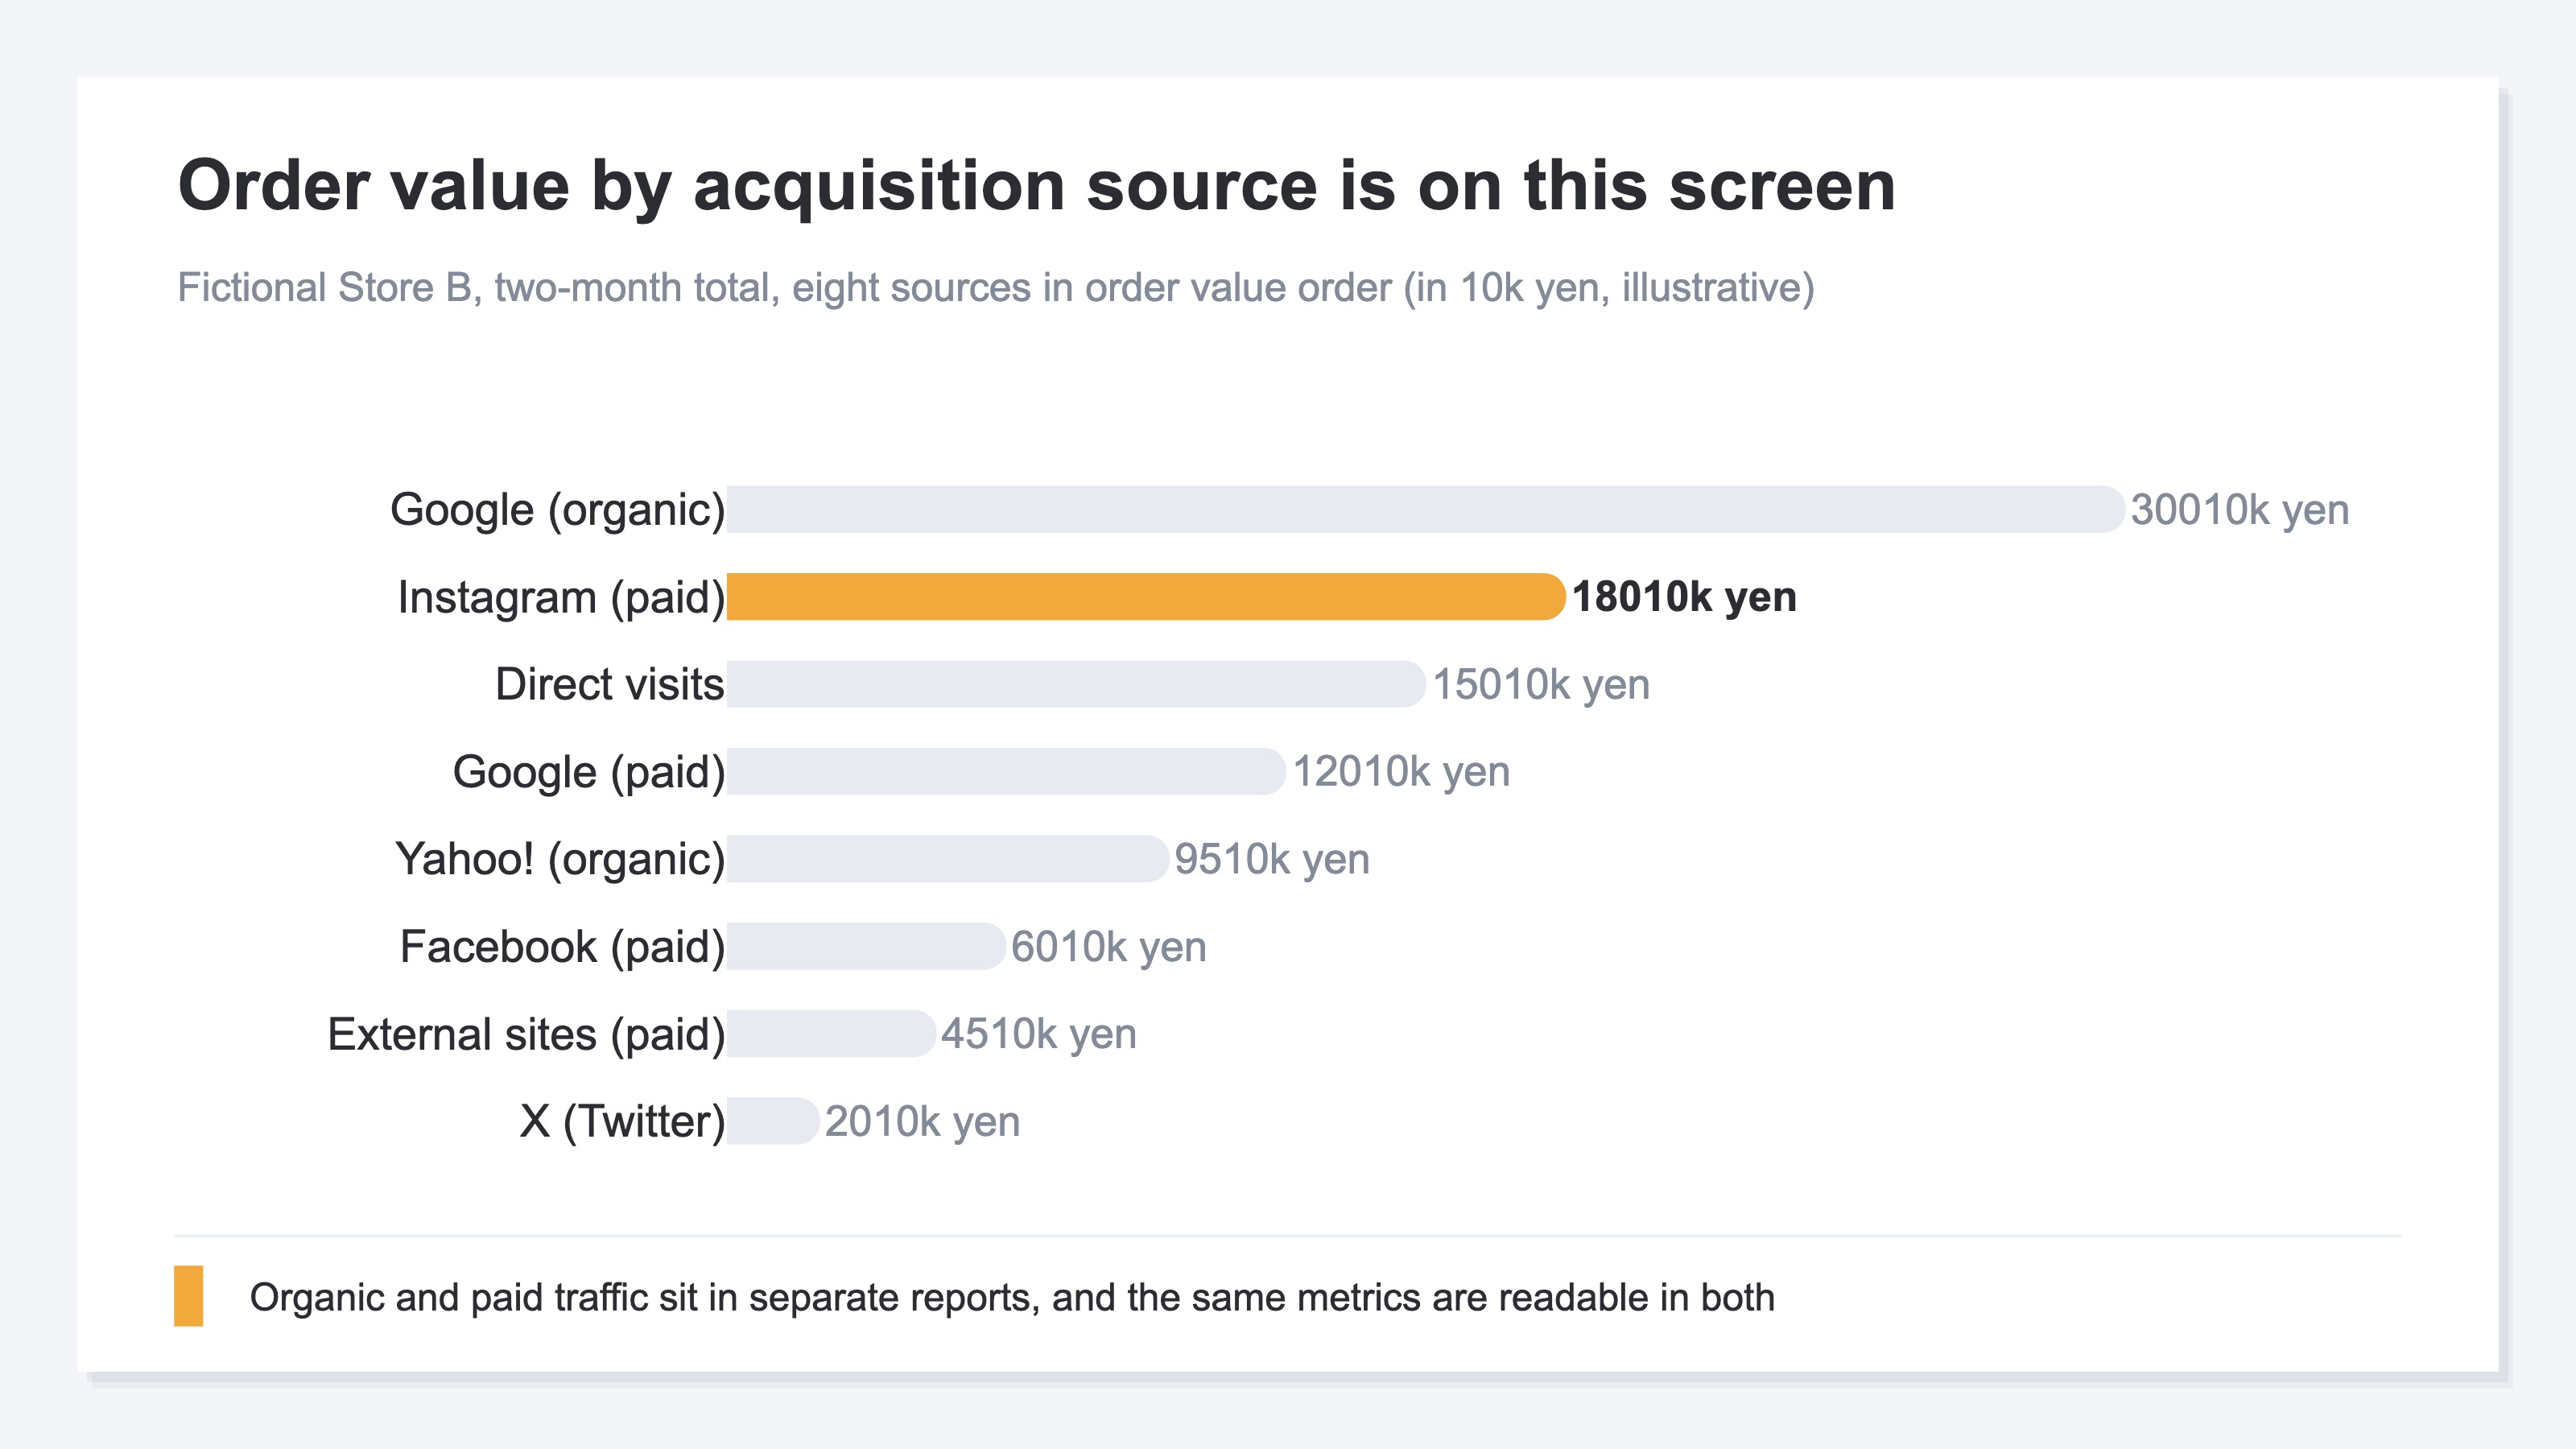
This reports feature is in beta, and it is standard for stores on commerce creator. There is no extra cost to use it[3]. Stores that also run GA4 use the same screen. futureshop outputs to the EC site automatically once the GA4 measurement ID is set in the admin screen, and it supports the recommended ecommerce events as standard[4].
Because order value is shown for each acquisition source, many stores decide where next month's ad budget goes from this screen alone. How far cart-standard reports go in general was covered in Analytics built into EC carts compared. This article narrows to futureshop on its own.
2. Decide by Order Value Alone and the Source You Paid Most Comes First#
The acquisition source report shows order value. So where next month's budget goes can be decided from this screen alone. If Instagram has the largest order value, shift toward Instagram. It is fast, and the grounds are inside the screen.
Write out the value the investment decision rests on once.
ROAS = order value / ad spend
Order value can be read from the acquisition source report. Ad spend sits in the Meta Ads or Google Ads admin screen. And an acquisition source with a large order value is usually a source that a large ad spend went into. Rank by the numerator while the denominator stays hidden, and the ranking drifts toward the ranking of what was spent.
The official manual itself, in its usage example for the paid traffic report, suggests checking whether a return is being obtained on what was spent on delivery[2]. The ad spend used for that check is assumed to be brought by the merchant. The same shape of problem on a different cart was covered in Seeing BASE revenue by channel.
Bringing ad spend over is something any store can do today. The hard part is that the ad spend you brought and the order value cannot be compared on the same terms as they are. And this decision has a deadline. Next month's delivery starts at the beginning of the month, so the joining work concentrates into the last few days of the month.
3. Period, Unit and Tallying Method Do Not Line Up as They Are#
The first is the period you can export. The items downloadable from [Export data (CSV)] on the paid traffic report are target customer, acquisition source, visits, CVR, order count, order value and average order value[2]. The official manual states plainly that daily, weekly and monthly data cannot be downloaded, and that what comes out is the total within the display period for each item[2]. To compare month by month, you change the period and export again.
The second is the unit acquisition sources and ad spend are counted in. futureshop tallies Instagram and Facebook separately[1]. Ad spend, meanwhile, is billed at the Meta account level. Joining them means adding Instagram and Facebook together into Meta before comparing.
The remaining one is the way order counts are tallied. futureshop defines it this way: when a single session, meaning within 30 minutes, is accessed from more than one referrer, the count goes to the source of the first visit, first come first served[1]. The ad platform side tallies through its own measurement tag placed on the order completion page[5]. futureshop takes the first point of contact and the ad platform tallies from the ad click, so the same delivery over the same period does not produce matching order counts. Joining starts from explaining that difference.
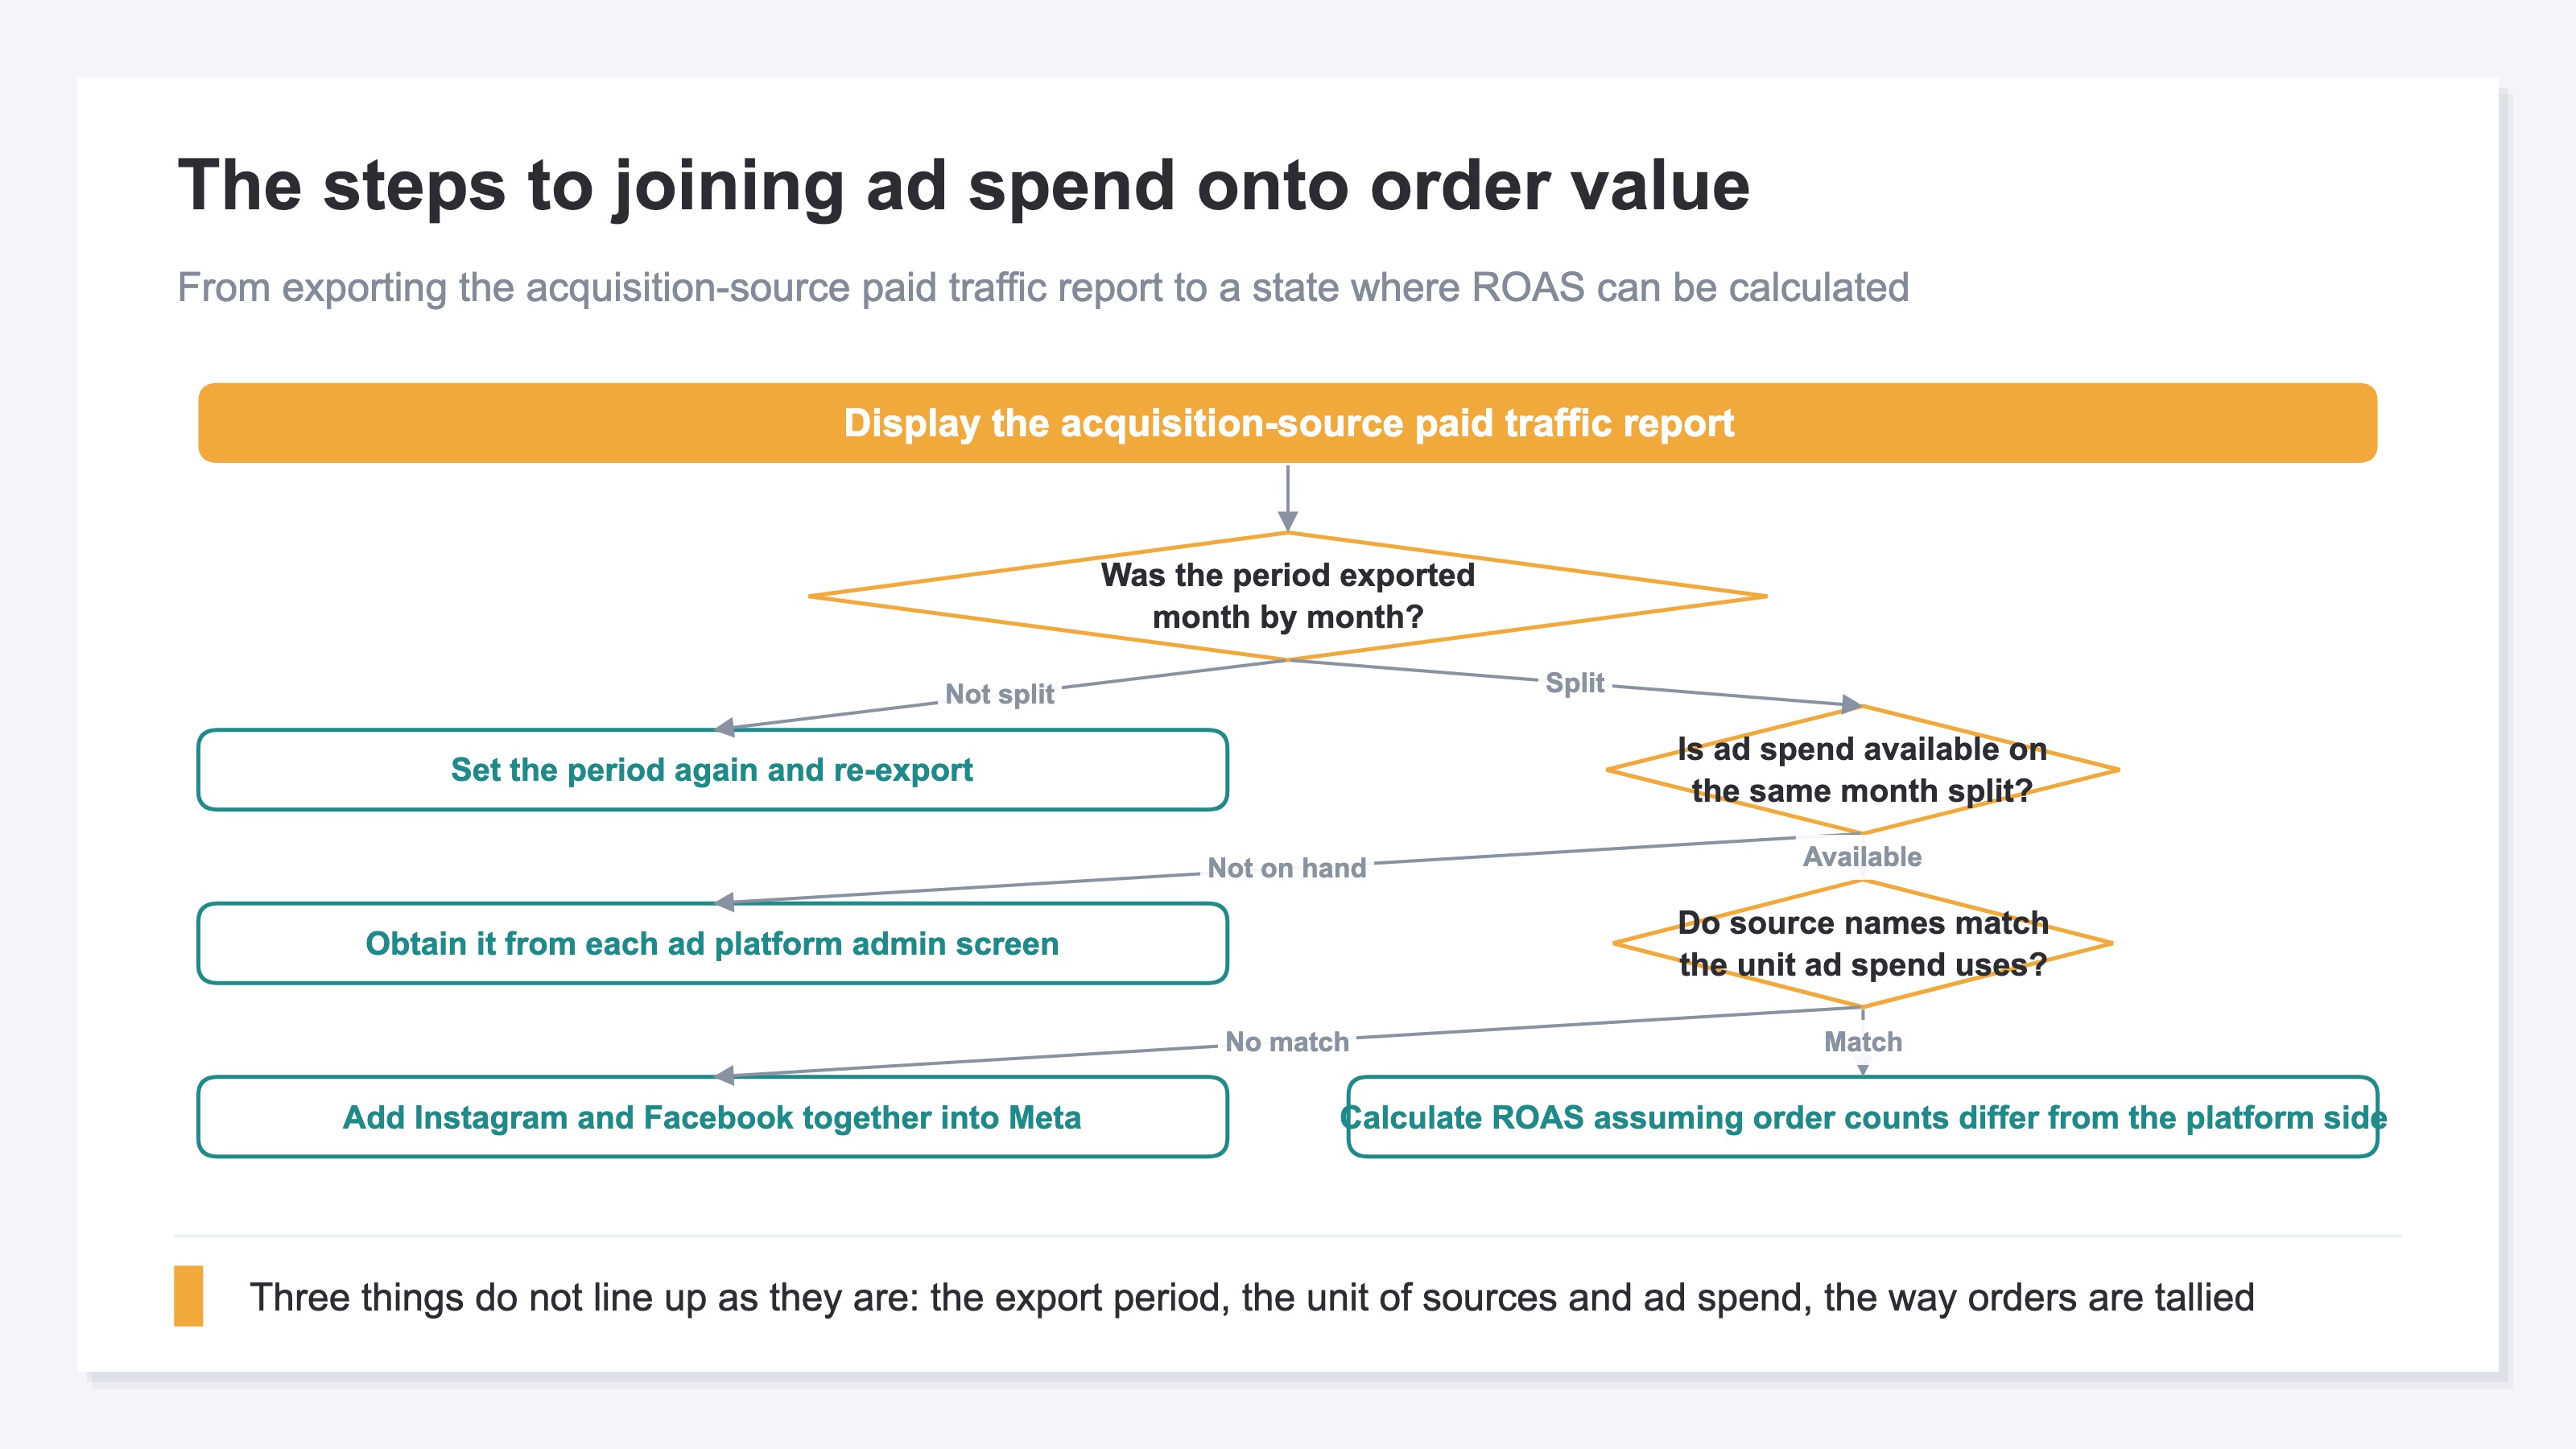
Of these, the last two come back in the same shape every month, even after you line them up once. How the ROAS an ad platform reports diverges from the ROAS measured on your own site was covered in Summing platform ROAS overstates it.
4. Ranking by Order Value and Ranking by ROAS Put Different Platforms on Top#
Join ad spend, and the platform that comes first by order value and the platform that comes first by ROAS turn out to be different ones.
Take fictional Store B's two-month total. The ¥450,000 tallied under external sites (paid traffic) in the acquisition source report came through Criteo, a retargeting ad. Line the units up to platforms and order value is ¥2,400,000 for Meta, ¥1,200,000 for Google Ads and ¥450,000 for Criteo. Ad spend is ¥1,200,000 for Meta, ¥1,000,000 for Google Ads and ¥150,000 for Criteo. ROAS comes to 2.0, 1.2 and 3.0.
First by order value is Meta. First by ROAS is Criteo, which was last by order value. Google Ads is second by order value, but on how far it has earned its ad spend back it drops to last.
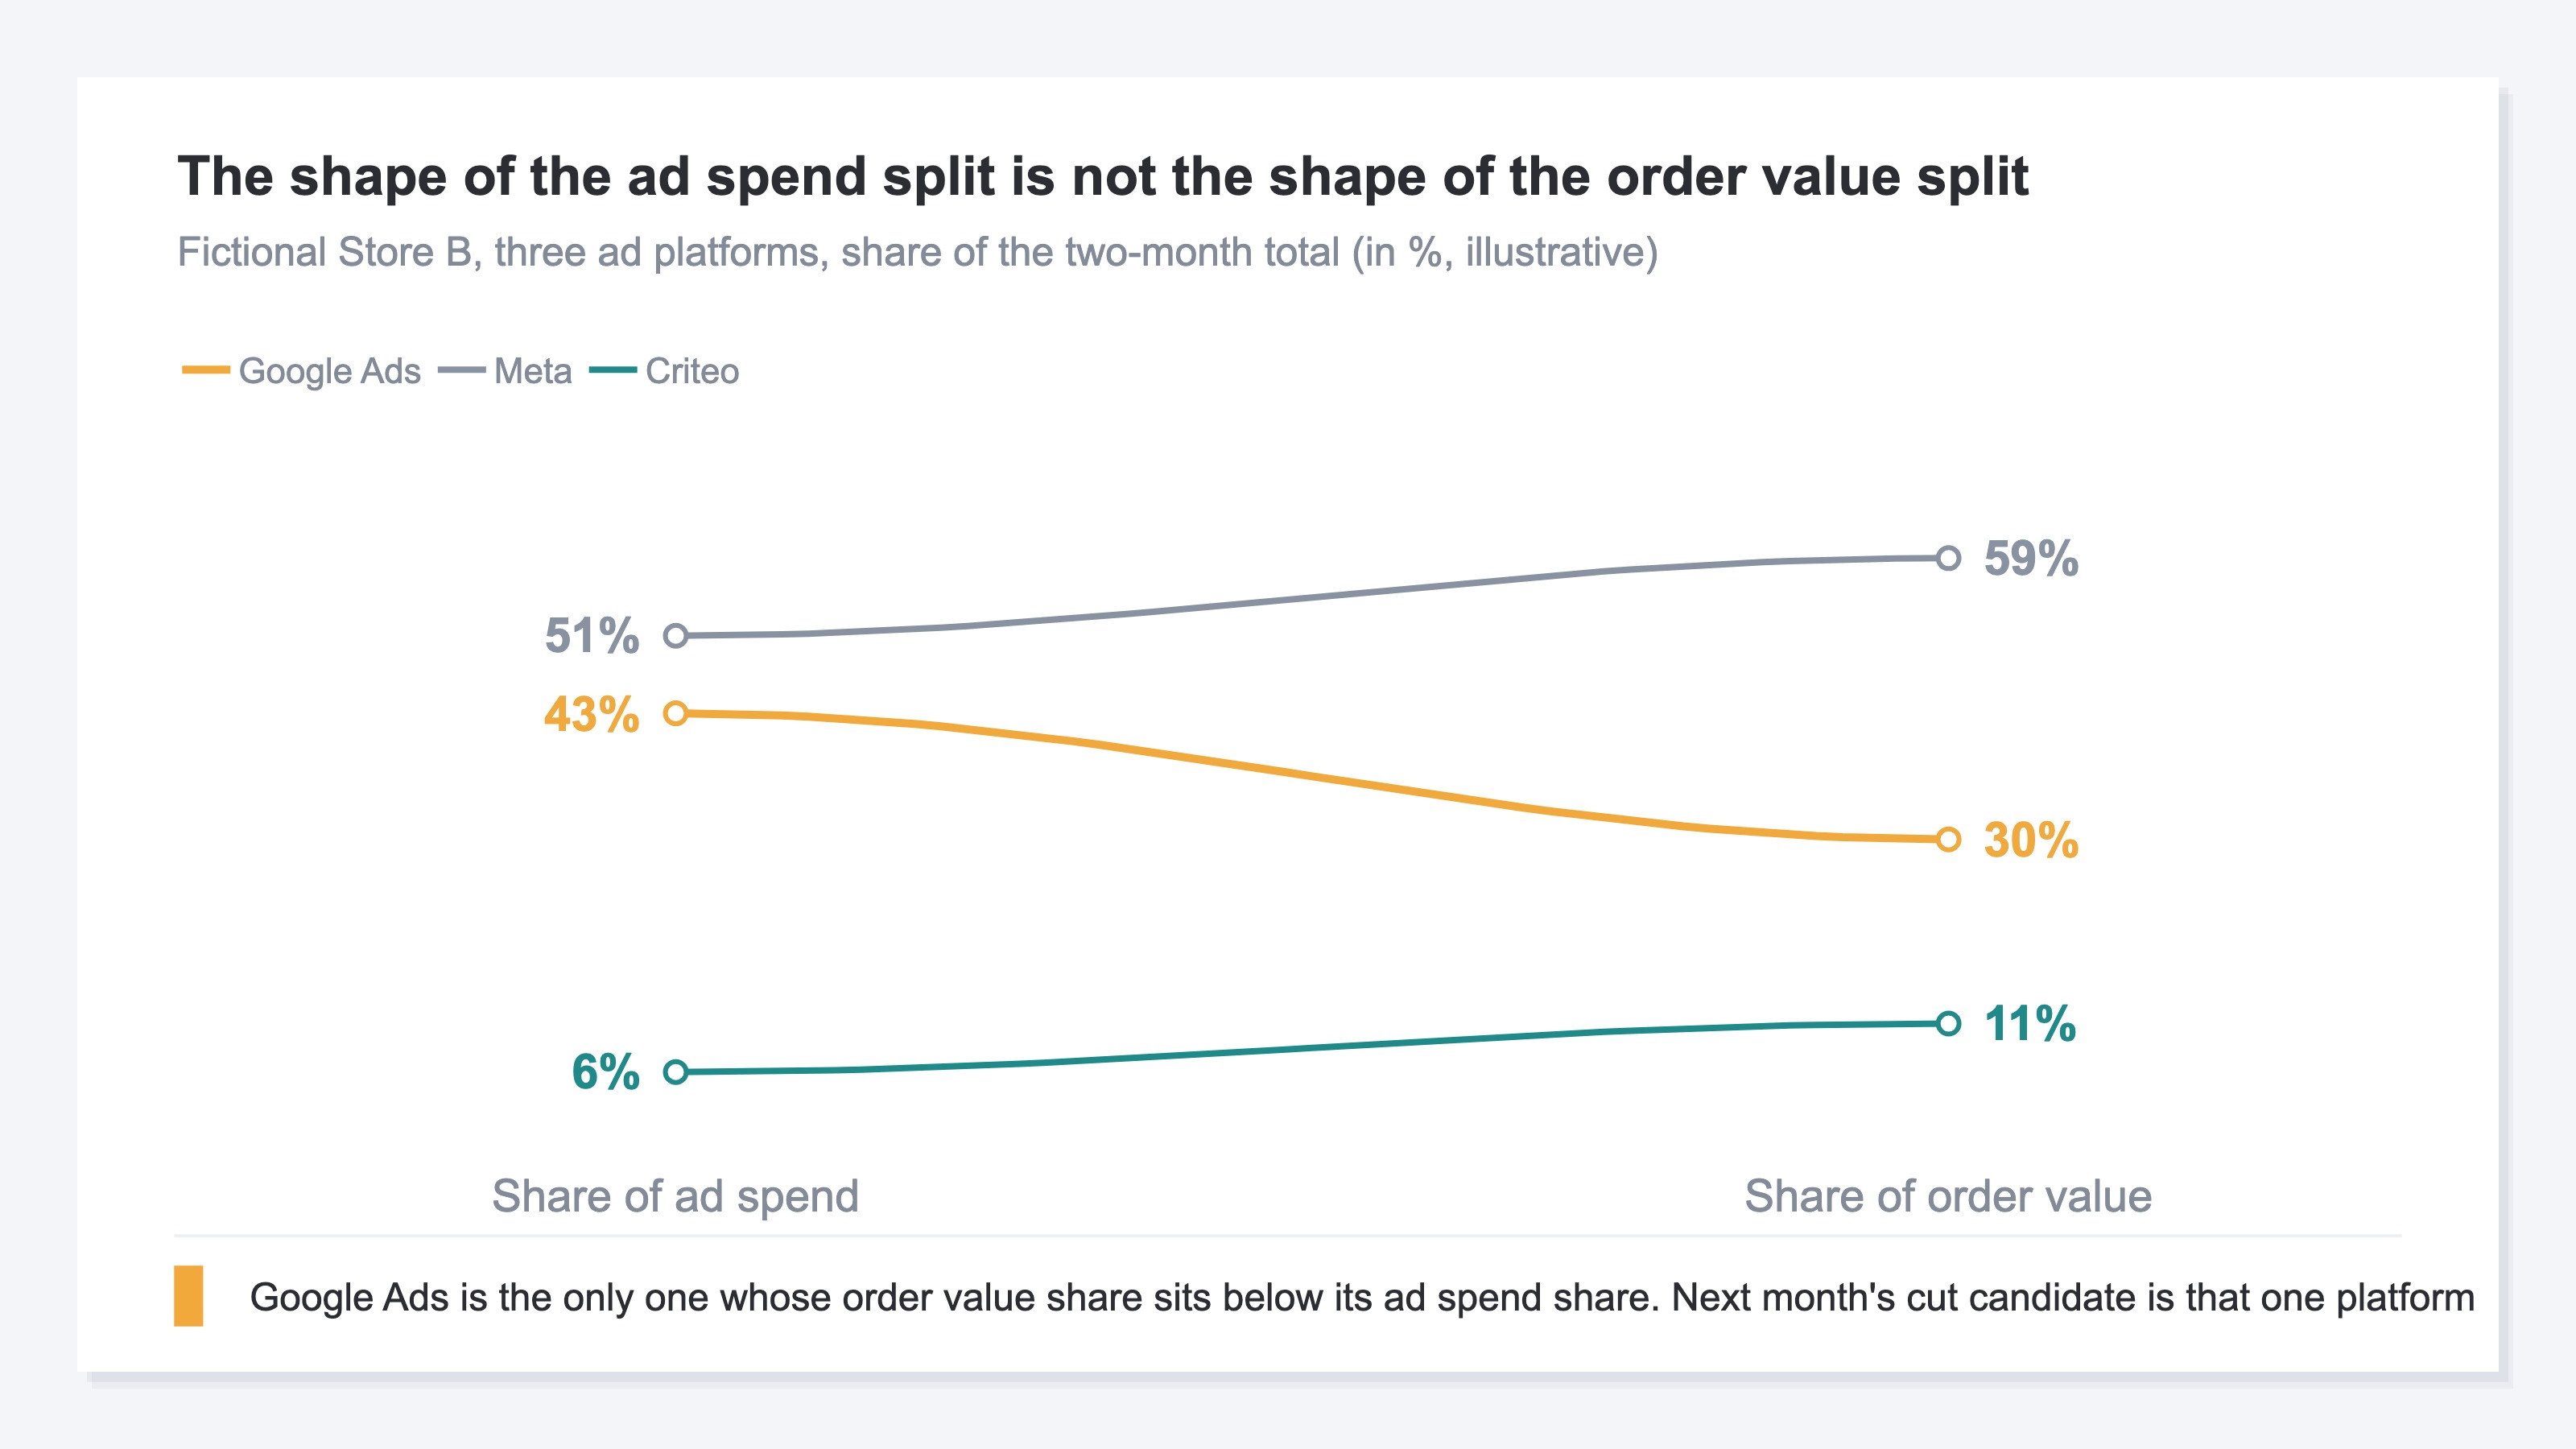
Compare the share of ad spend against the share of order value and the only one that falls is Google Ads. It takes 43% of the ad spend across these three and accounts for 30% of the order value. When next month's allocation is reviewed, the candidate to cut narrows to this one platform.
The figures up to here are a two-month total. Since what can be downloaded is only the total for the display period[2], exporting two months in one go leaves nothing on hand about what moved during those two months. Reviewing allocation month by month was covered in Reviewing channel efficiency monthly.
Nobody owns this joining work. futureshop tallies the orders that occurred on the store's own site, and Meta Ads and Google Ads tally the results of the ads they delivered. Both are accurate within their own range. Only the step of putting the two on the same terms is left over every month, in nobody's territory.
RevenueScope solution
futureshop's acquisition sources and Meta's billing unit line up at the point of registration. Traffic from Instagram and Facebook is grouped into the Meta platform before ROAS is calculated, so no manual renaming work is left over. Ad spend can be registered by two routes: entered into a form by year, month and channel, or imported in bulk from CSV.
Fictional Store B's breakdown by ad platform (read over the last 30 days, illustrative)
| Platform | Revenue | Ad spend | ROAS |
|---|---|---|---|
| Meta | ¥1,150,000 | ¥720,000 | 1.6 |
| Google Ads | ¥550,000 | ¥500,000 | 1.1 |
| Criteo | ¥250,000 | ¥50,000 | 5.0 |
Note: this table is one example from a fictional store, built for teaching. The demo screen is drawn with the sample store's sample data, refreshed daily, so the figures there change depending on the day it is opened.
Widen the period to three months and the same three platforms come to 2.0 for Meta, 1.2 for Google Ads and 3.0 for Criteo. Over the longer window Meta sits at 2.0, and the fact that it had slipped to 1.6 over the last 30 days never surfaces. Shift toward Meta again next month on the grounds of that three-month 2.0, and the addition goes to the side that had been sliding.
ROAS here is revenue measured on the store's own site divided by ad spend. Meta's revenue is the figure with Instagram and Facebook traffic added together, and it includes traffic that did not come from ads. Impressions, clicks and conversions as reported by the ad platform appear in the same breakdown, so the material for joining them against first-party revenue is in place.
FAQ#
Frequently asked questions#
Q. Is there a way to register ad spend in futureshop's acquisition source report?
A. The official pages checked describe no feature for registering ad spend[1][2][3]. The metrics shown are visits, CVR, order count, order value, average order value and each source's share of visits[1]. Ad spend is obtained from each ad platform's admin screen and joined outside futureshop.
Q. Does connecting GA4 get ROAS onto the screen?
A. What futureshop's GA4 integration outputs automatically is the recommended ecommerce events, such as product views, add to cart and purchase[4]. Ad spend is not among the events the official page lists[4]. For order value by acquisition source, futureshop's own report gets there without any extra work.
Q. The reports feature is in beta. Is it sound to use for business decisions?
A. The official page states plainly that it is in beta[3]. It is standard for stores on commerce creator and carries no extra cost[3]. Site access data has been provided from April 1, 2023 onward[3]. If order value by acquisition source is going to be compared across months, keeping the exported CSV on the store's own side as well makes it certain.
Summary#
futureshop's acquisition source report shows visits, CVR, order count, order value and average order value for each acquisition source, readable separately for organic and paid traffic[1][2]. What is not on hand as material for the decision is ad spend, which is not among the metrics this report shows[1].
Before ad spend can be joined, three things do not line up:
- A CSV export gives only the total for the display period; daily, weekly and monthly downloads are not available[2]
- Instagram and Facebook are separate acquisition sources, but ad spend is billed at Meta's unit[1]
- Order counts go to the first point of contact on futureshop's side[1], while the ad platform side tallies through its own measurement tag[5]
Tool selection itself is covered in Choosing an EC analytics tool.
How many months does the CSV behind next month's allocation add up to?
See which ads actually drive revenue, at a glance
Free up to 2,000 sessions/month, AI connection included. No credit card required. Up and running in 5 minutes.
References#
- [1] futureshop "Visits (by acquisition source)" (2026)
- [2] futureshop "Visits (by acquisition source - paid traffic)" (2026)
- [3] futureshop "Report and analytics features (beta)" (2026)
- [4] futureshop "Access analytics" (2026)
- [5] futureshop "How do I install the conversion tags used to measure ad performance?" (2026)