How many people visited from the QR code you printed on a flyer, and how much did they buy? Open GA4 and those visits are lumped into Direct, with no way to pull print promotion out on its own. This is not a measurement fault — a URL opened from print carries no referrer information, and that is how the mechanism works. So what do you measure against instead? Here is the order to work it out.
Contents
TL;DR#
- A visit from a printed QR code carries no referrer information, so GA4 classifying it as Direct is correct behavior
- What you print from here on can be split by medium and by placement if you add UTM to the URL the QR code resolves to
- There is no way to add UTM afterwards to past sessions you forgot to tag. Splitting only works from the day the marker went on
- In one example from a fictional store, the card by the register accounted for close to 60% of sessions and was the only placement with zero revenue. The leader in volume and the leader in revenue were different
- Even after the tags are in, the job of lining print, ads and email up on the same basis every month stays with you
1. GA4 Classifies Visits From Print QR Codes as Direct#
Reviewing your settings will not correct this classification. It is not something to correct.
When someone clicks a link on a web page and moves to another site, the browser sends referrer information — which page they came from. GA4 reads that to separate a visit from Instagram from a visit from Google search.
A printed QR code has no preceding page. The camera app on a phone simply reads the URL and opens it, so there is nothing to send. From where GA4 sits, it cannot be told apart from a visit where the URL was typed by hand or opened from a bookmark, and it is recorded as Direct along with them.
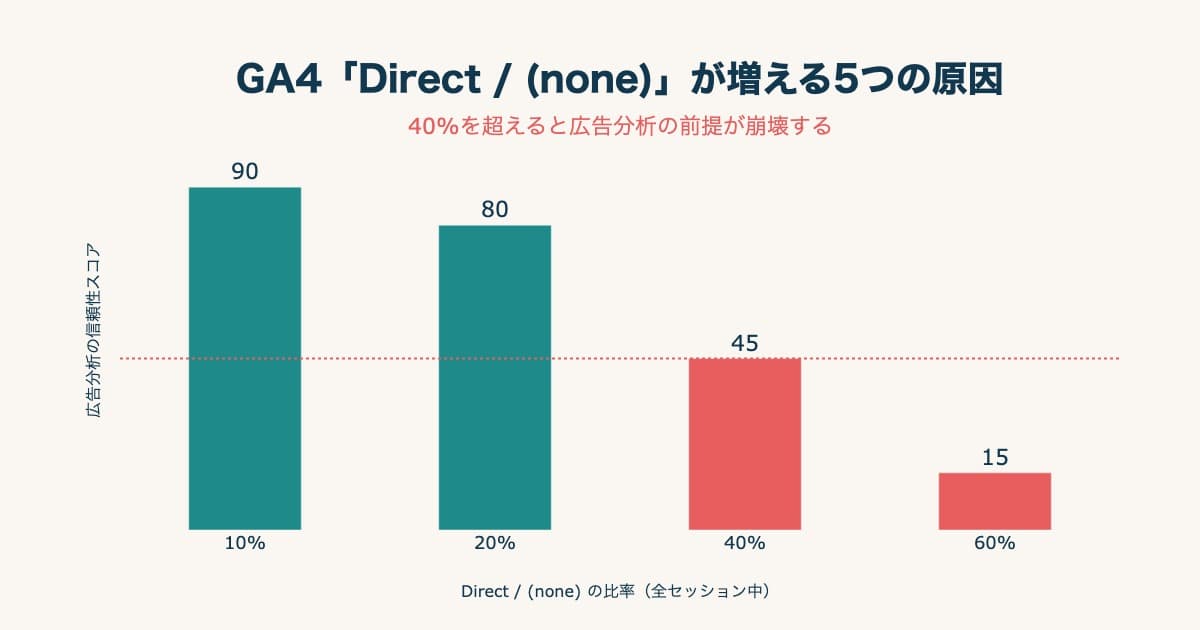
Which means Direct swelling in a month when you are running print promotion is a result the mechanism predicts. Changing how the QR code itself is generated, or specifying which app reads it, does not bring referrer information into being. Print QR codes are not the only reason Direct grows, so if you want to walk through the possibilities, see 5 causes behind GA4 Direct / (none). This article stays with QR codes.
Can print promotion be measured at all? The question ends here. If the referrer is not going to be handed over to you, then put the information into the URL that gets opened. Write into what you print from here on which medium, and which spot, the scan came from. That is the only way to measure print promotion.
2. What You Print From Now On Can Be Split With UTM#
Add UTM parameters to the URL a QR code resolves to and the visits that were lumped into Direct come apart by medium and by placement.
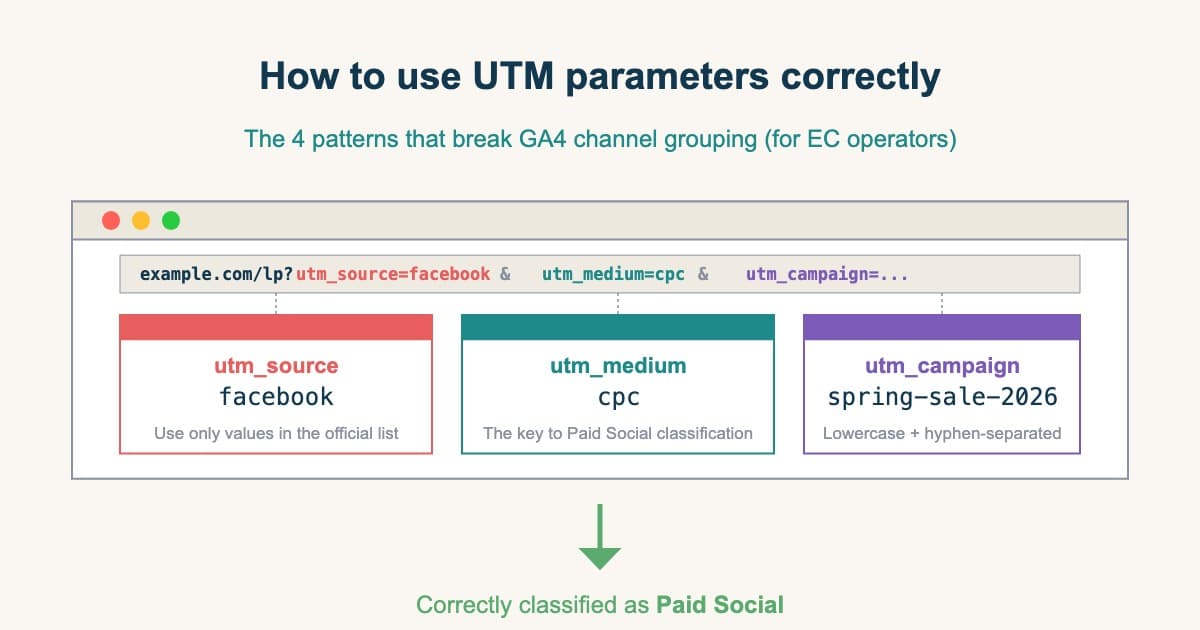
UTM parameters are markers appended to the end of a URL to write down where the visit came from. Google's own help says that when you add parameters to a URL, you use three of them: utm_source, utm_medium and utm_campaign[1]. Those three are what you decide, and the design principle for each fits on one line.
Put the type of medium in utm_source. Use a value that reads as what you printed on — flyer, poster, pop. Fix utm_medium to one shared value that will later identify this as print promotion. Either print or offline is fine, but settle on one inside the company and use only that value from then on. Put the placement and the period in utm_campaign, at a grain that later lets you tell "the flyer inserted in August" apart from "the in-store poster in August."
For a flyer inserted in the package and an in-store poster, for example, the URLs the codes resolve to look like this.
https://example.com/?utm_source=flyer&utm_medium=print&utm_campaign=flyer-insert-2608
https://example.com/?utm_source=poster&utm_medium=print&utm_campaign=poster-store-2608
Keep the values in lowercase with hyphens. A single character of difference makes it a separate campaign in the aggregation, so if flyer-insert and flyer_insert get mixed together, one flyer splits into two. You can build the URL by entering the values in the Campaign URL Builder[2], then generate the QR code from the finished URL. How naming conventions mesh with GA4's own channel grouping logic is laid out in the 4 UTM patterns that break GA4 channel grouping.
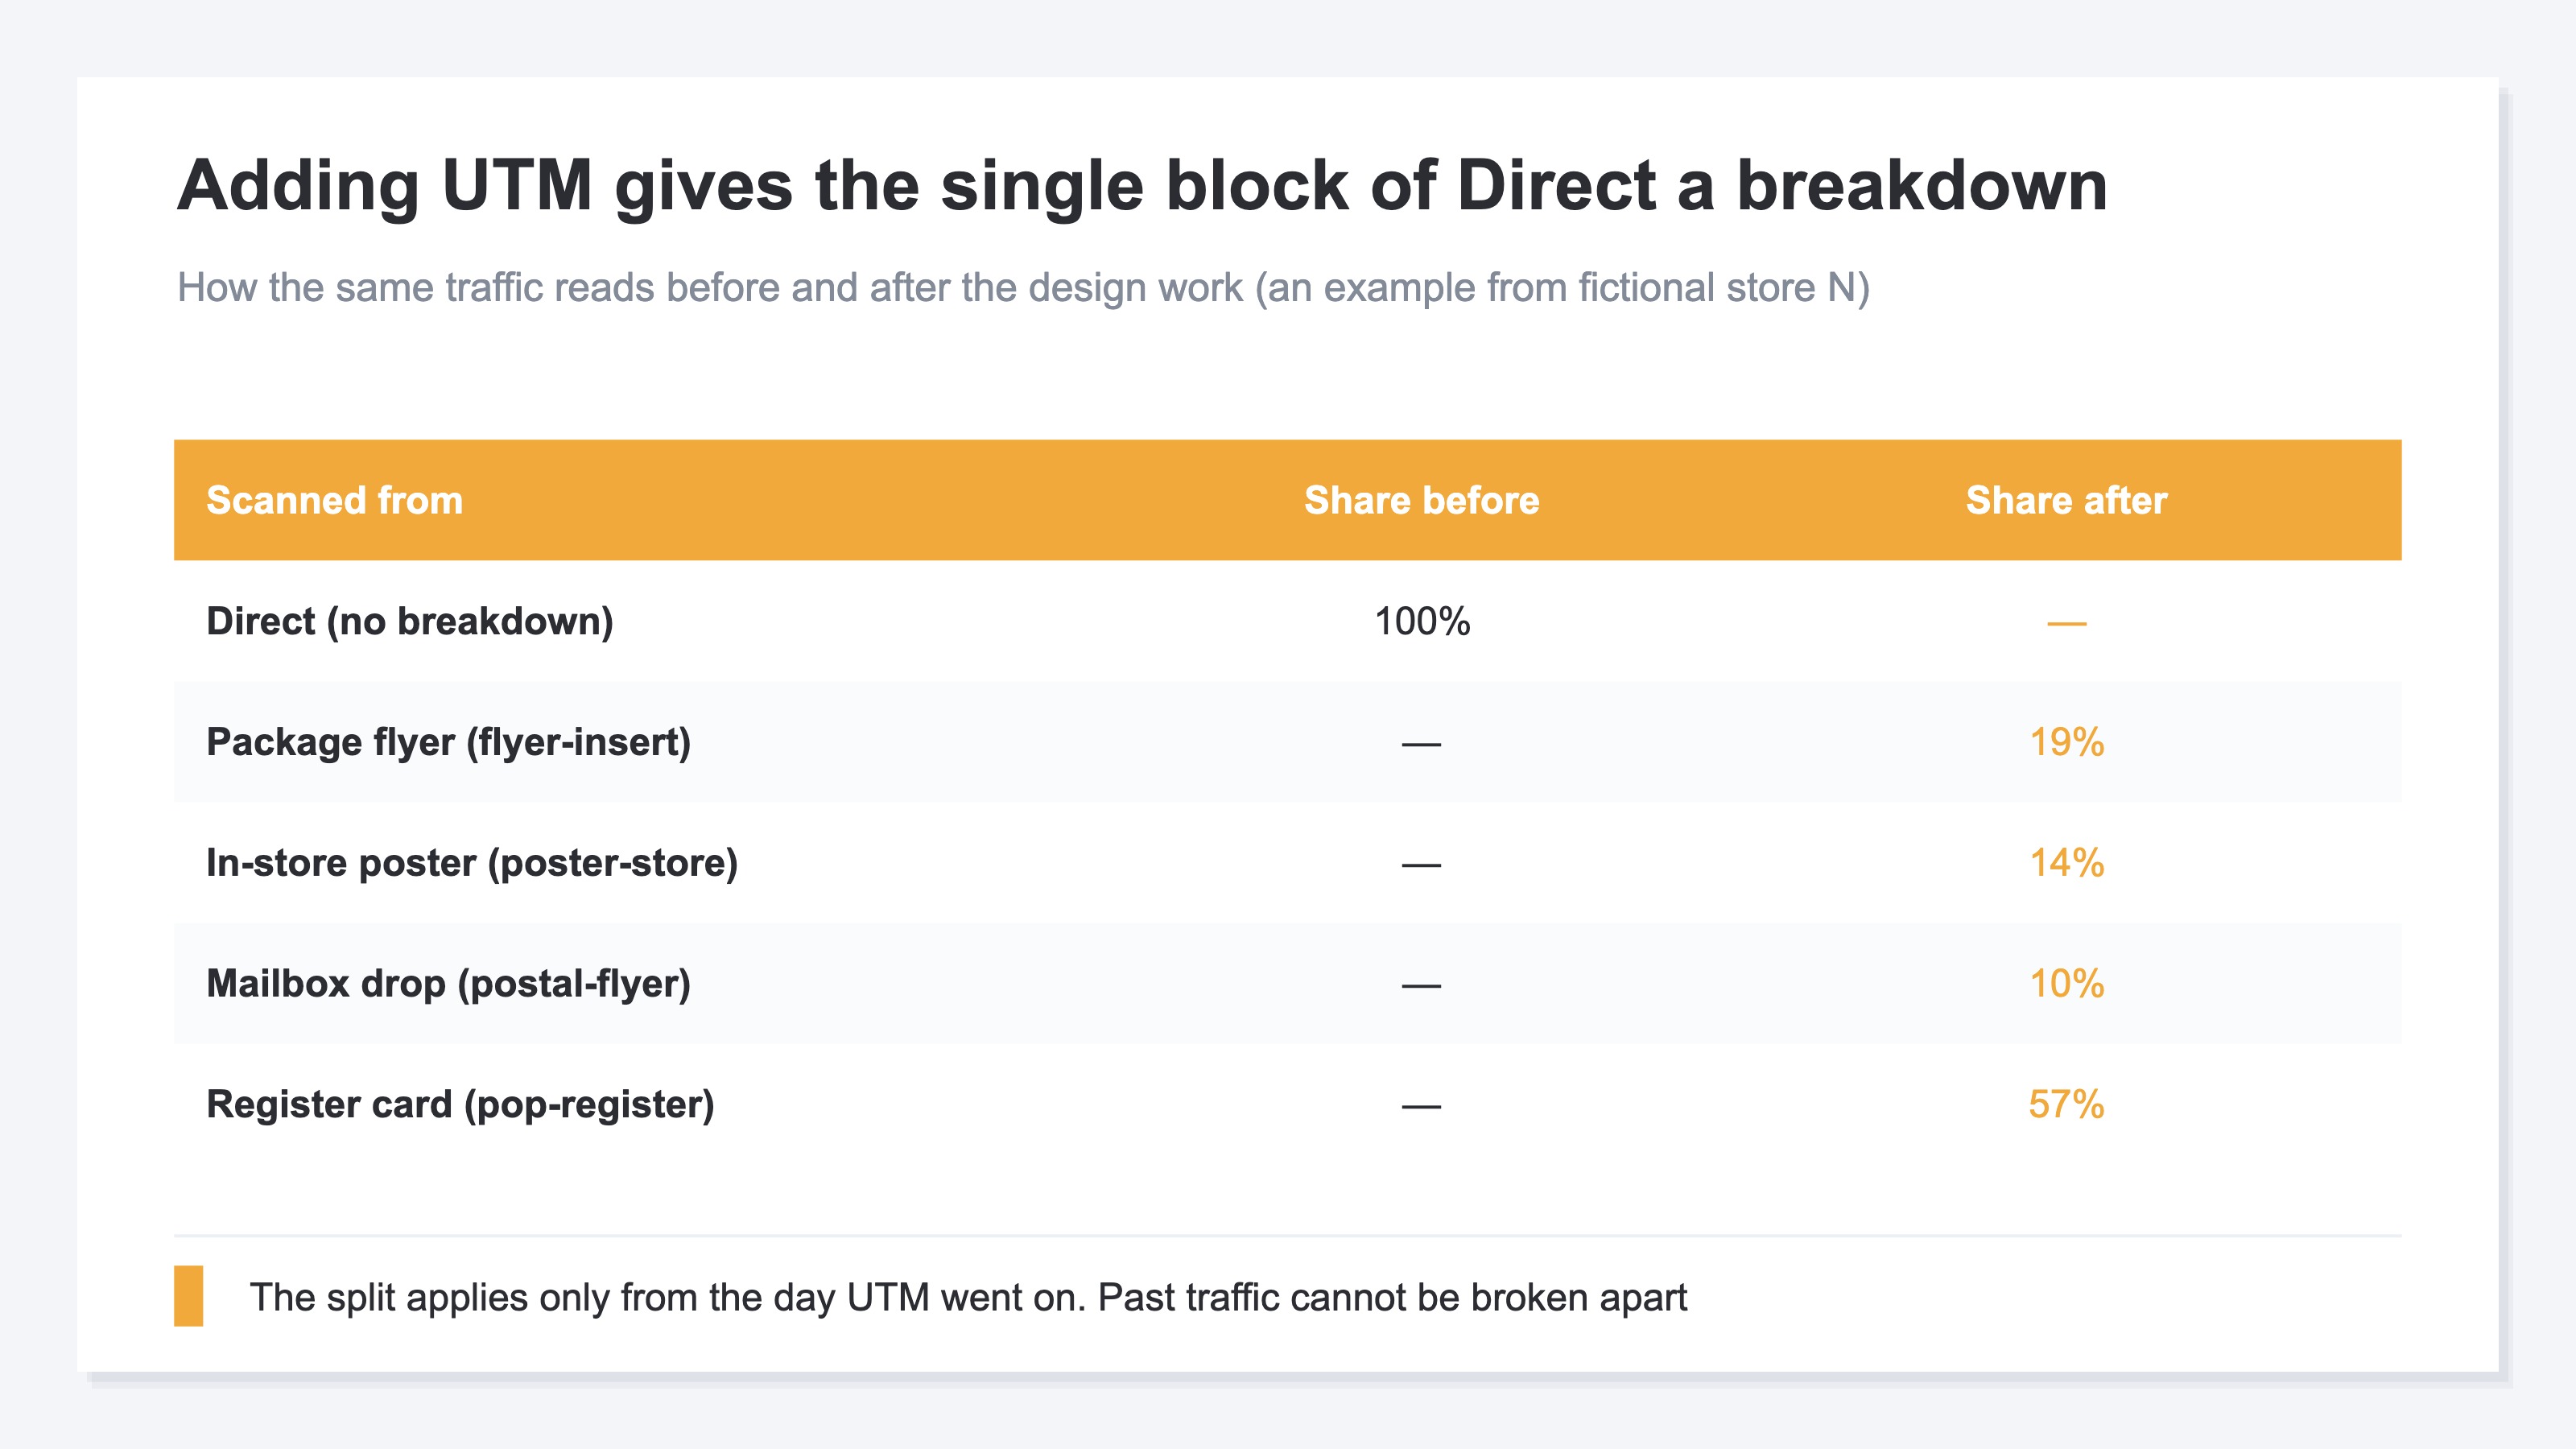
The point to hold onto here is that this is about today onward only. Past visits from flyers printed without UTM stay bundled in Direct. There is no method for adding UTM to them after the fact. Which means how much the flyer from six months ago sold cannot be extracted now.
So the period you can compare is counted from the month you started. Tagging the very next print job is the fastest way to accumulate something to decide on.
3. Only the Most-Scanned QR by the Register Earned Zero Revenue#
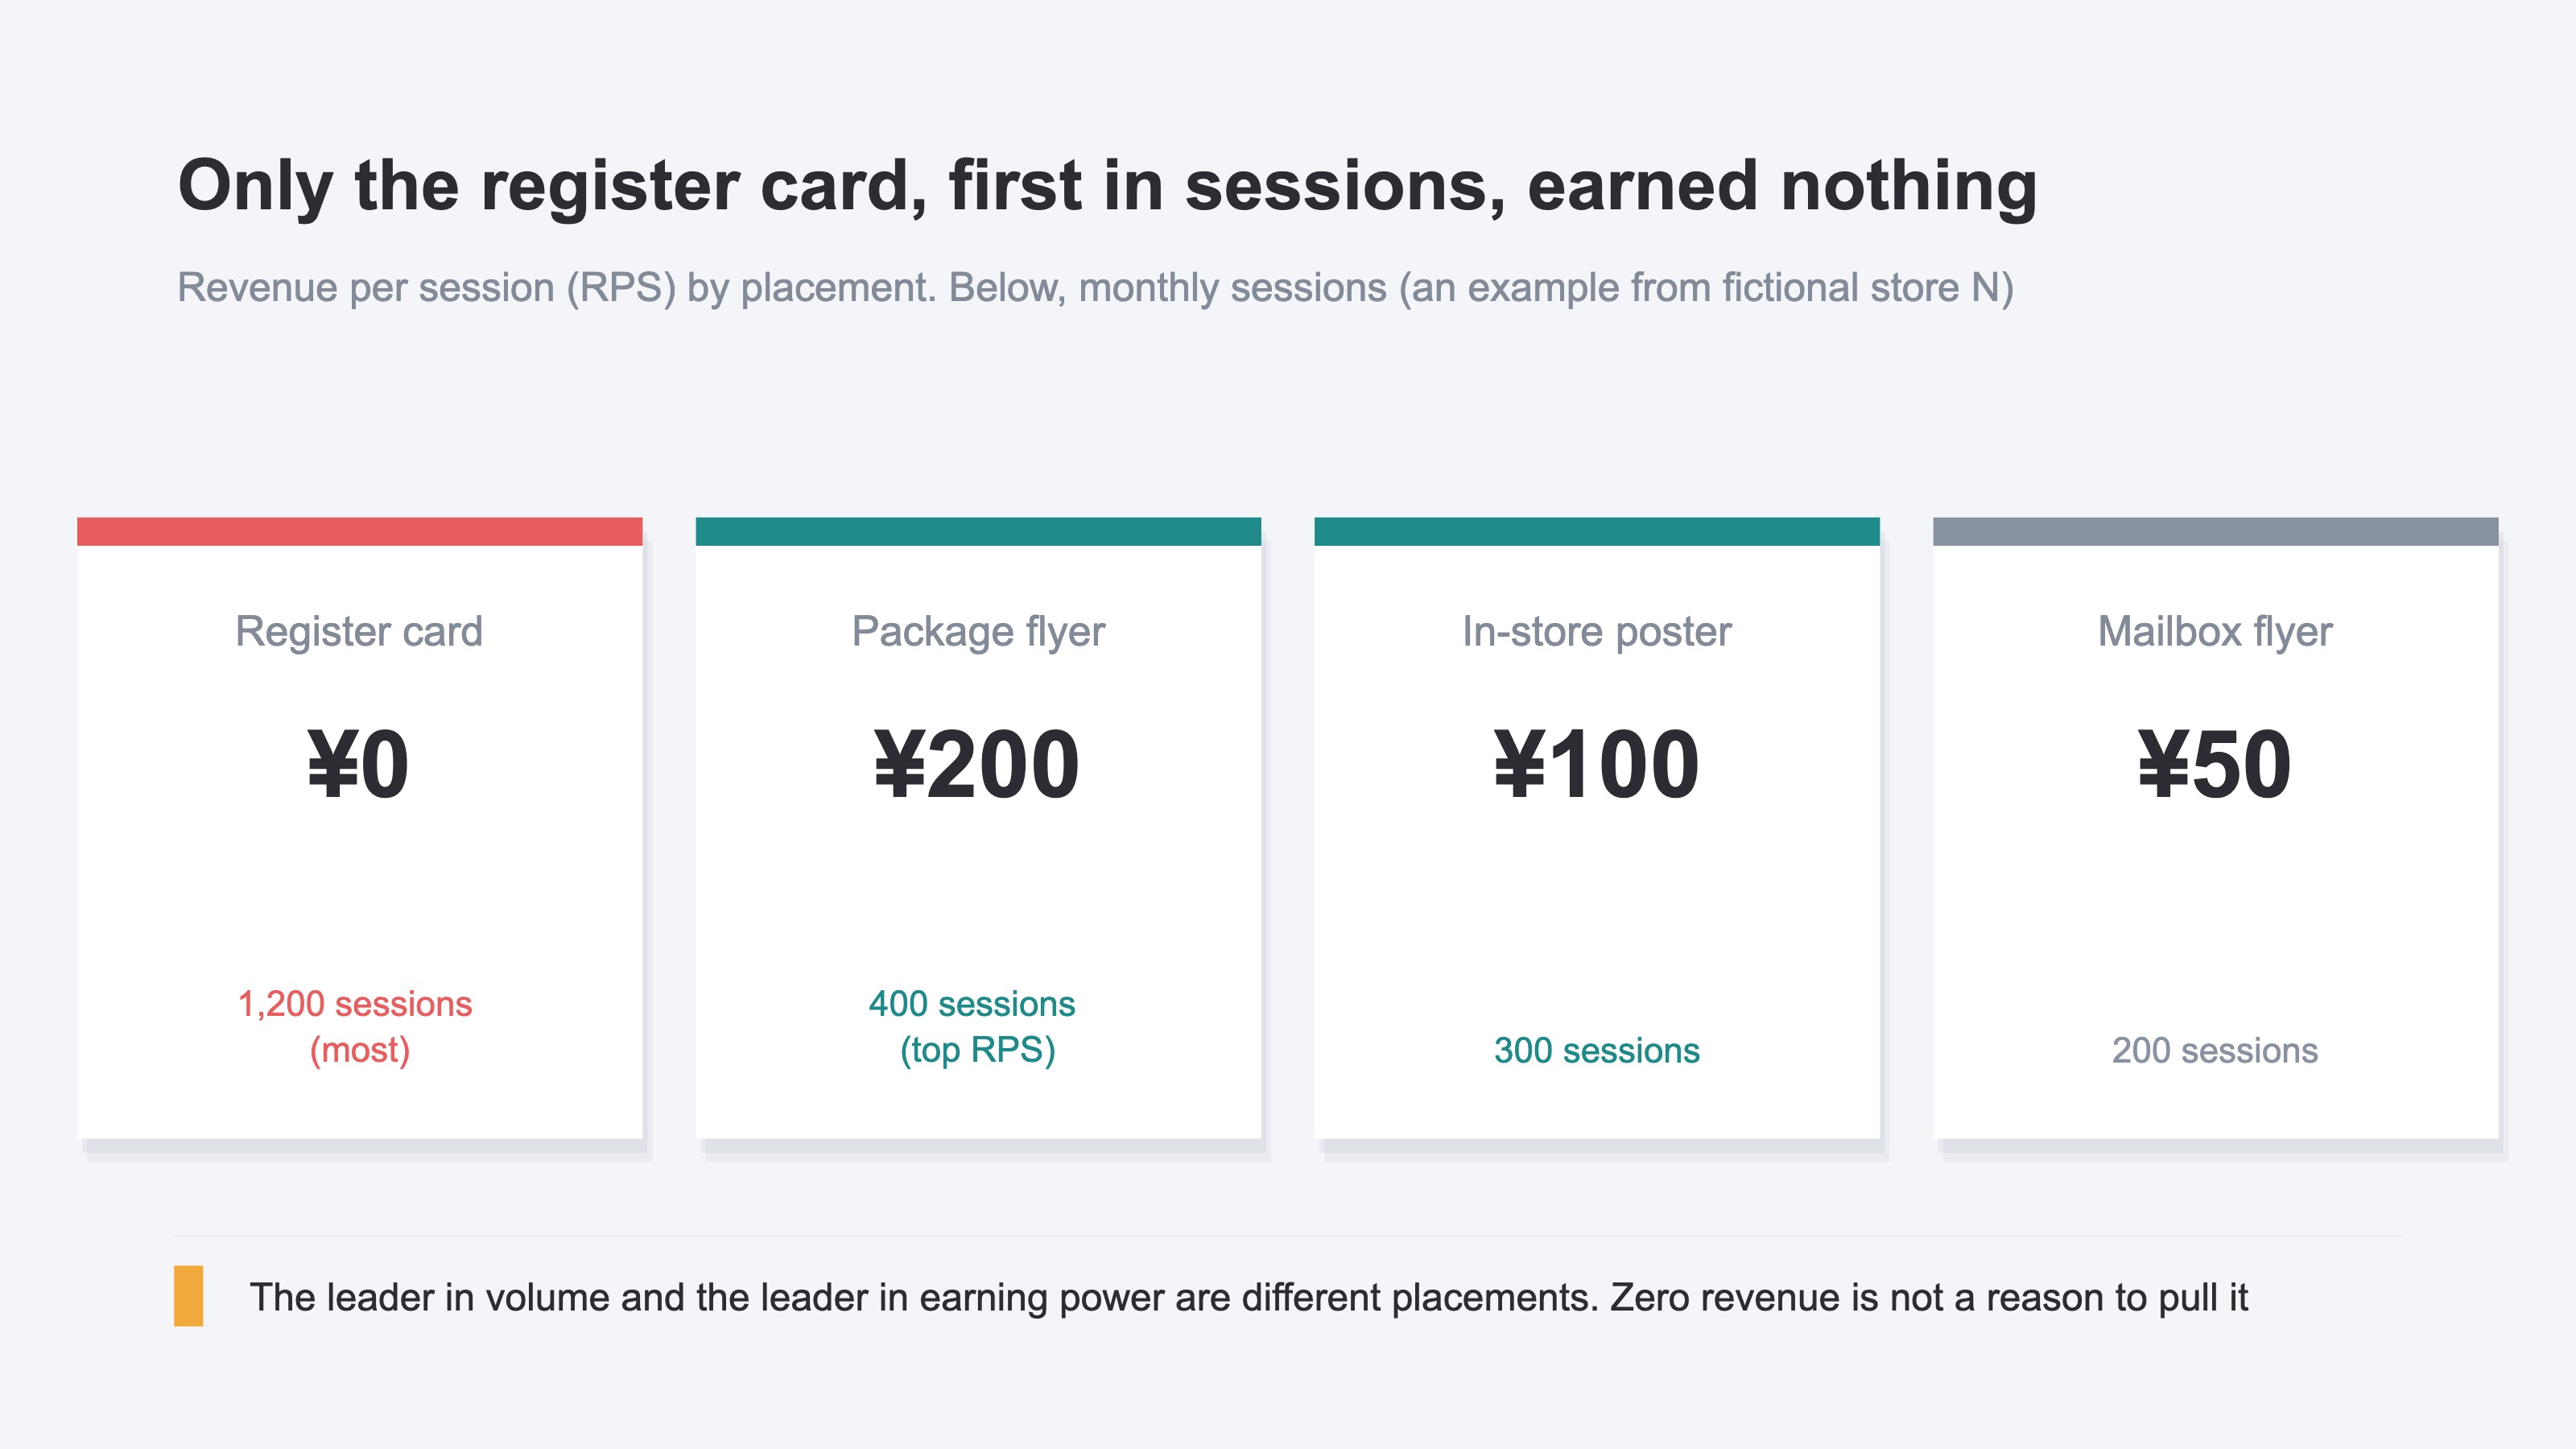
One placement out of four had zero revenue. And that same one accounted for close to 60% of all sessions.
This is one example from fictional store N, a coffee bean shop running a physical store alongside its online store. QR codes were placed in four spots, each given its own campaign name, and one month was tallied up.
| Placement | Sessions | Revenue | RPS |
|---|---|---|---|
| Card by the register | 1,200 | ¥0 | ¥0 |
| Flyer in the package | 400 | ¥80,000 | ¥200 |
| In-store poster | 300 | ¥30,000 | ¥100 |
| Mailbox-drop flyer | 200 | ¥10,000 | ¥50 |
Read by RPS (revenue per session, or how much one visit earned), the leader is the flyer in the package. The card by the register, which earned nothing, gathered 1,200 of the 2,100 sessions — first place by volume.
Think about who is doing the scanning and the explanation follows. The card by the register is scanned by a customer who has just finished paying. What they wanted was bought moments ago, so opening the online store gives them no reason to order that day. Scanned 1,200 times inside the same month, it still connects to no revenue.
The flyer in the package works the other way. It gets scanned when the parcel is opened, at the moment the buyer decides whether they liked the beans in their hand. That makes it the entrance to the next order. Of the four placements, 400 sessions and ¥80,000 was the most efficient entrance.
This is not the point at which you decide to pull the card by the register because it earned nothing. Its role is different. A QR scanned after checkout may well be working as a prompt for the next visit or the next purchase. But confirming that possibility also takes numbers for each placement. Without a separate campaign name on each spot, this table cannot be built at all.
Which is to say that measures that raise scan counts and measures that raise revenue are different measures. Placements get evaluated not on volume but on how much a single visit earned.
4. Splitting Starts the Day You Add UTM and the Monthly Work Remains#
GA4 does let you check revenue by campaign for whatever you have tagged with UTM. What remains from there is the work of reading that grain in the same shape every month.
First there is the limit in time. The split applies only from the day UTM went on, and whatever was bundled into Direct before that cannot be broken apart now. "Which worked better, last year's flyer or this year's?" does not hold together if there is no marker on last year's side. Print promotion often runs only a few times a year, so it takes a fair number of months before the comparisons pile up two and three deep.
Then there is the limit in operation. A drift in notation that turns flyer-insert-2608 into Flyer-Insert-08 gets counted as a separate campaign, so the one convention agreed inside the company has to be honored at every print job. And on top of that, every month, the lining-up comes around.
Decisions about print promotion are "do we print next month, do we move the placement, do we cut the quantity," and they run monthly. Each time, last month and this month are put into the same shape to see how RPS moved for each placement. And print is not the only thing you want to compare against. Only once the ads, social and email running in the same month are lined up on the same basis does it become clear whether to raise the print budget or move it into ads. That lining-up happens every time a decision does. The way to read revenue efficiency at the campaign level is covered in campaign-level revenue efficiency.
And untagged visits keep arriving. Print QR codes are not the only route into Direct, and the rest of the make-up is covered in when AI traffic hides in Direct. To decide on print promotion, you need the tagged portion and the untagged portion separated, and both readable on the same screen.
RevenueScope solution
The part where print promotion gets put on the same basis as ads and email is what RevenueScope solves. Sessions, revenue and RPS by channel sit on one screen, so print QR codes, ads and email are all compared on the same metrics. The only thing added for measurement is a single line of tag placed on your own site.
The tagged portion leaves Direct and stands as its own channel. Open that channel and revenue, RPS, AOV (average order value, the revenue per order) and CVR (conversion rate, the share of sessions that reached a purchase) are laid out by utm_campaign. Results per placement are read inside that expansion.
RevenueScope can be called directly from ChatGPT or Claude. The AI you connect reads your own EC data and answers. No aggregation setup and no SQL to write. Asked "for each print QR code, how much is one session earning?", the shape of the answer, written out for one month of fictional store N, looks like this.
| Campaign | Sessions | Revenue | RPS | AOV |
|---|---|---|---|---|
| flyer-insert-2608 | 400 | ¥80,000 | ¥200 | ¥8,000 |
| poster-store-2608 | 300 | ¥30,000 | ¥100 | ¥6,000 |
| postal-flyer-2608 | 200 | ¥10,000 | ¥50 | ¥5,000 |
| pop-register-2608 | 1,200 | ¥0 | ¥0 | — |
Note: this table is one example, shown to illustrate. What runs behind the button is the sample store's sample data (a fictional site with sample data, refreshed daily), so the campaign names and the amounts shown there are different ones.
The RPS leader is the flyer in the package, and it also came out highest on AOV at ¥8,000. The people who ordered after scanning spend more per order, which makes this entrance worth printing more of. The card by the register produces more than half the sessions with no revenue attached, so it gets evaluated separately — not as an entrance to purchase, but as a prompt for a return visit or a repeat order.
The next move settles itself. Next month's print budget leans toward the flyer in the package, the leader on both RPS and AOV. The card by the register keeps its quantity while you check the following month for whether return visits are happening after the scan. With a campaign name on each placement, print, ads and email all land on the same screen every month, so this decision comes out in the same shape each time.
FAQ#
Frequently asked questions#
Q. Isn't the scan count from a QR code generation service enough?
A. It tells you how many times the code was scanned. What it does not tell you is whether that scan became an order. To follow it through to the order, put a marker on the URL it resolves to and read it on the site side. RPS comes out of sessions and revenue on the site alone, so there is no need to reconcile it against scan counts.
Q. Can UTM be added to QR codes that are already printed?
A. If the URL was built on a mechanism whose destination can be changed, you can handle it by adding UTM to the destination. A QR code with a fixed URL embedded directly has to be remade. In either case, visits scanned before the tag went on do not come apart.
Q. For utm_medium, is print or offline the better choice?
A. Either is fine. What decides it is not the content of the value but fixing on one inside the company. Mixed values split the same print promotion into two in the aggregation, and you end up merging it back by hand every time you compare.
Q. Visits from social also land in Direct. Can they be told apart from QR?
A. Visits from QR codes you tagged can be separated out by campaign name. Why untagged social traffic stays in Direct is covered in when social revenue hides in Direct. Marking the QR side first makes it easier to narrow down what the remaining Direct actually is.
Summary#
Visits from a printed QR code bundle into Direct because no referrer information is passed, and that is correct behavior. Reviewing your settings will not correct it.
What you print from here on can be split. The type of medium in utm_source, a shared value that identifies print promotion in utm_medium, placement and period in utm_campaign. Decide those three, then generate the QR code from a URL built in the Campaign URL Builder. Keep the values in lowercase with hyphens and fix on one convention inside the company.
And what you forgot to tag in the past cannot be recovered. The comparable window starts from the month UTM went on.
In one example from fictional store N, the card by the register accounted for close to 60% of sessions with zero revenue, and the RPS leader was the 400-session flyer in the package. The leader in volume and the leader in revenue sat in different placements.
The next flyer and the next card you print should go to the printer with UTM already on the URL. Whatever you mark today is that much more to decide with next month.
See which ads actually drive revenue, at a glance
Free up to 5,000 sessions/month, AI connection included. No credit card required. Up and running in 5 minutes.