
Open your shop's analytics and, these days, smartphones likely make up most of your traffic. "If this much is coming from phones, then mobile is the star of our revenue"—it's tempting to think.
But traffic volume and revenue are two different things. By device (smartphone, PC, tablet), the share who buy (conversion rate, CVR), the amount per order (average order value), and revenue per session (RPS) all differ quite a bit. Smartphones can have lots of traffic yet convert poorly, while PCs are fewer in number but sell efficiently—that reversal is not unusual. This article walks through, in order, why revenue plays out differently by device, which numbers to compare them on, and why keeping that comparison aligned by hand turns out to be heavy.
Table of contents
This article in brief#
- Smartphone, PC, and tablet differ in conversion rate (CVR), average order value, and revenue per session (RPS). Traffic counts alone won't tell you which device sells efficiently
- The device with the most traffic isn't necessarily the one that sells best. Smartphones are often high in count but convert poorly, while PCs are low in count but efficient—a common reversal
- What to look at is RPS by device. It surfaces the leak hidden behind traffic volume—for example, a low smartphone conversion rate
1. Smartphone and PC sell differently#
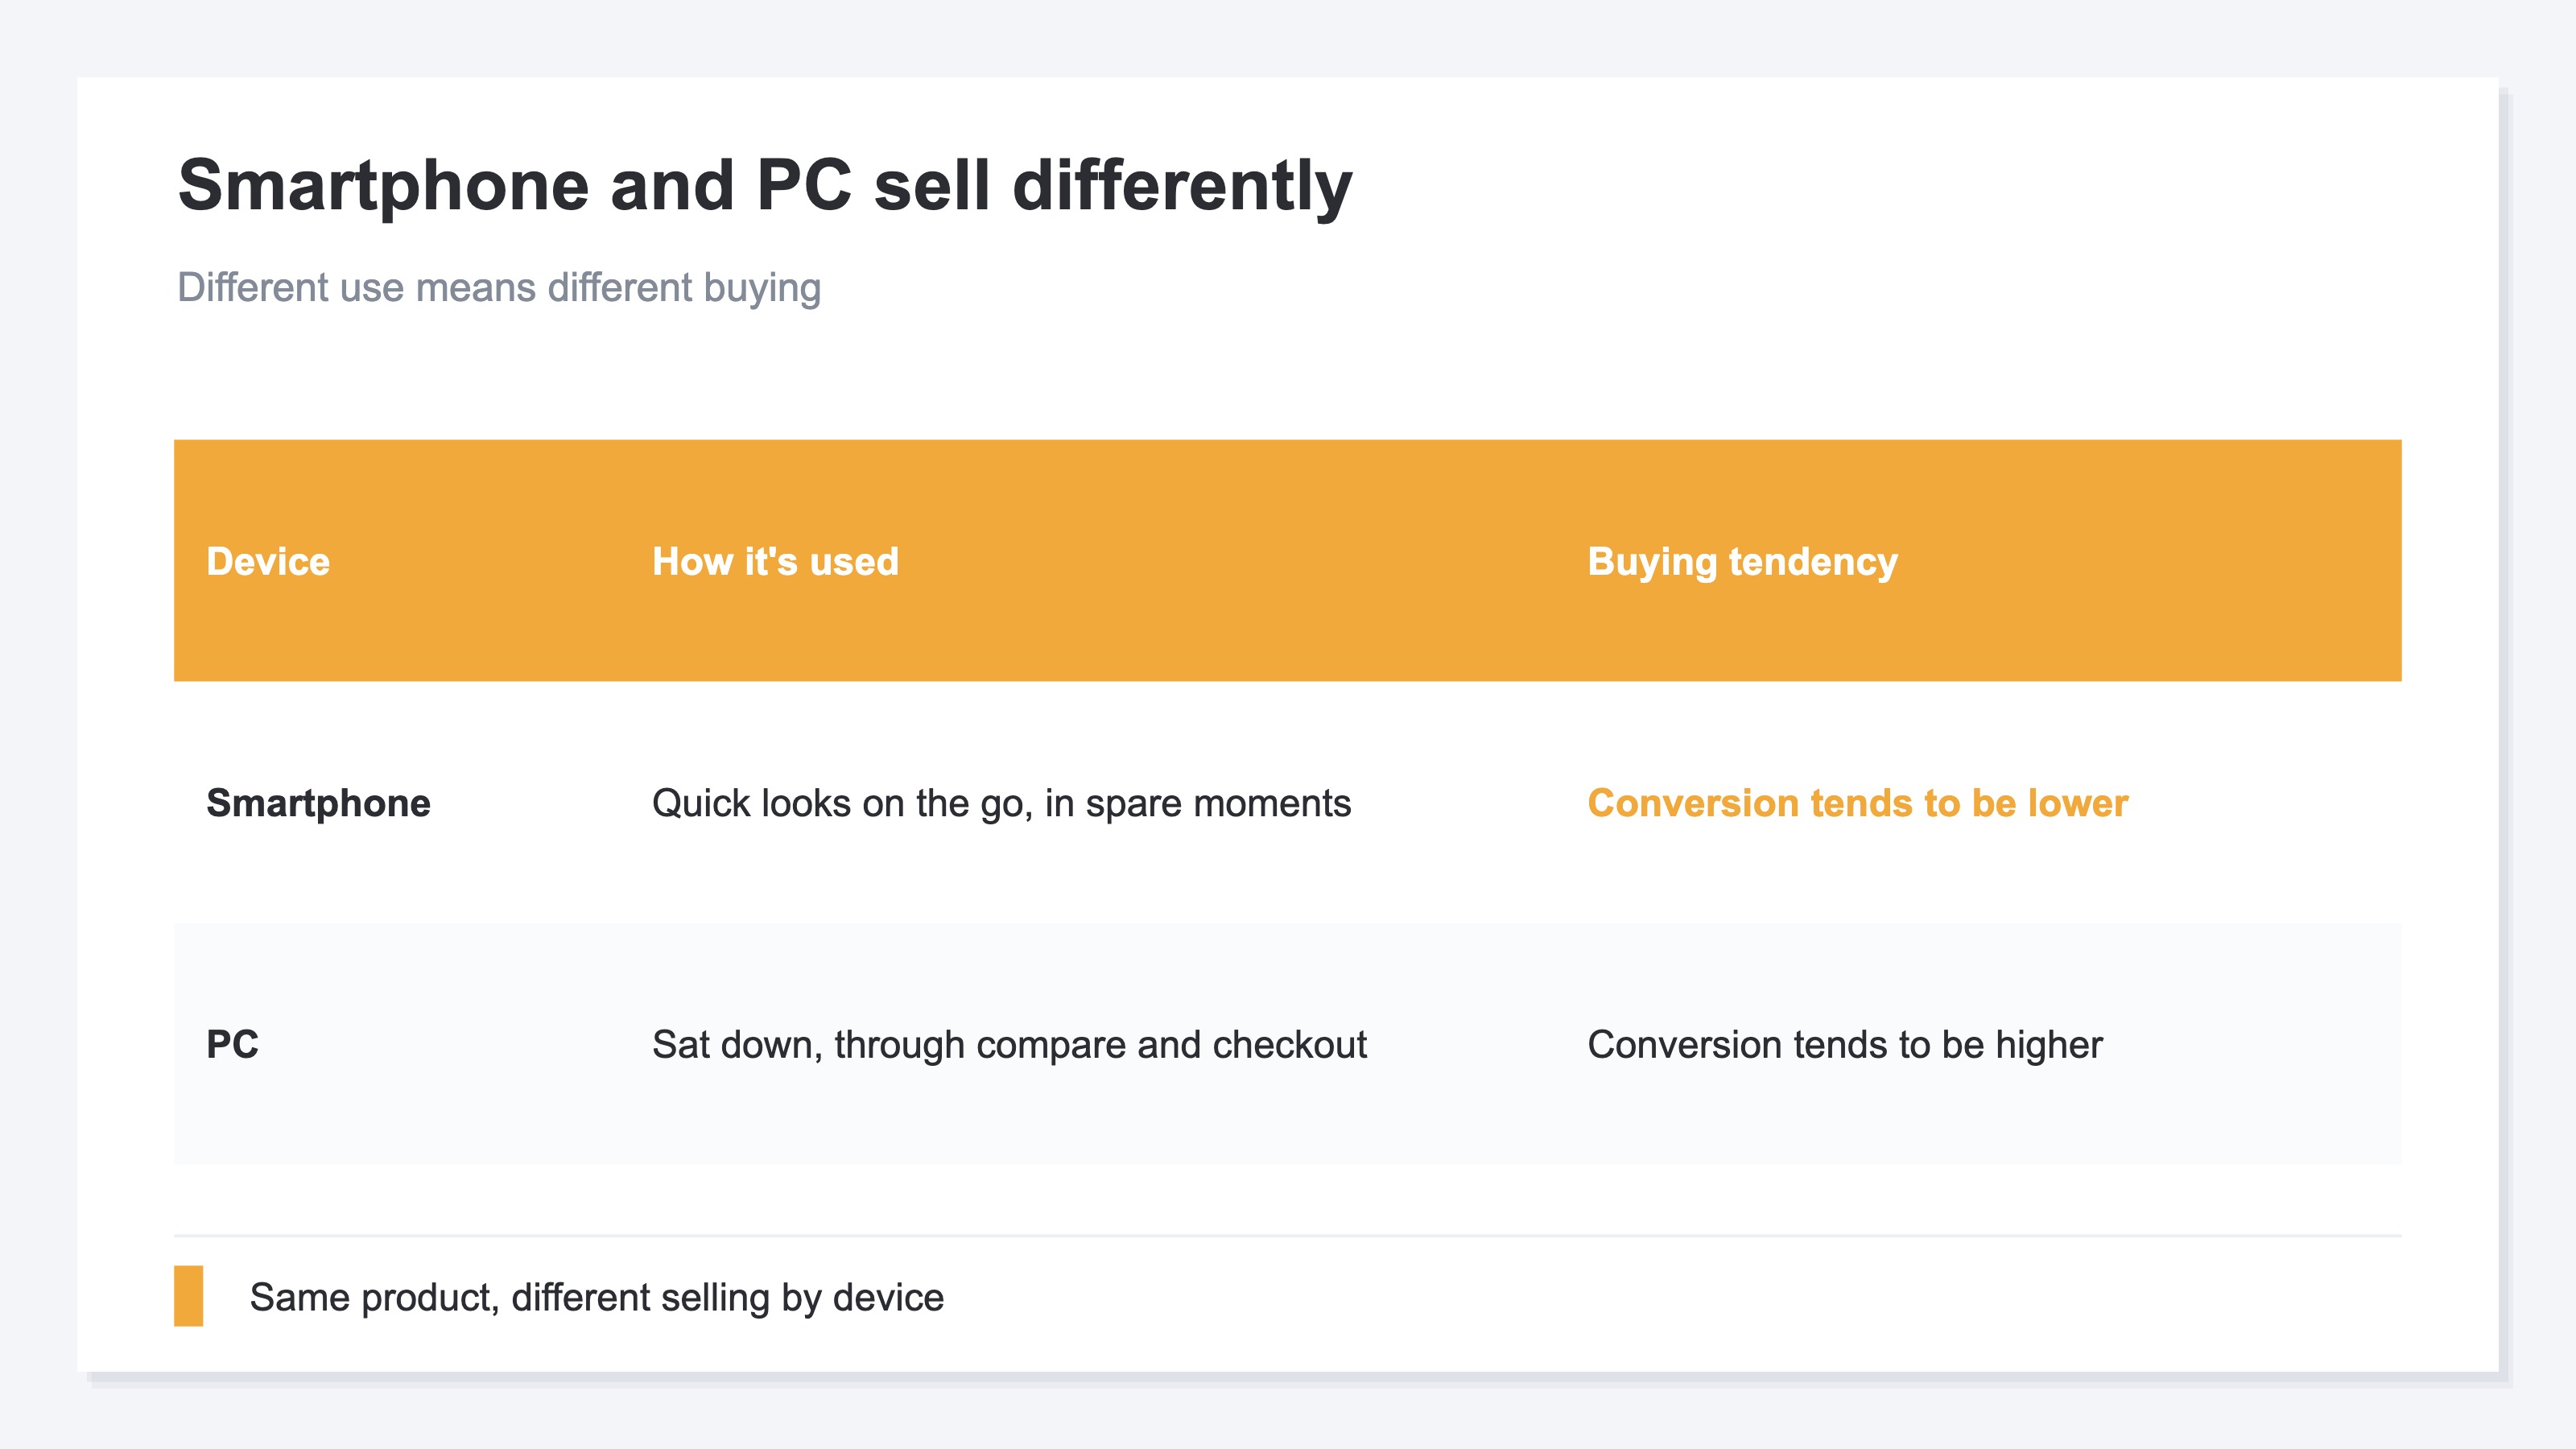
In short, the same product sells differently depending on whether it's being viewed on a smartphone or a PC.
Smartphones are often used on the go or in spare moments—not the setting for careful comparison and purchase. The screen is small and input is fiddly, so people drop off mid-purchase more easily. PCs, by contrast, tend to be used when someone sits down to look, making it easier to get through comparison and checkout. So even with the same amount of traffic, the share who buy (conversion rate, CVR) often comes out higher on PC. CVR is the share of visits that ended in a purchase. If that number differs between smartphone and PC, naturally revenue plays out differently too.
Average order value (the average amount per purchase) can differ by device as well. On a PC, where people can browse at leisure, bulk purchases are more likely; on a smartphone, it's often a single quick buy. When these two—conversion rate and order value—differ by device, revenue per session (RPS = Revenue Per Session, revenue divided by session count) varies by device too. In other words, "which device's visits actually generate revenue" can't be seen just by looking at traffic volume.
2. "More traffic" doesn't mean "more sales"#
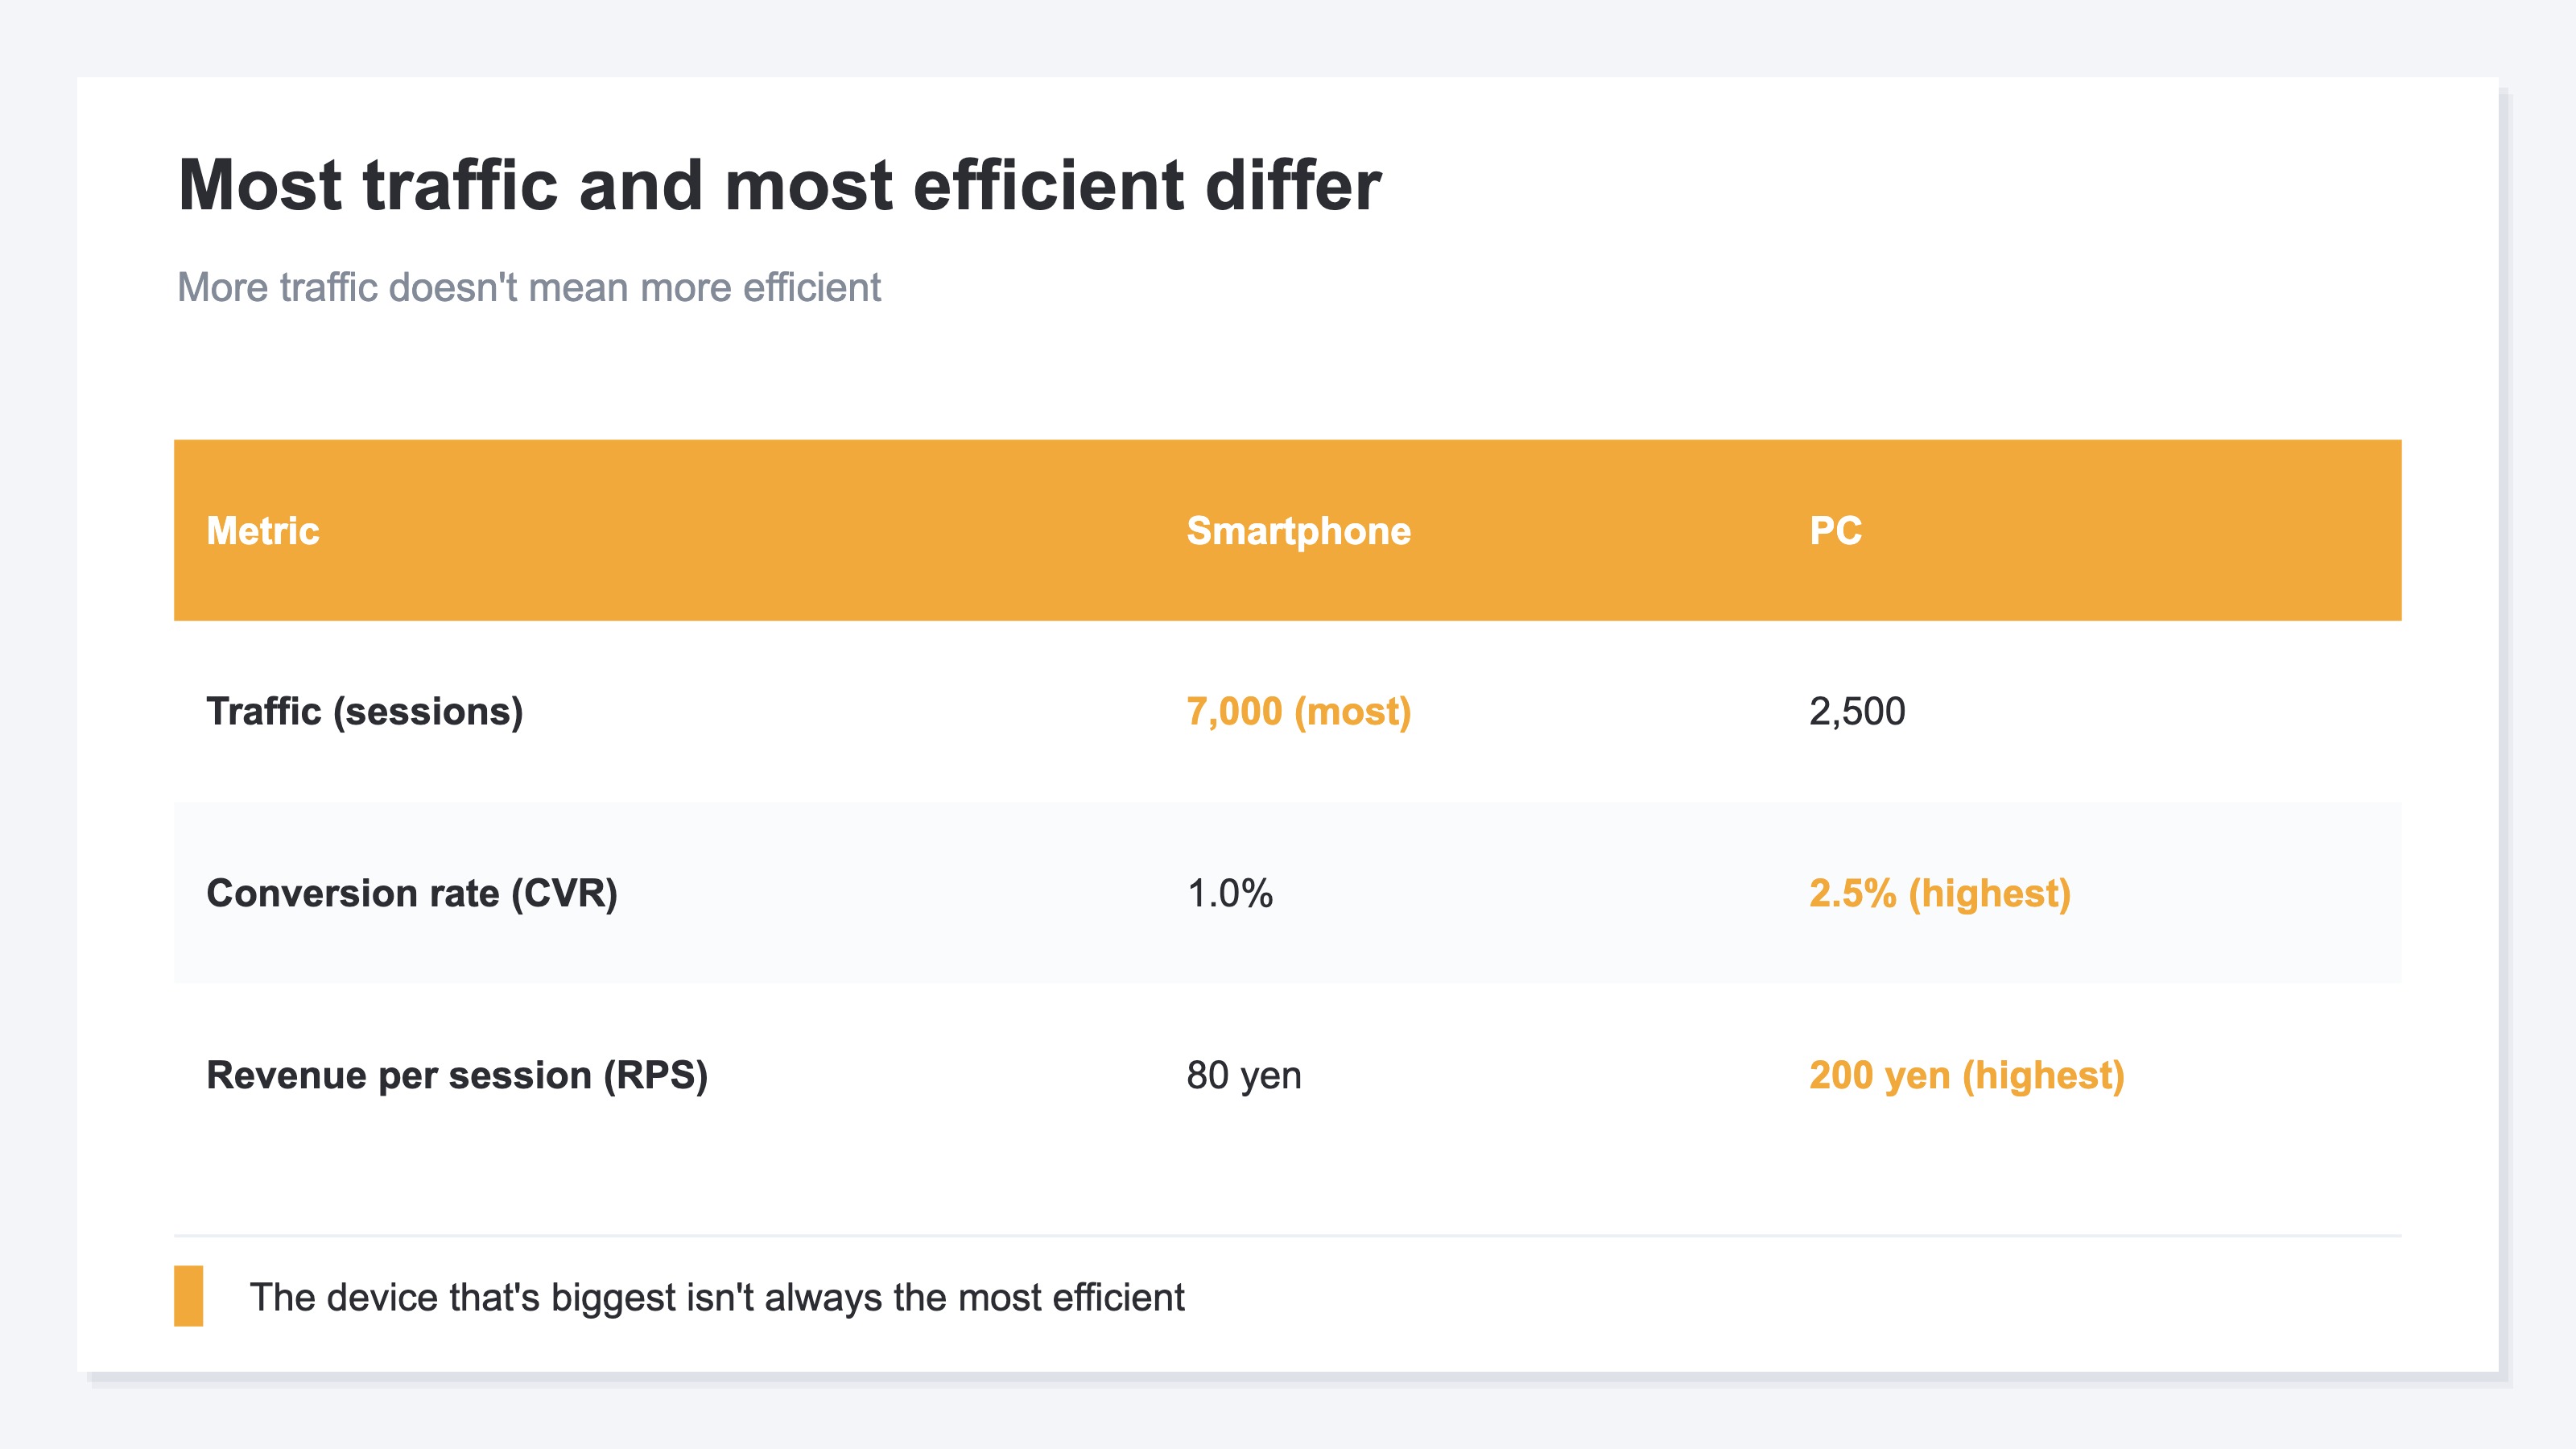
In short, the device with the most traffic isn't necessarily the one that sells best (most efficiently). In fact, reversals are common.
Consider a case like this. Smartphone traffic is 7,000, PC is 2,500. By count alone, smartphone dominates. But look at conversion rate: smartphone 1.0%, PC 2.5%. Even with the same order value, revenue per session (RPS) comes to ¥80 for smartphone and ¥200 for PC—more than double on PC. So the smartphone, which makes up the bulk of traffic, turns out to be the least efficient device per visit.
This isn't a case for "drop smartphone and focus on PC." Smartphone traffic being high is a fact, and if you can lift its conversion rate even a little, the revenue impact is large because the base is large. Put the other way: if you only look at traffic volume, you miss the most important signal—"we're leaving money on the table on smartphone." Only by looking at conversion rate and RPS by device can you tell which device experience you should fix.
3. Leveling devices on the same terms is heavy by hand#
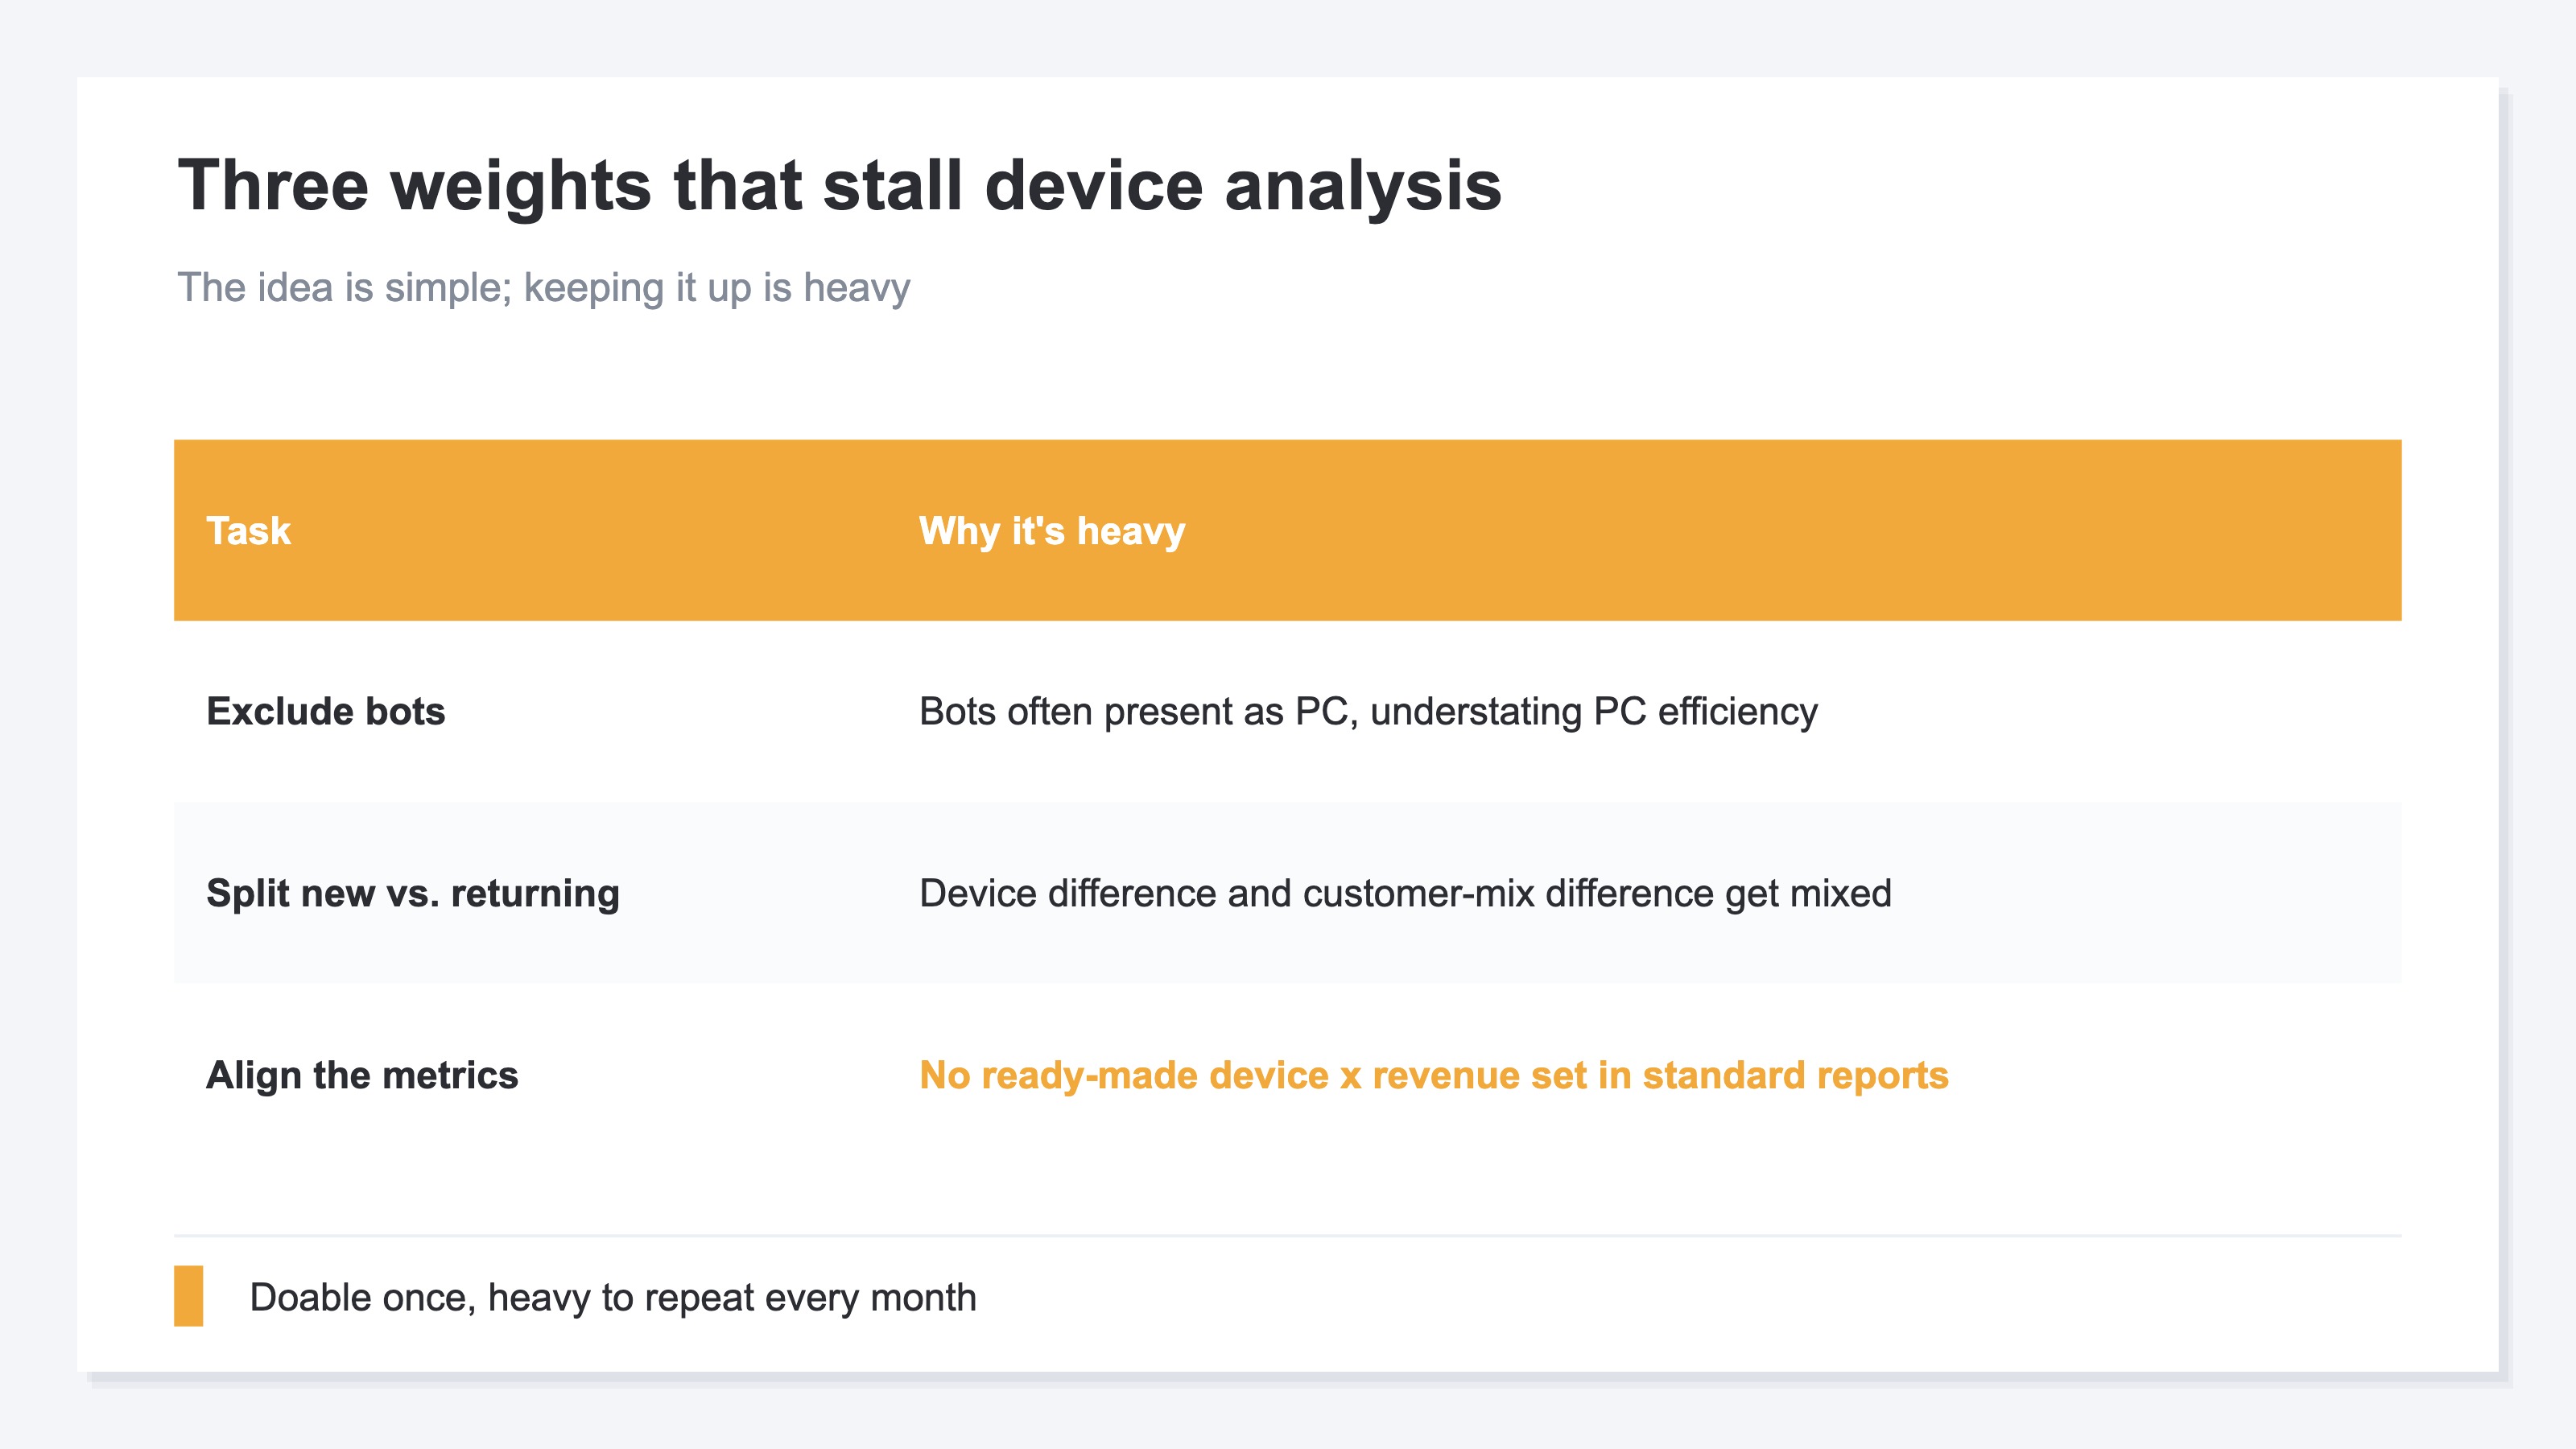
In short, comparing revenue efficiency by device isn't hard in itself. What's hard is aligning that comparison to the right conditions and repeating it every month.
First, there's the work of cleaning the numbers. When automated-program (bot) traffic mixes in, session counts swell and conversion rate and RPS look lower than they really are. Bots often present as PC, which can unfairly understate PC efficiency. Next, the work of separating new from returning. If smartphone skews new and PC skews returning, you can no longer tell whether a gap is a device difference or a customer-mix difference. On top of that, lining up conversion rate, order value, and RPS by device on one screen isn't offered as a ready-made "device × revenue efficiency" set in standard reports—you have to combine the metrics and rearrange them yourself.
Once is doable. But redoing this prep (excluding bots, splitting new/returning, aligning metrics) every month, every time you run a campaign, and keeping the comparison going, is quietly heavy. The idea is simple; keeping it up is the hard part—and that's why device-level analysis tends not to last.
RevenueScope — the solution
When you try to pin down revenue efficiency by device, you keep hitting the same wall: can you exclude automated-program (bot) traffic, split new from returning, and then compare each device's conversion rate, order value, and revenue per session (RPS) on one screen, month after month?
RevenueScope takes that comparison off your hands. It shows each device's (smartphone, PC, tablet) sessions, revenue, conversion rate (CVR), order value, and revenue per session (RPS) on one screen. The figures are after excluding automated-program (bot) traffic (the figures shown are demo data).
| Device | Sessions | Revenue | CVR | Order value | Revenue per session (RPS) |
|---|---|---|---|---|---|
| PC | 2,500 | ¥500,000 | 2.5% | ¥8,000 | ¥200 |
| Smartphone | 7,000 | ¥560,000 | 1.0% | ¥8,000 | ¥80 |
| Tablet | 500 | ¥40,000 | 1.2% | ¥6,667 | ¥80 |
The thing to read in this table is the reversal between traffic and efficiency. Smartphone has the most sessions (7,000) yet the lowest conversion rate (1.0%) and RPS (¥80). PC has fewer sessions (2,500) but stands out with 2.5% conversion and ¥200 RPS. Look at traffic alone and smartphone seems like the star—and you miss its low conversion rate (the leak). Aligned by RPS and conversion rate per device, "the device that's high in count but low in efficiency (smartphone)" and "the device that's low in count but high in efficiency (PC)" separate clearly, giving you the material to decide which experience to fix first.
Let me be clear about one thing. What RevenueScope shows is efficiency on a revenue basis; it does not calculate gross margin (profit after cost of goods) or inventory. Gross margin and inventory belong to a different tool. What RevenueScope takes off your hands is aligning conversion rate, order value, and RPS by device on the same terms and preparing the material to tell which device experience to fix. Where to start is your call.
FAQ#
Frequently asked questions#
Q. How is the device determined?
A. Analytics automatically classifies a visitor's device as "smartphone," "PC," or "tablet" and records it as a device category. So without adding any setup, you can view sessions and revenue by device. The catch is combining conversion rate, order value, and revenue per session (RPS) on top of that, excluding bots, and splitting new from returning to compare "on the same terms"—that's where it gets heavy by hand.
Q. If smartphone's conversion rate is low, should I fix it?
A. First, separate out why it's low. Smartphones get a lot of "just browsing on the go" visits, so a somewhat lower conversion rate is partly natural. On the other hand, if people can't buy because the input form is awkward or images are heavy and slow, fixing it is well worth it. Because the smartphone base is large, even a small lift in its conversion rate has a large revenue impact. A high or low conversion rate is the entry point to "where to fix," not the answer itself.
Q. Should I look by device or by channel?
A. They serve different purposes, so both help. By channel (organic search, ads, email, etc.) shows "which entry point's visits are selling." By device shows "which device experience is leaking." Crossing the two—"smartphone × ads," for example—pinpoints weak spots more precisely. Starting with the conversion rate of your highest-traffic device (usually smartphone) is the easiest place to begin.
Summary#
Smartphone, PC, and tablet differ in conversion rate (CVR), order value, and revenue per session (RPS). So looking at traffic counts alone won't tell you which device sells efficiently—or, conversely, which device is leaking sales.
The reversal that happens most often: the smartphone that makes up the bulk of traffic actually has the lowest conversion rate. Hidden behind the traffic volume, this leak gets overlooked.
What to look at is RPS and conversion rate by device. Exclude bots, split new from returning, and compare on the same terms. Because repeating that every month is heavy by hand, taking that off your plate lets you decide which device experience to fix first—by numbers, not by gut.
Related articles#
- Is Organic Search Actually Contributing to Your Revenue?
- How to Measure Non-Ad Channel Efficiency: RPS, Not ROAS
- What Is RPS (Revenue Per Session): Calculation and Use
References#
- [1] Google Analytics Help "About ecommerce metrics" (2026)
- [2] Google Analytics Help "[Tech] reports" (2026)
See which ads actually drive revenue, at a glance
Free up to 5,000 sessions/month, AI analyst included. No credit card required. Up and running in 5 minutes.
Start measuring for free