When a store steps into cross-border ecommerce, the first thing most look at is the ranking of "how much is selling in which country." The United States is first, Japan second — and from there they decide to pour more into the countries already selling. Japan's Ministry of Economy, Trade and Industry surveys show the cross-border ecommerce market keeps growing [1], and deciding to expand overseas is no longer unusual.
But the first thing this article wants to offer is a slightly different view. The revenue ranking alone won't show you "the countries about to grow." A country with high revenue is simply one that is already selling well. What you really want to know is the country where traffic is still light yet the visitors who arrive buy a lot — the efficient country with real headroom. This article walks through, step by step, how to read country revenue not by total amount but by revenue per session (RPS) and share — an efficiency lens — to find where to focus next.
Table of contents
Key takeaways#
- Decide your next cross-border move by the "total" revenue per country alone and you'll miss things. A country with high revenue only mirrors what's already selling; it doesn't tell you which country is about to grow.
- Read the headroom by efficiency. Compare two figures on one screen — revenue per session (RPS, the average revenue per visit) and each country's share of the whole — and countries buried in the revenue ranking rise to the surface.
- What you want to target is a country with few sessions but high RPS. Traffic is still thin, yet the buying power is strong — steer inventory, shipping terms, and ads there and the same effort has room to grow revenue.
1. Total revenue by country hides the headroom#
Read country revenue in order of "total amount" and your judgment tilts toward "more of the countries already selling." That's why a revenue ranking is a poor starting point for choosing which country to open up next.
The reason is simple. A country with high revenue almost always has high traffic (sessions) too. When many people visit, the revenue total piles up accordingly. But that's a story of "you're able to gather a lot of people" — which is a separate thing from "the visitors who come buy a lot." The size of the total mixes the scale of traffic with the strength of buying power, and just staring at the ranking can't pull those two apart.
So what happens? You add still more ads to countries that already have heavy traffic, and a country with light traffic but strong buying power gets put off as "small revenue, deal with it later." The countries with the most headroom sink to the bottom of the revenue ranking, out of sight.
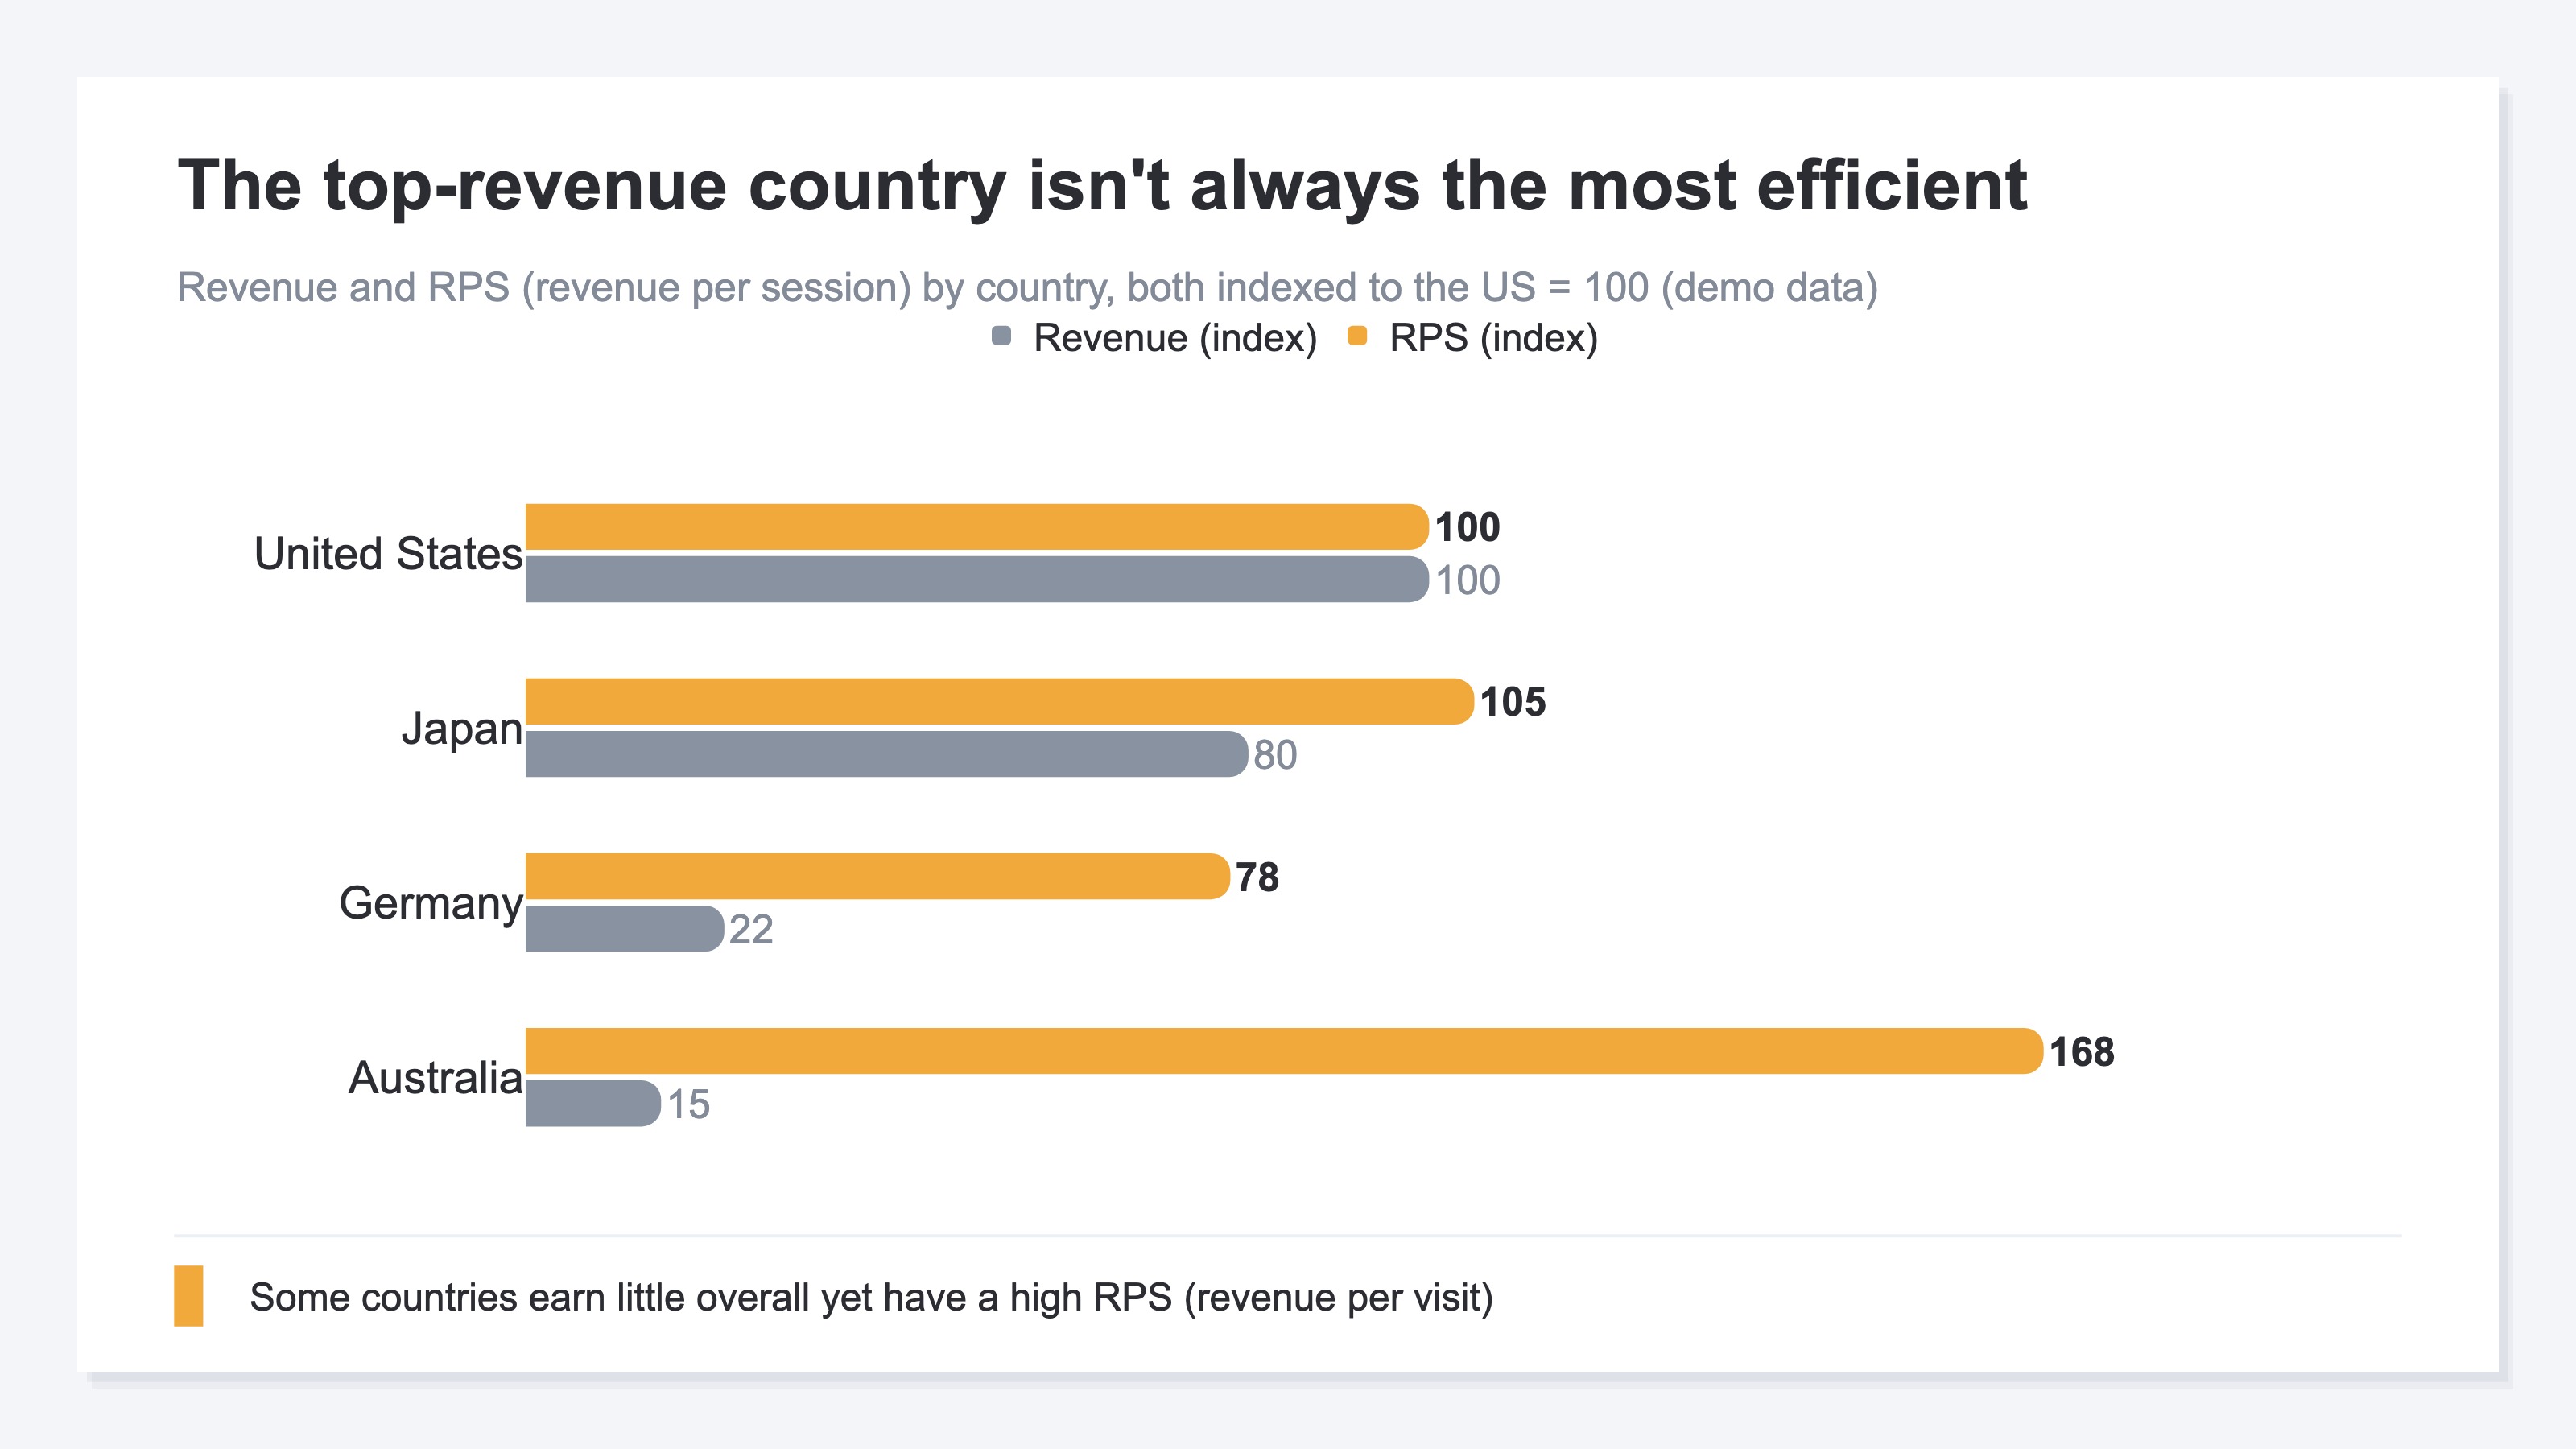
As the figure shows, the country ranked first in revenue isn't necessarily first in efficiency per visit. The order by total and the order by efficiency aren't always the same. So how do you read that "efficiency"? The next chapter lays out the two figures that stand in for the total amount.
2. Read efficiency with revenue per session and share#
Read country efficiency with two figures: revenue per session (RPS) and share. Only with both do you learn "which country, still small in scale, has strong buying power."
First, RPS. RPS (revenue per session) is the average revenue generated per single visit (one session), found by dividing revenue by the number of visits. For the same 100 visits, the more a country's visitors buy, the higher its RPS. So RPS reflects how much a country's visitors buy — the strength of its buying power. Unswayed by how much traffic there is, it lets you compare the value of a single visit itself, which is the difference from a revenue ranking.
The second is share. Of total revenue, what percentage does this country hold? Share expresses "how much you're earning now" — its size. RPS is "the strength per visit," share is "the size within the whole." Compare these two in one table and a country invisible in the revenue ranking rises up: small share (still earning little) yet high RPS (strong buying power) — that's a candidate for headroom.
The point is to add one efficiency (RPS) column at the far right of your usual share-ordered table. That alone surfaces the high-efficiency "hidden honor students" among countries that sat low in the share ranking. But just looking at the table and thinking "toward the high-RPS countries" is still premature. You need to read RPS not on its own, but together with the scale of traffic. The next chapter lays out that combination.
3. Low-session, high-RPS countries are the headroom#
The key to finding headroom is to cross session count with RPS and sort countries into four types. Only by combining RPS with the scale of traffic — not RPS alone — does "the country to invest in next" become clear.
Put session count (more or less traffic) on the horizontal axis and RPS (strong or weak buying power) on the vertical, and countries split into four types.
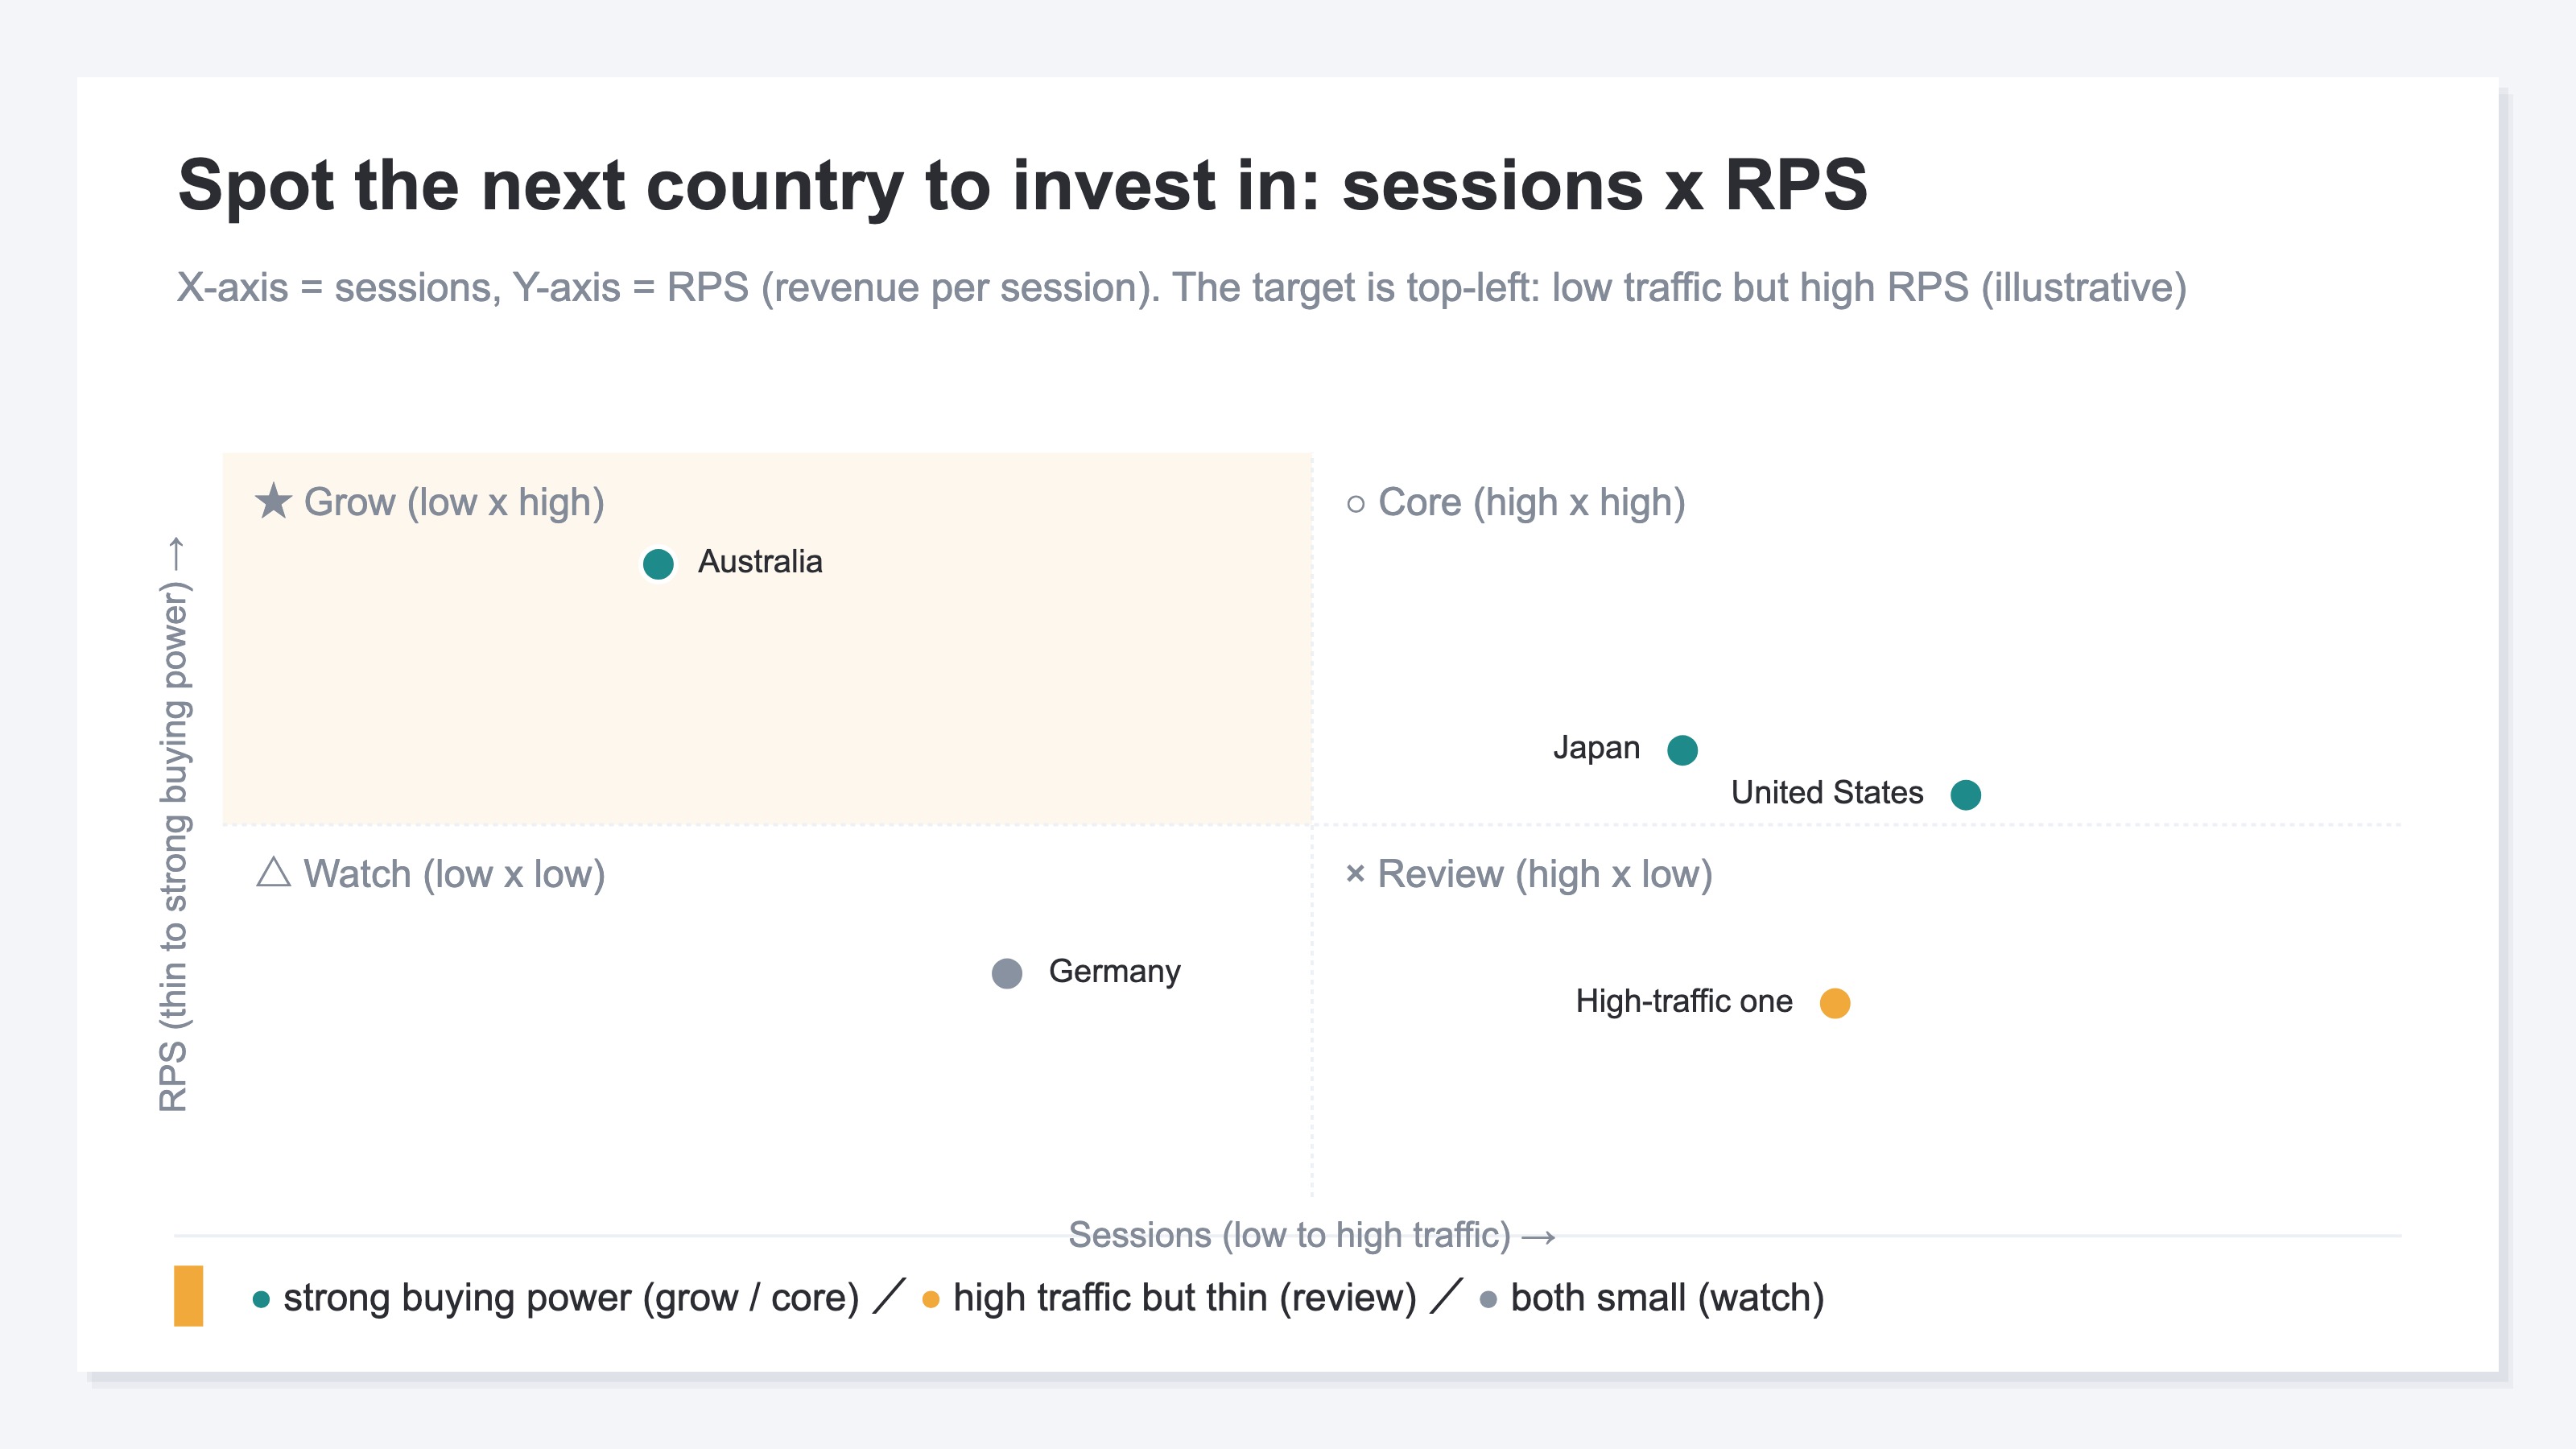
Top right is "core" — high traffic and strong buying power. These countries support your current revenue, and you defend them. Bottom right is "review" — high traffic but weak buying power. You're gathering plenty but they aren't buying, so this is the country to inspect for reasons it's hard to buy: shipping, payment, the language barrier. Bottom left is "wait and see" — both traffic and buying power small. No reason to rush here for now.
And what you target is the top left — the "candidate to grow," low traffic yet high RPS. You've put almost no effort in, yet the visitors who come buy a lot. Add inventory, revisit shipping terms, steer ads toward that country, and the same effort spent gathering traffic has more room to grow revenue. Rather than adding ads to an already-crowded core country, drawing traffic into a candidate-to-grow whose buying power is already proven leaves far more headroom.
4. Cautions when reading country data#
Reading by efficiency widens your view at a stroke, but country data has its etiquette for reading. Miss it and you'll overtrust the efficiency figures.
The first is the presence of Unknown (visits where the country can't be determined). Country figures are estimated from the visitor's IP address. Some visits can't be resolved to a country from the IP, and the correct treatment is not to guess and reassign them to other countries, but to leave them honestly in the Unknown row. When Unknown is large, assume that much margin of error in the country figures.
The second is that it's a separate system from country data on the search side. The impressions and clicks by country you see in a search engine report are about how you appear in Google Search, and they don't tie directly to the revenue or RPS we're handling here. It's useful for finding "countries with search demand but thin revenue," but read them as separate things.
The third is that some figures can't be produced by country. Return on ad spend (ROAS) can't be filtered to a country, so it can't be output by country. Average order value (AOV) isn't in the country table either; on the country axis what you can see goes as far as sessions, revenue, RPS, and share. Beyond that, profit after cost (gross margin), shipping, and tariffs sit outside the scope of revenue analysis to begin with. Country efficiency reflects "which country has headroom," but whether profit remains in that country is something you have to cross-check separately against your own cost and logistics information.
Note that the idea of breaking revenue down by efficiency isn't limited to the country axis. Differences by device are laid out in Revenue breakdown by device, and differences between new and returning visitors in Revenue by new vs. returning, each as a separate lens.
RevenueScope's solution
When you try to read country efficiency, you keep hitting the same wall. The idea is just "compare RPS and share on one screen," yet the material for it never lines up.
A general analytics tool's geo report does give you sessions and revenue by country. But there's no column for RPS, which expresses efficiency, and it isn't shaped to compare share and efficiency on one sheet. So you end up writing out the figures country by country, calculating RPS yourself, and reordering them into a table — repeating this by hand for as many countries as there are. Do this for just the top dozen-plus countries and you run out of steam before you can even think about "where to invest." The idea is easy, yet it gets heavier the longer you keep it up.
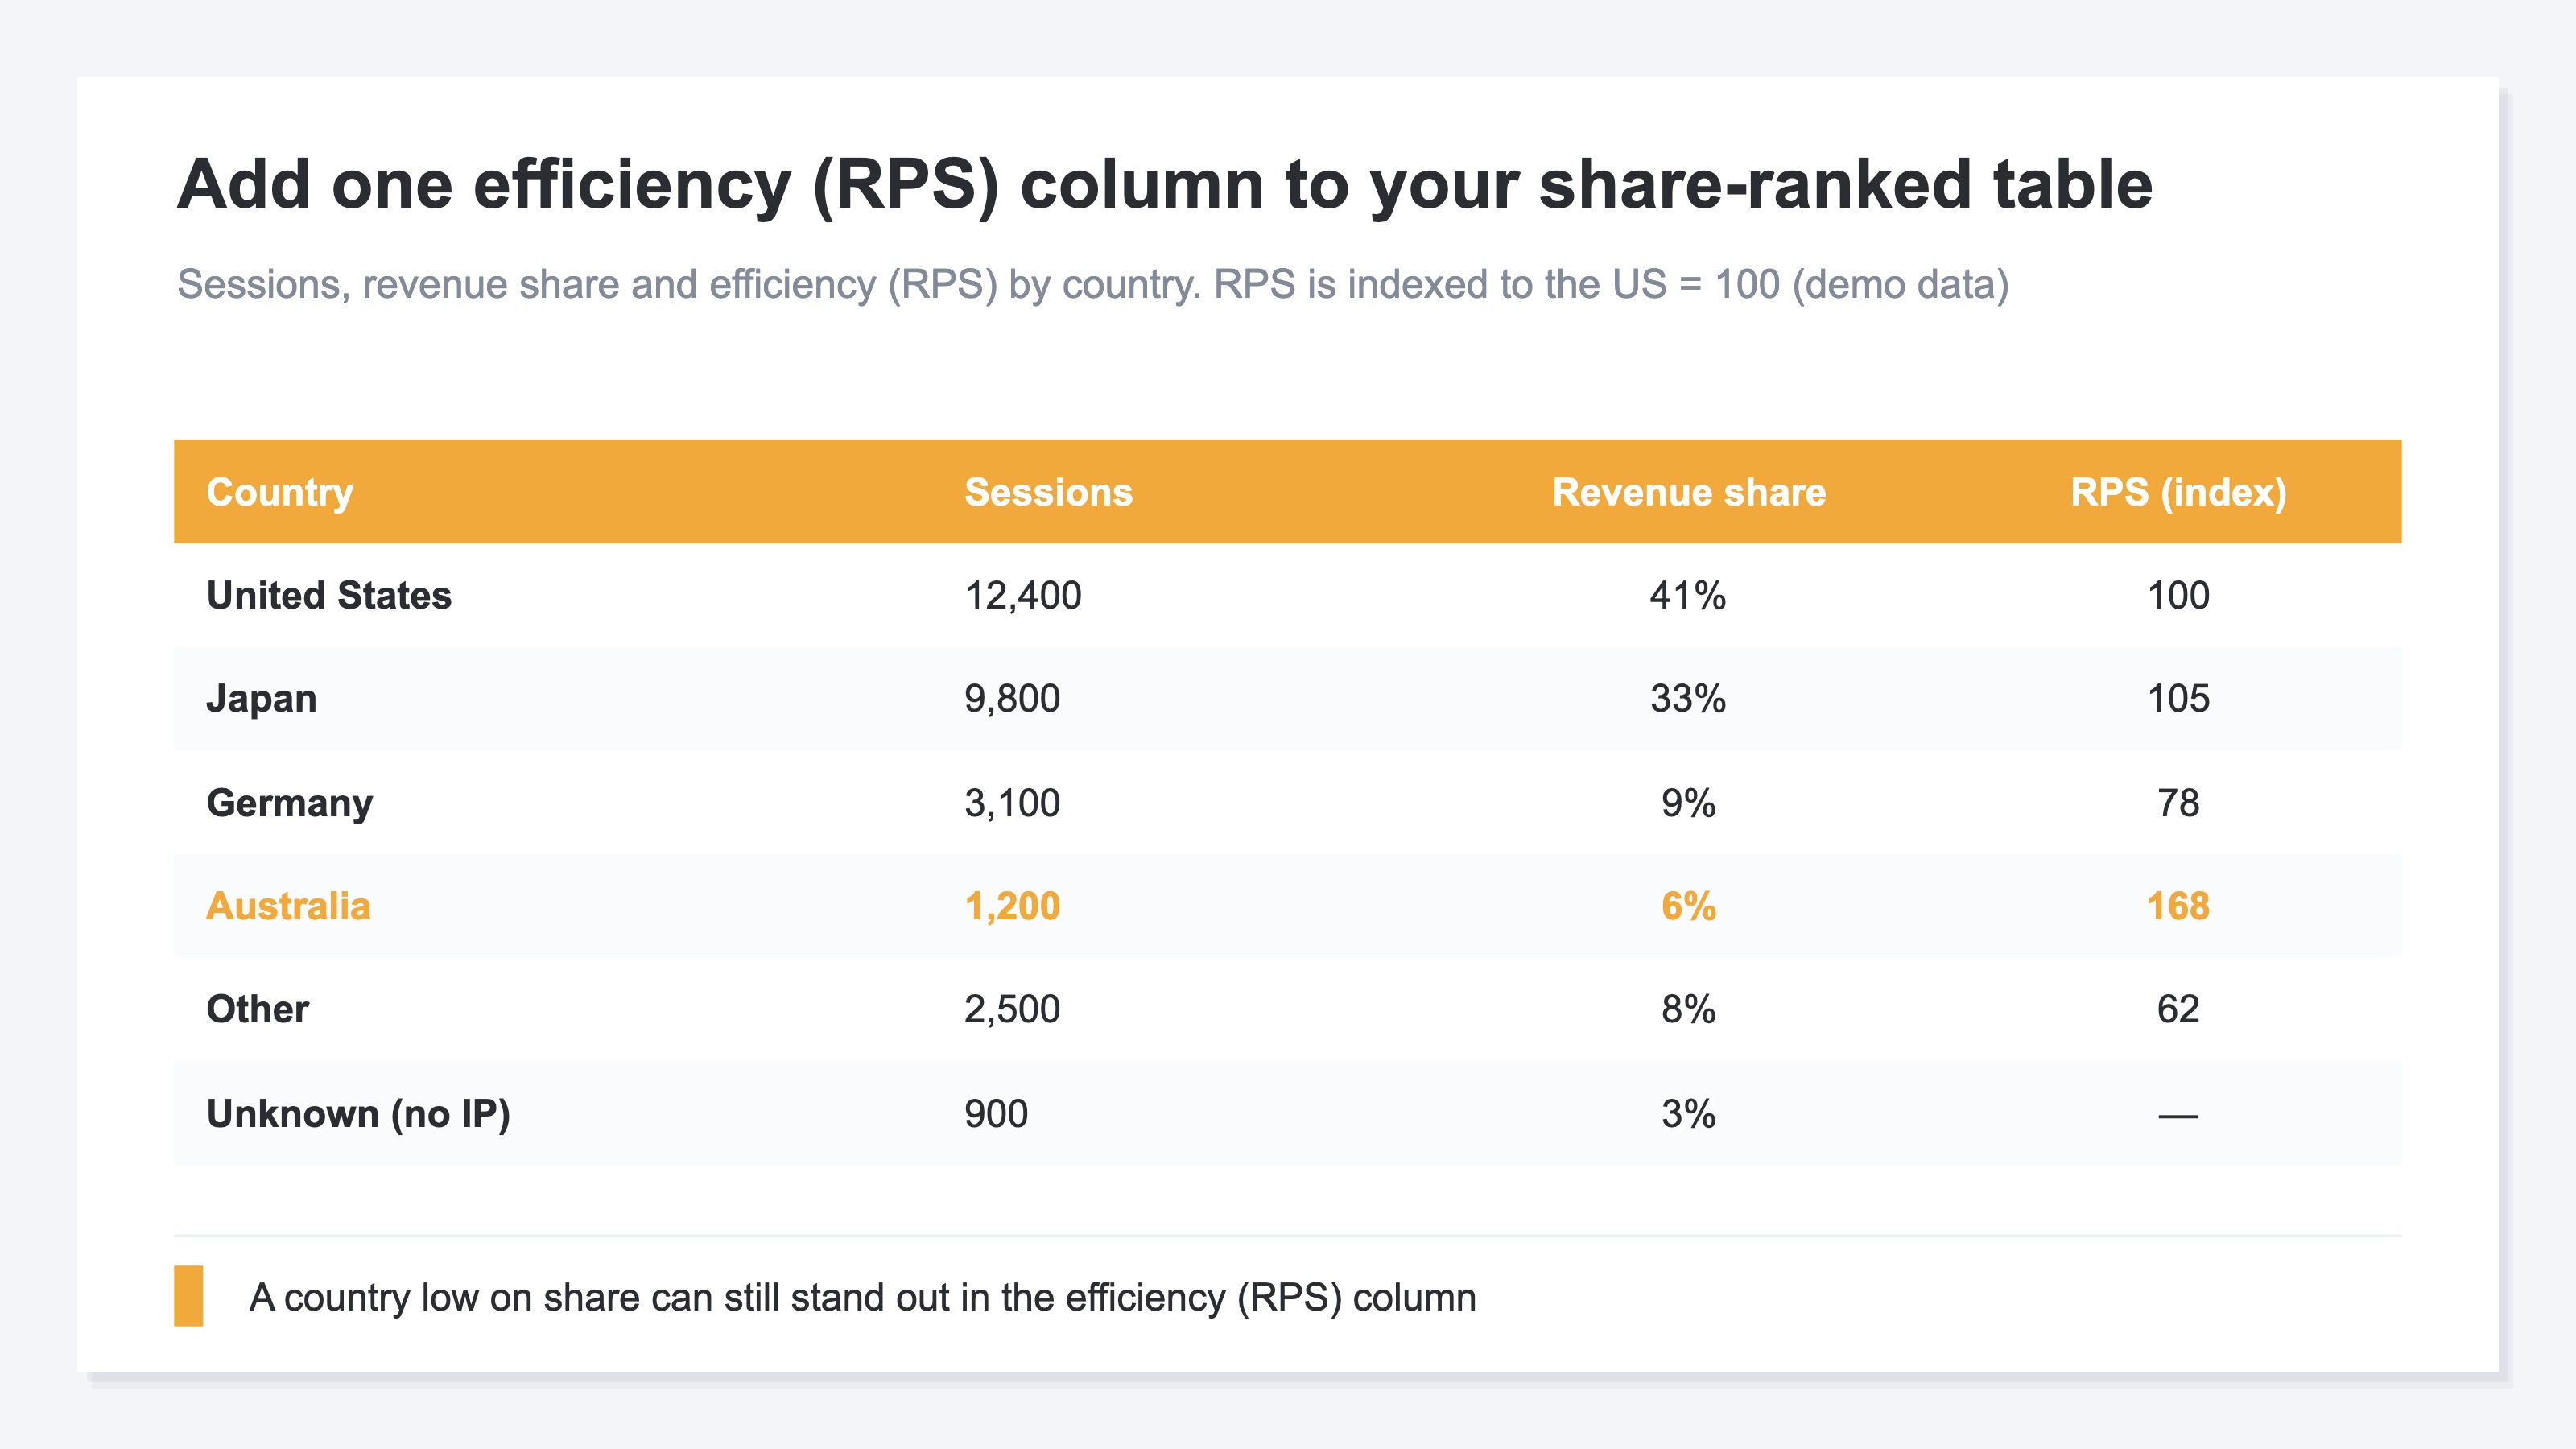
RevenueScope consolidates that scattered material into one table. On top of sessions, revenue, and share by country, it outputs a list with an RPS column for efficiency added at the far right, as is (display uses demo data).
| Country | Sessions | Revenue share | RPS (indexed) |
|---|---|---|---|
| United States | 12,400 | 41% | 100 |
| Japan | 9,800 | 33% | 105 |
| Germany | 3,100 | 9% | 78 |
| Australia | 1,200 | 6% | 168 |
| Other | 2,500 | 8% | 62 |
| Unknown | 900 | 3% | — |
The telling read in this table is that Australia (6%) — easier to count from the bottom of the revenue share — stands a head above the rest in the rightmost efficiency (RPS) column. Traffic is still thin at 1,200, yet the buying power of its visitors exceeds the core United States and Japan. This is exactly the "candidate to grow (low traffic × high RPS)" country from Chapter 3. Watch the share ranking alone and you'd never spot it first. From here the next move comes into view: steer inventory, shipping terms, and ads toward Australia, and rather than adding to a crowded core country, the same effort spent gathering traffic has room to grow revenue — that's the read.
Let's make one thing clear. What RevenueScope outputs on the country axis goes as far as sessions, revenue, RPS, and share. It does not output ROAS or AOV by country, profit after cost (gross margin), or shipping and tariffs. Visits that couldn't be resolved to a country from the IP are not filled in by guesswork but left honestly as Unknown. It assembles the material for which country has headroom, but the final call on which country to invest in is yours to make.
FAQ#
Q1. For the next country to focus on in cross-border ecommerce, shouldn't I decide by the revenue ranking?
As a starting point you may look at it, but decide on that alone and you'll miss the headroom. A country with high revenue almost always has high traffic too, and only mirrors "a country already selling well." The country about to grow is one with still-light traffic where the visitors who arrive buy a lot — that is, a high-efficiency (RPS) country. Add an efficiency column to the revenue ranking and read it that way.
Q2. Between RPS (revenue per session) and share, which should I look at?
Not one or the other — read both together. RPS expresses "the strength of buying power per visit," share expresses "the size within the whole." A country with small share yet high RPS is a candidate for headroom. Cross it further with session count to target a "candidate to grow" with low traffic but high RPS, and the country to invest in next becomes clear.
Q3. Are there figures that can't be produced in country data?
Yes. Return on ad spend (ROAS) can't be filtered to a country, so it can't be output by country. Average order value (AOV) isn't in the country table either; on the country axis what you can see goes as far as sessions, revenue, RPS, and share. Profit after cost, shipping, and tariffs are outside the scope too. And because visits that can't be resolved to a country from the IP remain as Unknown, factor in that margin as well.
Summary#
Decide your next cross-border move by the "total" revenue per country alone and you'll miss things. A country with a big total only mirrors what's already selling; it doesn't tell you which country is about to grow. The size of the total mixes the scale of traffic with the strength of buying power.
Read the headroom by efficiency. Compare revenue per session (RPS) and share on one screen, then cross it with session count to find a "candidate to grow" with low traffic yet high RPS. Start by taking your most recent country data and adding one efficiency (RPS) column to your share-ordered table. Once that's visible, overseas expansion that drifted vaguely "toward the countries already selling" turns into a move with a reason behind it.
See which ads actually drive revenue, at a glance
Free up to 5,000 sessions/month, AI analyst included. No credit card required. Up and running in 5 minutes.
References#
- [1] Ministry of Economy, Trade and Industry "Market Survey on Electronic Commerce" (2024)
- [2] Google Analytics Help "Demographics and Geo dimensions"
- [3] IPinfo documentation (2024)